
Abstract
Onion (Allium cepa) extract was used for the green synthesis of gold and silver nanoparticles. Each colloidal solution exhibited surface plasmon resonance, with a peak at 532 nm for gold nanoparticles and 391 nm for silver nanoparticles. Microscopic results confirmed the presence of spherical shapes. The X-ray diffraction pattern demonstrated a face-centered cubic structure. Both nanoparticles had negative zeta potentials and retained colloidal stability in cell culture medium. Catalytic applications were evaluated for 4-nitrophenol reduction and methyl orange degradation reactions by monitoring with UV-visible spectrophotometry. Furthermore, the nanoparticles demonstrated no significant cytotoxicity against human pancreas ductal adenocarcinoma cells (PANC-1) and human colorectal adenocarcinoma cells (HT-29). PEGylation and diallyl disulphide loading of the gold and silver nanoparticles meaningfully reduced the cell viability of both cell lines. Furthermore, diallyl disulphide loading resulted in more cytotoxicity against PANC-1 cells than against HT-29 cells. Additionally, the gold nanoparticles were more cytotoxic than the silver nanoparticles upon diallyl disulphide loading. Interestingly, after PEGylation and diallyl disulphide loading, the silver nanoparticles exhibited acorn-like shapes, while the gold nanoparticles retained spherical shapes. This result suggested that nanoparticles green-synthesised by onion extract have possibilities as nanocatalysts and drug delivery nanocarriers for catalytic and nanomedicine applications.
Introduction
Nanotechnology has grown rapidly throughout a wide range of research areas, displaying novel applications in chemistry, biology, medicine and material science. Owing to their nanosize (1–100 nm), nanoparticles exhibit distinctive chemical and physical properties when compared with their bulk counterparts. Metal nanoparticles such as gold nanoparticles (AuNPs) and silver nanoparticles (AgNPs) have been used as drug and gene delivery vehicles, cell labelling and imaging agents, chemical and biological sensors, antimicrobial agents and catalysts [Citation1]. In addition, photothermal and photodynamic therapy with AuNPs is one of the major applications due to increasing interest in cancer nanomedicine. Sustainable initiatives are currently a pivotal issue in science. For the synthesis of AuNPs and AgNPs, plant extracts are commonly selected as a green reductant to facilitate the reduction of metal ions via a sustainable synthetic method. Extensive reviews and literature regarding this matter can be found elsewhere [Citation2–7]. Plant extracts have advantages in the green synthesis of metal nanoparticles, including the following: (i) easy obtainability, (ii) no safety issues during handling, (iii) cost-effectiveness, (iv) eco-friendly synthetic routes, and (v) dual roles of the plant materials as a reductant and a stabilising agent [Citation8]. Diverse parts of plants can be used for synthesis, including leaves, flowers, fruits, roots, aerial parts and whole plants [Citation8]. Plant extracts were employed as a reductant for the synthesis of AuNPs and AgNPs, and these green-synthesised nanoparticles have shown antibacterial, anticancer, wound healing and catalytic activities [Citation9–12]. There are two different approaches for the synthesis of metal nanoparticles: (i) top-down and (ii) bottom-up approaches [Citation2]. For top-down approaches, the bulk materials are broken into nanosized particles. Meanwhile, for bottom-up approaches, nuclei are formed by the assembly of atoms and grown to the desired nanoparticles. The latter approach is generally applied in the green synthesis of metal nanoparticles using plant extracts.
Vegetables in the Allium genus, which includes onion, garlic, leeks and chives, have been reported to have cancer preventive effects [Citation13]. Onion (Allium cepa L.) is a widely consumed vegetable worldwide and is known for its characteristic taste. A. cepa has been reported to possess diverse biological activities [Citation14]. Interestingly, epidemiological studies on Allium vegetables showed that there was some relationship between increased consumption of onion and/or garlic and decreased risk of certain cancers such as stomach, colorectal, oesophageal and prostate cancers [Citation13]. Allium genus vegetables possess diverse primary and secondary metabolites including flavonoids, oligosaccharides, arginine, selenium and bioactive organosulfur compounds [Citation13]. Most of the functional and biological activities in the Allium genus are associated with organosulfur compounds [Citation15]. Organosulfur compounds in Allium species include allicin, alliin, diallyl monosulphide, diallyl disulphide (DADS), diallyl trisulphide, S-allyl-L-cysteine, ajoene and N-acetylcysteine [Citation16]. The induction of apoptosis by diallyl monosulphide, DADS and diallyl trisulphide has been reported in malignant tumour cells [Citation16].
In the present report, onion extract was used as a green reductant for the synthesis of AuNPs and AgNPs (referred hereafter as OE-AuNPs and OE-AgNPs). UV-visible spectrophotometry was employed to observe surface plasmon resonance (SPR) and assess the colloidal stability of each nanoparticle solution. The shape and size of the nanoparticles were determined by field emission transmission electron microscopy (FE-TEM) and atomic force microscopy (AFM). The crystal structures were investigated by high-resolution X-ray diffraction. Additionally, the surface potential of the nanoparticles was determined by zeta potential measurements, and the hydrodynamic size by dynamic light scattering was also measured. For evaluating the chemical applications of the nanoparticles, catalytic activity in 4-nitrophenol (4-NP) reduction and methyl orange (MO) degradation reactions in the presence of sodium borohydride were evaluated by UV-visible spectrophotometry. Furthermore, cytotoxicity against human pancreas ductal adenocarcinoma cells (PANC-1) and human colorectal adenocarcinoma cells (HT-29) was assessed to explore the use of the nanoparticles as novel drug delivery nanocarriers.
Experimental
Materials
Potassium gold(III) chloride, 4-nitrophenol, silver nitrate, sodium hydroxide, poly(ethylene glycol) methyl ether thiol (MW 2 kDa), diallyl disulphide (≥98%) and sodium borohydride were purchased from Sigma-Aldrich (St. Louis, MO, USA). Methyl orange was purchased from Fluka (AG, Buchs, Switzerland). Foetal bovine serum (FBS) was obtained from GE Healthcare HyClone™ (Victoria, Australia). Penicillin-streptomycin (10,000 U/mL), trypsin-EDTA (0.25%, without phenol red) and high-glucose Dulbecco’s modified Eagle’s medium (DMEM) were obtained from Gibco (Thermo Fisher Scientific, MA, USA).
Instruments
A Dimension® Icon® system was run in tapping mode to obtain AFM images (Bruker Nano, Santa Barbara, CA, USA). A mica substrate (grade V-1, 25 mm by 25 mm, 0.15 mm thick, SPI Supplies Division of Structure Probe, Inc., West Chester, PA, USA) was used for loading the colloidal solution of nanoparticles to acquire the AFM images. A JEM-2100F FE-TEM operating at 200 kV was used to acquire TEM images (JEOL, Tokyo, Japan). On a carbon-coated copper grid (carbon type-B, 300 mesh, Ted Pella, Redding, CA, USA), a colloidal solution of nanoparticles was pipetted, and the sample-loaded grid was permitted to dry at ambient temperature for 24 h. To record UV-visible spectra, a Shimadzu UV-2600 UV-visible spectrophotometer was used (Shimadzu Corporation, Kyoto, Japan). Spectra of the nanoparticle solution were acquired in the range of 300–800 nm using a quartz cuvette (1.5 ml). Zeta potentials were observed on a NanoBrook 90Plus Zeta system (Brookhaven Instruments Corporation, New York, USA). X-ray diffraction data were obtained using a high-resolution X-ray diffractometer with a CuKα radiation source (λ = 0.154056 nm) (Ultima IV, Rigaku, Japan).
Preparation of the extract
Onions were from Muan Province (Junbook, Republic of Korea) and purchased from a local market. Peels and roots were removed and not used for extraction. Afterwards, the materials were thoroughly washed with deionised water. The materials (2 kg) were homogenised in a blender and extracted with ethanol (6 L) for 1 h under sonication. Whatman® filter papers were used to filter water fractions to remove insoluble materials and impurities. The evaporation of ethanol was processed by a rotary evaporator under reduced pressure. Then, the freeze-dried material was obtained with a vacuum freeze dryer. This freeze-dried material was labelled as “onion extract” in the following section for the green synthesis. The freeze-dried material was dissolved in deionised water to prepare a stock solution with a final concentration of 4% (w/v) for the green synthesis described in the following section.
Green synthesis of OE-AuNPs and OE-AgNPs
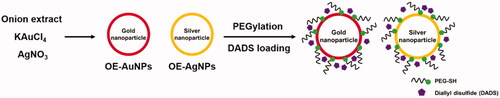
Optimal reaction conditions were selected by varying the following factors: (i) concentration of onion extract, (ii) concentration of either potassium gold(III) chloride or silver nitrate, (iii) reaction temperature, and (iv) reaction time. All stock solutions (4% (w/v) onion extract, 10 mM potassium gold(III) chloride and silver nitrate, 100 mM sodium hydroxide) were prepared in deionised water. The optimum reaction conditions were ultimately determined as follows. Potassium gold(III) chloride (final concentration of 0.4 mM, for OE-AuNPs) or silver nitrate (final concentration of 0.2 mM, for OE-AgNPs), sodium hydroxide (final concentration of 1 mM) and onion extract (final concentration of 0.7 mg/mL) were mixed in a 4-ml glass vial, and the final volume was adjusted to 2 ml by the addition of deionised water. The mixture was vortexed, and oven incubation was performed at 80 °C for 2 h. The SPR signal of the synthesised nanoparticles was monitored by acquiring UV-visible spectra over the range of 300–800 nm. Schematic illustration of green synthesis is shown in .
Figure 1. Schematic illustration of green synthesis in the current report.
PEGylation of OE-AuNPS and OE-AgNPs
PEGylation of both nanoparticle solutions was conducted according to a previous report with minor modifications [Citation17]. Poly(ethylene glycol) methyl ether thiol (MW 2 kDa, simply PEG-thiol) was used for the PEGylation process. Two different ratios of PEG-thiol: Au or Ag (molar ratio 1:10 and 1:20) were used. For PEGylation, each nanoparticle solution (1 ml) was mixed with isopropyl alcohol (final concentration of 22%, v/v), sodium hydroxide (final concentration of 1.5 mM), and PEG-thiol in a 4-ml glass vial. The final volume was adjusted to 2 ml by the addition of deionised water. The reaction mixture was then incubated at ambient temperature for 1 h in the dark with stirring (800 rpm). Next, the reaction mixture was incubated at ambient temperature for 24 h. After 24 h of incubation, centrifugation (14,000 rcf, 20 °C, 40 min) was conducted to remove unreacted PEG and isopropyl alcohol. Then, the pellet was recovered for DADS loading in the following section.
DADS loading on PEGylated OE-AuNPs and OE-AgNPs
PEGylated nanoparticles from the previous section were used for DADS loading. A stock solution of DADS was prepared in ethanol. The mixture was prepared by mixing a given PEGylated nanoparticle solution (1 ml) and DADS (final concentration of 0.1%, v/v) in a 4-ml glass vial. The reaction mixture was sonicated for 30 min at ambient temperature, and the synthesised DADS-loaded nanoparticles were stored at 4 °C in a refrigerator for further study. Hereafter, the following abbreviations were utilised for the DADS-loaded nanoparticles: (i) DADS-P10-AuNPs (PEG-thiol: Au 1:10), (ii) DADS-P20-AuNPs (PEG-thiol: Au 1:20), (iii) DADS-P10-AgNPs (PEG-thiol: Ag 1:10), and (iv) DADS-P20-AgNPs (PEG-thiol: Ag 1:20).
Cell culture
The following cancer cell lines were purchased from the Korean Cell Line Bank (Seoul, Republic of Korea): HT-29 and PANC-1 cell lines. Cell culture was conducted according to our previous report [Citation18–20]. High-glucose DMEM supplemented with penicillin (100 units/mL), streptomycin (100 μg/mL) and 10% FBS were used for growing the cells. Then, incubation was performed in an incubator at 37 °C (under 5% CO2). Approximately 80% confluence was reached before trypsinization was performed.
Cytotoxicity
The cytotoxicity experiment was conducted by use of the MTT assay on the HT-29 and PANC-1 cell lines according to our previous report [Citation18–20]. Cells were seeded in 96-well plates (5.0 × 10³ cells/well) and incubated for 24 h at 37 °C. Next, four different concentrations of each nanoparticle solution (2.5, 5, 10, and 20 μM Au or Ag concentration) were added, and an additional incubation was performed for 24 h. After incubation, the MTT reagent (10 μL, 50 mg/mL in deionised water) was added, and the mixture was incubated for an additional 3 h. The absorbance was measured at 570 nm using a multidetection microplate reader (Synergy HT, BioTek Instruments, Winooski, VT, USA). Untreated cells were utilised as a control.
Catalytic activity
In a 4-ml quartz cuvette, a mixture of 4-NP or MO solution (0.1 mM, 500 μL) with a freshly prepared sodium borohydride solution (10 mM, 2 ml) was prepared. OE-AuNPs (120 μL and 63 μL) were added to the 4-NP solution, and OE-AgNPs (55 μL and 25 μL) were added to the MO solution. Then, the final volume of the mixture was adjusted to 4 ml by the addition of deionised water. UV-visible spectra were recorded at ambient temperature in the range of 200–700 nm.
Results and discussion
Green synthesis of OE-AuNPs and OE-AgNPs
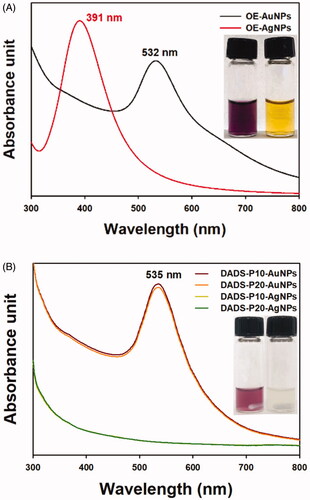
The extraction yield of the onion extract was 5.6%. After synthesis, the OE-AuNPs and OE-AgNPs exhibited their characteristic SPR peaks at 532 nm and 391 nm, respectively (). The inset in shows the colloidal solution of each nanoparticle type: OE-AuNPs (purple colour, left image) and OE-AgNPs (yellow colour, right image). Clear observation of SPR signals suggested that nanoparticles were effectively synthesised by the onion extract, which plays a role as a reductant during the synthesis. In the onion extract, primary and secondary metabolites are found such as carbohydrates, amino acids, vitamins, polyphenols, oligosaccharides, and organosulfur compounds [Citation21]. For the green synthesis of metal nanoparticles, a reducing power of metabolites is an essential factor for a successful synthesis. Specifically, carbohydrates, amino acids, and polyphenols in the onion extract were mostly likely to contribute to a reduction reaction of metal ions. Shervani and Yamamoto have used monosaccharides and polysaccharides as a reductant for the synthesis of AuNPs and AgNPs [Citation22]. Twenty amino acids were also applied as a reductant for the synthesis of AuNPs suggesting that amino acids have sufficient reducing power [Citation23].
Figure 2. SPR observation. (A) OE-AuNPs (black line) and OE-AgNPs (red line). The inset shows a digital photograph of each colloidal solution: OE-AuNPs (left) and OE-AgNPs (right). (B) DADS-P10-AuNPs (red line), DADS-P20-AuNPs (orange line), DADS-P10-AgNPs (yellow line) and DADS-P20-AgNPs (green line). The inset shows a digital photograph of each colloidal solution: DADS-P10-AuNPs (left) and DADS-P10-AgNPs (right).
Colloidal stability of OE-AuNPs and OE-AgNPs
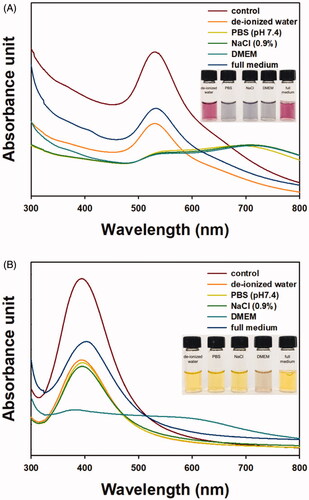
The colloidal stability of nanoparticle solutions is crucial for applications. Five different solutions were used to assess the colloidal stability (). UV-visible spectra of five different solutions of OE-AuNPs are displayed in . Digital photographs of each solution were obtained and are shown in the inset. The highest stability was observed in full medium followed by deionised water. In these solutions, the colour was pink, and the characteristic SPR signal was retained well. Meanwhile, the stability was very low in PBS, NaCl solution and DMEM, and the characteristic SPR peak disappeared. As shown in the inset, the colour of the solution changed to pale grey or pale blue. In the case of OE-AgNPs, only DMEM induced the loss of stability, and the characteristic SPR peak disappeared (). The colour of the solution in DMEM changed to pale brown. The stability was well retained under the other four solutions, and a yellow colour was apparent. For both nanoparticles, the stability was retained very well in full medium. This result suggested that in the following cytotoxicity experiments, the stability in full medium can be retained without any aggregation and/or agglomeration.
Figure 3. Colloidal stability in different solutions. (A) OE-AuNPs and (B) OE-AgNPs. Each inset shows a digital photograph of the nanoparticles in different solutions.
X-ray diffraction pattern of OE-AuNPs and OE-AgNPs
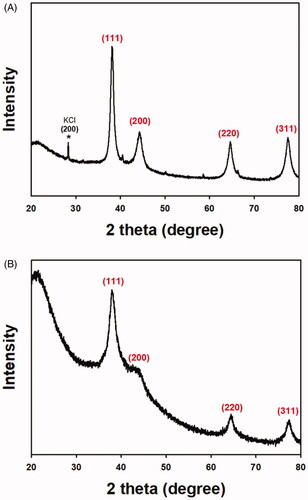
Diffraction peaks of OE-AuNPs were observed at 38.15° (111), 44.23° (200), 64.75° (220) and 77.69° (311) (). A peak of the byproduct KCl was observed at 28.27° (200), which was marked with an asterisk. As shown in , OE-AgNPs also showed diffraction peaks as follows: 38.12° (111), 43.08° (200), 64.33° (220) and 77.10° (311). From the X-ray diffraction patterns, each nanoparticle was confirmed to have a face-centered cubic structure. In both nanoparticles, the (111) peak was a major feature. Thus, the Sherrer equation was employed to roughly determine the size of each type of nanoparticle based on the (111) peak: 10.69 nm for OE-AuNPs and 4.46 nm for OE-AgNPs.
Figure 4. X-ray diffraction pattern. (A) OE-AuNPs and (B) OE-AgNPs. A black asterisk represents a byproduct of the reaction.
Hydrodynamic size and zeta potentials of OE-AuNPs and OE-AgNPs
The hydrodynamic size and zeta potentials of OE-AuNPs and OE-AgNPs are shown in . The hydrodynamic sizes of OE-AuNPs and OE-AgNPs were observed to be 63.6 nm and 479.2 nm, respectively. The zeta potential of both nanoparticles exhibited large negative values: −47.6 mV for OE-AuNPs and -51.1 mV for OE-AgNPs. These large negative zeta potentials suggested that the colloidal stability was high due to repulsion between nanoparticles. Furthermore, both nanoparticles retained their colloidal stability on the shelf for 7 days without any aggregation (data not shown).
Table 1. Hydrodynamic size and zeta potential of the nanoparticles.
FE-TEM and AFM images of OE-AuNPs and OE-AgNPs
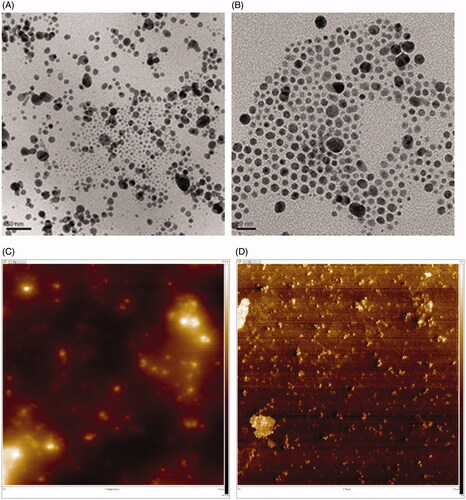
The FE-TEM images of OE-AuNPs displayed spherical nanoparticles (). The AFM images of the height sensor () and phase () also showed spherical shapes. Spherical OE-AgNPs were also observed in the FE-TEM () and AFM images (). Bright spheres in the AFM height sensor image ( and ) indicated nanoparticles, which matched well with the spheres in the phase image ( and ). The phase images provide information regarding the softness/hardness of materials. The brighter the colour in the phase images, the harder the material is. Thus, a careful examination of each phase image demonstrated that the bright spheres were OE-AuNPs () and OE-AgNPs ().
Figure 5. FE-TEM and AFM images of OE-AuNPs. (A) FE-TEM images (scale bar: 200 nm), (B) FE-TEM images (scale bar: 100 nm), (C) AFM height sensor image (2.5 μm × 2.5 μm) and (D) AFM phase image (2.5 μm × 2.5 μm).
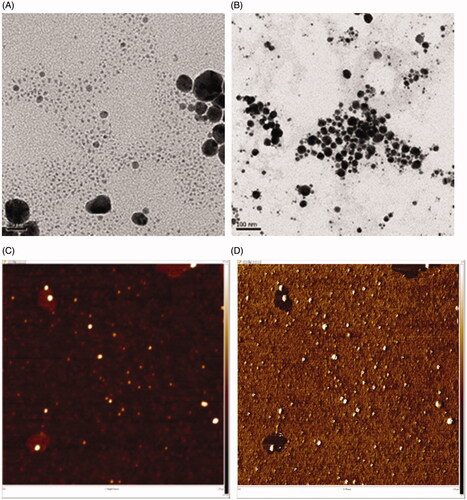
Figure 6. FE-TEM and AFM images of OE-AgNPs. (A) FE-TEM images (scale bar: 50 nm), (B) FE-TEM images (scale bar: 20 nm), (C) AFM height sensor image (2.5 μm × 2.5 μm) and (D) AFM phase image (2.5 μm × 2.5 μm).
Size histograms of OE-AuNPs and OE-AgNPs
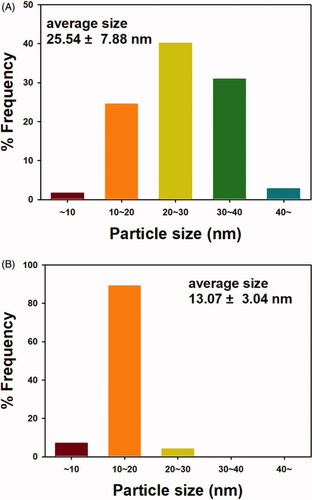
The average size was 25.54 ± 7.88 nm for OE-AuNPs () and 13.07 ± 3.04 nm for OE-AgNPs (). Randomly selected nanoparticles were used for measuring the average size; 249 discrete nanoparticles of OE-AuNPS and 200 discrete nanoparticles of OE-AgNPs were selected from FE-TEM images. For OE-AuNPs, the most frequent size was 20–30 nm (40.1% frequency), followed by 30–40 nm (30.9% frequency) (). In the case of OE-AgNPs, the highest frequency was observed at 10–20 nm (89.0% frequency).
Figure 7. Size histograms. (A) OE-AuNPs and (B) OE-AgNPs.
Catalytic activity of OE-AuNPs and OE-AgNPs
The catalytic activity results are shown in and and . The catalytic activity of OE-AuNPs was assessed using the reduction reaction of 4-NP to 4-aminophenol (4-AP) in the presence of excess sodium borohydride (). Under excess sodium borohydride, 4-NP formed 4-nitrophenolate anions with absorbance at 400 nm. As soon as the OE-AuNP catalyst was added, the absorbance at 400 nm decreased. The reaction was completed faster when a larger amount (120 μL) of OE-AuNPs was added than when a smaller amount (63 μL) was added (). From the plot of time (sec) and ln(Ct/C0) (C0 is the concentration of 4-NP determined by the absorbance at 400 nm at time 0 and Ct is the concentration of 4-NP determined by the absorbance at 400 nm at time t), a linear relationship was shown with a rate constant of 2.0 × 10⁻³/s for the 63-μL addition and 3.5 × 10⁻³/s for the 120-μL addition of the OE-AuNP catalyst ( and ). In our previous report, the final product, 4-AP, was purified, and its structure was elucidated by 1H-NMR spectroscopy [Citation24]. Similar results were observed when the OE-AgNP catalyst was employed for MO degradation (). For the MO degradation reaction, the absorbance at 460 nm was selected to determine the rate constant. This absorbance decreased with time in the presence of the OE-AgNP catalyst. A linear relationship between time (sec) and ln(Ct/C0) was also observed (). Regarding the OE-AgNP catalyst, the rate constant was 3.3 × 10⁻³/s for the 20-μL addition and 6.4 × 10⁻³/s for the 55-μL addition ().
Figure 8. UV-visible spectra of the 4-NP reduction reaction by sodium borohydride in the presence of the OE-AuNP catalyst. (A) 120-μL addition of the OE-AuNP catalyst, (B) 63-μL addition of the OE-AuNP catalyst, and (C) a plot of ln(Ct/C0) as a function of time (sec) from the data of (A) and (B).
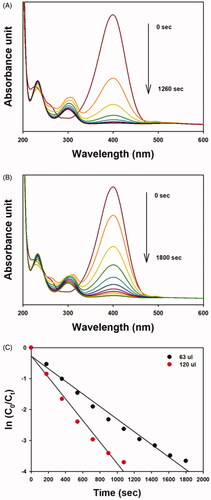
Figure 9. UV-visible spectra of the MO degradation reaction by sodium borohydride in the presence of the OE-AgNP catalyst; (A) 55-μL addition of the OE-AgNP catalyst, (B) 25-μL addition of the OE-AgNP catalyst, and (F) a plot of ln(Ct/C0) as a function of time (sec) from the data of (A) and (B).
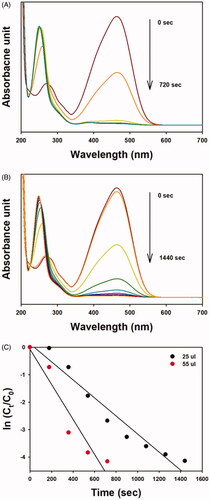
Table 2. Assessment of catalytic activity of OE-AuNPs and OE-AgNPs.
DADS loading onto PEGylated nanoparticles to produce DADS-P10-AuNPs, DADS-P20-AuNPs, DADS-P10-AgNPs and DADS-P20-AuNPs
PEGylation is a commonly accepted strategy to enhance the efficiency of drug delivery. PEGylation of nanoparticle surfaces protects nanoparticles from aggregation, opsonisation, and phagocytosis; moreover, it prolongs circulation time in the system and reduces systemic toxicity [Citation25]. The factors that affect the circulation time of PEGylated nanoparticles are as follows: (i) PEG molecular weight, (ii) PEG content, surface density and conformation, and (iii) physicochemical properties of the nanoparticle core [Citation25]. It was established that a PEG molecular weight of 2 kDa or higher is necessary to protect nanoparticles from opsonisation [Citation25]. In the current report, we selected 2 kDa PEG for the PEGylation process. We selected DADS for loading onto PEGylated OE-AuNPs and OE-AgNPs. Jing and co-workers reported the antitumor mechanism of DADS in in vitro and in vivo models of triple-negative breast cancer cell lines [Citation26]. They found that treatment of triple-negative breast cancer cell lines with DADS reduced viability, increased apoptosis, and suppressed metastatic potential [Citation26]. Moreover, an inhibited activation of the beta-catenin pathway is a major mechanism of the antitumor activity of DADS. Treatment of human breast adenocarcinoma (MDA-MB-231) xenograft mice with DADS resulted in reduced tumour volume and weight and increased apoptosis [Citation26]. Powolny and Singh reported that DADS alters carcinogen metabolism and protects chemically induced cancer in animal models [Citation27]. However, DADS also suppresses the growth of cancer cells by inducing apoptosis and arresting the cell cycle [Citation27].
For DADS delivery, it was loaded onto PEGylated OE-AuNPs and OE-AgNPs, and the SPR peak is displayed in . The maximum SPR absorbance was detected at 535 nm for DADS-P10-AuNPs and DADS-P20-AuNPs. When compared with the SPR of OE-AuNPs, a small redshift (3 nm) was observed after PEGylation and DADS loading. In the case of OE-AgNPs, PEGylation and DADS loading induced a disappearance of the characteristic SPR peak ().
Hydrodynamic size and zeta potentials of DADS-P10-AuNPs, DADS-P20-AuNPs, DADS-P10-AgNPs and DADS-P20-AuNPs
Despite the disappearance of the SPR peak, we could measure the hydrodynamic size and zeta potential of each type of nanoparticle, as shown in . Generally, it was observed that the hydrodynamic size and zeta potentials were decreased after PEGylation and DADS loading. The samples all had negative zeta potentials. The hydrodynamic size of DADS-P10-AgNPs and DADS-P20-AgNPs was approximately 6 times larger than that of the corresponding AuNPs. DADS-P10-AuNPs (56.2 nm, −10.2 mV) and DADS-P20-AuNPs (57.4 nm, −32.1 mV) exhibited similar hydrodynamic sizes, and both had negative zeta potentials. DADS-P10-AgNPs (348.3 nm, −20.5 mV) and DADS-P20-AgNPs (377.7 nm, −20.1 mV) also showed negative zeta potentials.
FE-TEM images of DADS-P10-AuNPs, DADS-P20-AuNPs, DADS-P10-AgNPs and DADS-P20-AuNPs
After PEGylation followed by DADS loading, FE-TEM images were acquired, which are shown in . Spherically shaped DADS-P10-AuNPs () and DADS-P20-AuNPs () were displayed with a good dispersion state. The observed lattice fringe spacing is shown in inset (0.25 nm) and inset (0.25 nm). This result showed that the (111) plane was a major plane and confirmed the face-centered cubic structure. This result demonstrated that the shape and crystallinity of the nanoparticles were retained after PEGylation and DADS loading.
Figure 10. FE-TEM images. (A) DADS-P10-AuNPs (scale bar: 50 nm), (B) DADS-P20-AuNPs (scale bar: 50 nm), (C) DADS-P10-AgNPs (scale bar: 50 nm), (D) DADS-P10-AgNPs (scale bar: 20 nm), (E) DADS-P20-AgNPs (scale bar: 50 nm) and (F) DADS-P20-AgNPs (scale bar: 20 nm).
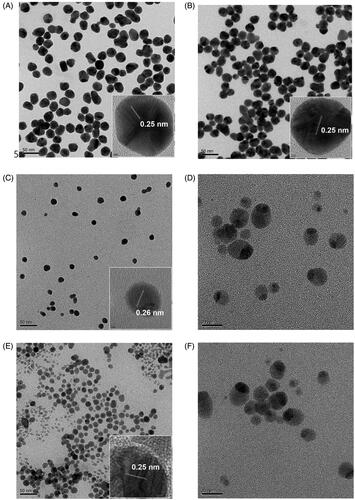
In the case of DADS-P10-AgNPs and DADS-P20-AgNPs, the SPR signal disappeared in the UV-visible spectra, as shown in . Thus, it was indispensable to obtain FE-TEM images to observe the shape, size and crystalline structure. The FE-TEM images clearly revealed that the DADS-P10-AgNPs () and DADS-P20-AgNPs () exhibited acorn-like shapes with a good dispersion state. Two sphere-shaped nanoparticles combined together to generate the acorn-like shape (). Additionally, the lattice fringe spacing was observed to be 0.26 nm for the DADS-P10-AgNPs ( inset) and 0.25 nm for the DADS-P20-AgNPs ( inset), confirming the main (111) plane of the face-centered cubic structure. Most green syntheses using plant extracts have generally produced spherical shapes; however, the crystallinity of the AgNPs was maintained after PEGylation and DADS loading, but the spherical shape changed to an acorn-like shape. In our previous reports, anisotropic shapes of AgNPs, including snowman-like and asymmetric dumbbell shapes, were synthesised via a green route using Caesalpinia sappan and Garcinia mangostana extracts [Citation28,Citation29].
Metal-selenium hybrid nanoparticles with acorn-like shapes have been reported by Park and co-workers, in which Se nanoparticles (approximate diameter of 20 nm) were reacted with Au precursors with thermal treatment [Citation30]. Small Au clusters were bound on the surface of the Se nanoparticles. Then, under high thermal conditions, the Au clusters migrated and coalesced to form nanoparticles by the Ostwald ripening process [Citation30]. The production of core–shell Au@(TiO2, SiO2) nanoparticles with acorn shapes has also been reported [Citation31]. However, the polyol process, which is a distinctive soft chemical method, is a plausible mechanism for the generation of acorn-like shapes in the current report. It has been reported that AgNPs were synthesised by a polyol process under mild and high thermal conditions in which PEG can act as both a reductant and a stabilising agent [Citation32,Citation33]. For DADS-P10-AgNPs and DADS-P20-AgNPs, Ag precursor ions were attached on the surface of the AgNPs and finally were grown to make acorn-like shapes with the aid of PEG as a reductant. The comprehensive mechanism for the formation of acorn-like shapes should be investigated, and it is our future work.
Size histograms of DADS-P10-AuNPs, DADS-P20-AuNPs, DADS-P10-AgNPs and DADS-P20-AgNPs
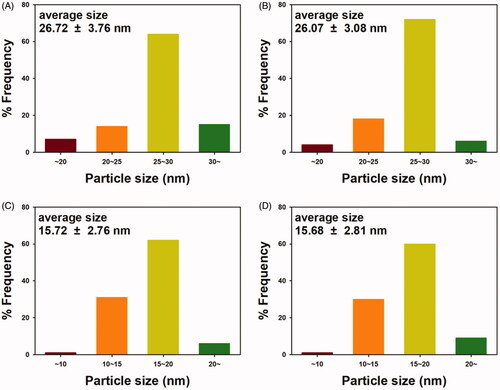
Next, the average size of nanoparticles was determined; the size histograms are displayed in . PEGylation and DADS loading did not affect the size of the nanoparticles when compared with that of the OE-AuNPs and OE-AgNPs (): DADS-P10-AuNPs (26.72 ± 3.76 nm), DADS-P20-AuNPs (26.07 ± 3.08 nm), DADS-P10-AgNPs (15.72 ± 2.76 nm), and DADS-P20-AgNPs (15.68 ± 2.81 nm). The number of discrete nanoparticles counted for each size histogram was as follows: DADS-P10-AuNPs (one hundred twenty), DADS-P20-AuNPs (one hundred fifty-one), DADS-P10-AgNPs (one hundred nine), and DADS-P20-AgNPs (one hundred eighty-seven).
Figure 11. Size histograms. (A) DADS-P10-AuNPs, (B) DADS-P20-AuNPs, (C) DADS-P10-AgNPs and (D) DADS-P20-AuNPs.
Cytotoxicity assessment
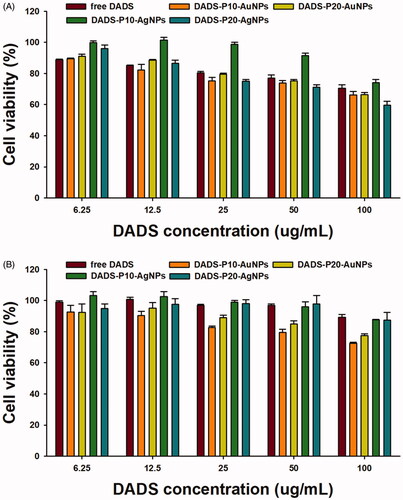
As shown in , the OE-AuNPs and OE-AgNPs exerted no significant cytotoxicity in the range of 2.5–20 μM (based on the Au or Ag concentration) against the HT-29 and PANC-1 cell lines. This result indicated that both nanoparticles can be used as drug delivery vehicles, such as for delivering DADS in the present report. Therefore, we PEGylated and DADS-loaded both OE-AuNPs and OE-AgNPs to investigate the possibilities of using the nanoparticles as drug delivery nanocarriers. The cytotoxicity of four nanoparticle samples (DADS-P10-AuNPs, DADS-P20-AuNPs, DADS-P10-AgNPs and DADS-P20-AgNPs) against the HT-29 and PANC-1 cell lines is shown in . When compared with the OE-AuNPs and OE-AgNPs (), the DADS-loaded nanoparticles showed cytotoxicity against both cell lines. Generally, AuNPs (DADS-P10-AuNPs and DADS-P20-AuNPs) showed higher cytotoxicity than that of AgNPs (DADS-P10-AgNPs and DADS-P20-AuNPs) at DADS concentrations of 6.25–100 μg/mL. Interestingly, these four nanoparticle samples were more cytotoxic against the PANC-1 cell line than against the HT-29 cell line. At the highest concentration of DADS (100 μg/mL), the cell viability of the PANC-1 cell line was as follows: DADS-P10-AuNPs (66.2%), DADS-P20-AuNPs (66.4%), DADS-P10-AgNPs (74.1%), and DADS-P20-AgNPs (59.7%). Meanwhile, the cell viability of the HT-29 cell line was higher than that of the PANC-1 cell line: DADS-P10-AuNPs (72.5%), DADS-P20-AuNPs (77.4%), DADS-P10-AgNPs (87.6%), and DADS-P20-AgNPs (87.4%). This result was possibly due to the histological differences between both cell lines. HT-29 cells are multilayered, but PANC-1 cells grow in a single layer like other cells [Citation34]. In other words, compared with PANC-1 cells, HT-29 cells are thought to have decreased cell-drug interactions and reduced cell damage. Therefore, the cell viability of HT-20 was higher than that of PANC-1 in the current report. When considering a reaction ratio of PEG-thiol: Au (1:10 or 1:20), the higher molar ratio of Au (DADS-P20-AuNPs) demonstrated slightly higher cell viability than did DADS-P10-AuNPs for both cell lines. However, DADS-P10-AgNPs exhibited a higher cell viability than that of DADS-P20-AgNPs for the PANC-1 cell line, while a similar cell viability was observed for the HT-29 cell line.
Figure 12. Cytotoxicity assessment of OE-AuNPs and OE-AgNPs against HT-29 and PANC-1 cell lines. (A) OE-AuNPs and (B) OE-AgNPs.
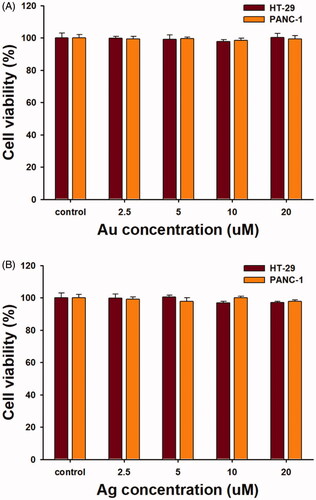
Figure 13. Cytotoxicity assessment of PEGylated and DADS-loaded AuNPs and AgNPs against HT-29 and PANC-1 cell lines: DADS-P10-AuNPs, DADS-P20-AuNPs, DADS-P10-AgNPs and DADS-P20-AgNPs. (A) PANC-1 and (B) HT-29 cell lines.
Conclusions
Onion extract was successfully employed as a green reductant for the synthesis of spherical OE-AuNPs and OE-AgNPs. Spectroscopic and microscopic techniques were employed to characterise the nanoparticles. Both types of nanoparticles demonstrated catalytic activity towards 4-NP reduction and MO degradation reactions, and this result suggested the possibility of these nanoparticles as nanocatalysts. To establish drug delivery nanocarriers, PEGylation and DADS loading was performed on the OE-AuNPs and OE-AgNPs. The size and crystallinity of the nanoparticles were well retained after PEGylation and DADS loading, which was confirmed by the FE-TEM images. Interestingly, the PEGylated and DADS-loaded AgNPs had acorn-like shapes, and investigation of their growth mechanism is our future work. Furthermore, the PEGylated and DADS-loaded nanoparticles showed effective cytotoxicity against PANC-1 and HT-29 cell lines. The cytotoxicity results strongly suggested that OE-AuNPs and OE-AgNPs could be potential drug delivery nanocarriers of biologically active compounds.
Disclosure statement
No potential conflict of interest was reported by the author(s).
Additional information
Funding
References
- Barabadi H, Ovais M, Shinwari ZK, et al. Anti-cancer green bionanomaterials: present status and future prospects. Green Chem Lett Rev. 2017;10(4):285–314.
- Yadi M, Mostafavi E, Saleh B, et al. Current developments in green synthesis of metallic nanoparticles using plant extracts: a review. Artif Cells Nanomed Biotechnol. 2018;46(sup3):S336–S343.
- Park Y. A new paradigm shift for the green synthesis of antibacterial silver nanoparticles utilizing plant extracts. Toxicol Res. 2014;30(3):169–178.
- Park Y, Hong YN, Weyers A, et al. Polysaccharides and phytochemicals: a natural reservoir for the green synthesis of gold and silver nanoparticles. IET Nanobiotechnol. 2011;5(3):69–78.
- Sharma D, Kanchi S, Bisetty K. Biogenic synthesis of nanoparticles: a review. Arab J Chem. 2019;12(8):3576–3600.
- Kanchi S, Kumar G, Lo A, et al. Exploitation of de-oiled jatropha waste for gold nanoparticles synthesis: a green approach. Arab J Chem. 2018;11(2):247–255.
- Sabela MI, Makhanya T, Kanchi S, et al. One-pot biosynthesis of silver nanoparticles using Iboza Riparia and Ilex Mitis for cytotoxicity on human embryonic kidney cells. J Photochem Photobiol B Biol. 2018;178:560–567.
- Hembram KC, Kumar R, Kandha L, et al. Therapeutic prospective of plant-induced silver nanoparticles: application as antimicrobial and anticancer agent. Artif Cells Nanomed Biotechnol. 2018;46(sup3):S38–S51.
- Chugh H, Sood D, Chandra I, et al. Role of gold and silver nanoparticles in cancer nano-medicine. Artif Cells Nanomed Biotechnol. 2018;46(sup 1):1210–1220.
- Pachuau L. Recent developments in novel drug delivery systems for wound healing. Expert Opin Drug Deliv. 2015;12(12):1895–1909.
- Teimouri M, Khosravi-Nejad F, Attar F, et al. Gold nanoparticles fabrication by plant extracts: synthesis, characterization, degradation of 4-nitrophenol from industrial wastewater, and insecticidal activity – a review. J Clean Prod. 2018;184:740–753.
- Zaidi S, Misba L, Khan AU. Nano-therapeutics: a revolution in infection control in post antibiotic era. Nanomedicine. 2017;13(7):2281–2301.
- Nicastro HL, Ross SA, Milner JA. Garlic and onions: their cancer prevention properties. Cancer Prev Res (Phila). 2015;8(3):181–189.
- Teshika JD, Zakariyyah AM, Zaynab T, et al. Traditional and modern uses of onion bulb (Allium cepa L.): a systematic review. Crit Rev Food Sci Nutr. 2019;59(sup1):S39–S70.
- Spyridon P, Francesco DG, Georgia N. Vegetable organosulfur compounds and their health promoting effects. Curr Pharm Des. 2017;23(19):2850–2875.
- Putnik P, Gabrić D, Roohinejad S, et al. An overview of organosulfur compounds from Allium spp.: from processing and preservation to evaluation of their bioavailability, antimicrobial, and anti-inflammatory properties. Food Chem. 2019;276:680–691.
- Abdelrasoul GN, Magrassi R, Dante S, et al. PEGylated gold nanorods as optical trackers for biomedical applications: an in vivo and in vitro comparative study. Nanotechnology. 2016;27(25):255101
- Ahn EY, Jin H, Park Y. Assessing the antioxidant, cytotoxic, apoptotic and wound healing properties of silver nanoparticles green-synthesized by plant extracts. Mater Sci Eng C Mater Biol Appl. 2019;101:204–216.
- Ahn EY, Jin H, Park Y. Green synthesis and biological activities of silver nanoparticles prepared by Carpesium cernuum extract. Arch Pharm Res. 2019;42(10):926–934.
- Lee YJ, Ahn EY, Park Y. Shape-dependent cytotoxicity and cellular uptake of gold nanoparticles synthesized using green tea extract. Nanoscale Res Lett. 2019;14(1):129.
- Liguori L, Califano R, Albanese D, et al. Chemical composition and antioxidant properties of five white onion (Allium cepa L.) landraces. J Food Qual. 2017;2017:1–9.
- Shervani Z, Yamamoto Y. Carbohydrate-directed synthesis of silver and gold nanoparticles: effect of the structure of carbohydrates and reducing agents on the size and morphology of the composites. Carbohydr Res. 2011;346(5):651–658.
- Maruyama T, Fujimoto Y, Maekawa T. Synthesis of gold nanoparticles using various amino acids. J Colloid Interface Sci. 2015;447(1):254–257.
- Seo YS, Ahn EY, Park J, et al. Catalytic reduction of 4-nitrophenol with gold nanoparticles synthesized by caffeic acid. Nanoscale Res Lett. 2017;12(1):7.
- Suk JS, Xu Q, Kim N, et al. PEGylation as a strategy for improving nanoparticle-based drug and gene delivery. Adv Drug Deliv Rev. 2016;99(Pt A):28–51.
- Huang J, Yang B, Xiang T, et al. Diallyl disulfide inhibits growth and metastatic potential of human triple-negative breast cancer cells through inactivation of the β-catenin signaling pathway. Mol Nutr Food Res. 2015;59(6):1063–1075.
- Powolny AA, Singh SV. Multitargeted prevention and therapy of cancer by diallyl trisulfide and related Allium vegetable-derived organosulfur compounds. Cancer Lett. 2008;269(2):305–314.
- Lee YJ, Park Y. Anisotropic snowman-like silver nanoparticles synthesized by Caesalpinia sappan extract and in vitro antibacterial activity. J Nanosci Nanotechnol. 2018;18(6):3880–3887.
- Park JS, Ahn EY, Park Y. Asymmetric dumbbell-shaped silver nanoparticles and spherical gold nanoparticles green-synthesized by mangosteen (Garcinia mangostana) pericarp waste extracts. Int J Nanomedicine. 2017;12:6895–6908.
- Park SH, Choi JY, Lee YH, et al. Formation of metal selenide and metal-selenium nanoparticles using distinct reactivity between selenium and noble metals. Chem Asian J. 2015;10(7):1452–1456.
- Lekeufack D, Brioude A, Mouti A, et al. Core–shell Au@(TiO2, SiO2) nanoparticles with tunable morphology. ChemComm. 2010;46(25):4544–4546.
- Chen DH, Huang YW. Spontaneous formation of Ag nanoparticles in dimethylacetamide solution of poly(ethylene glycol). J Colloid Interface Sci. 2002;255(2):299–302.
- Luo C, Zhang Y, Zeng X, et al. The role of poly(ethylene glycol) in the formation of silver nanoparticles. J Colloid Interface Sci. 2005;288(2):444–448.
- Martínez-Maqueda D, Miralles B, Recio I, et al. HT29 cell line. In: Verhoeckx K, Cotter P, editors. The impact of food bioactives on health: in vitro and ex vivo models. Cham: Springer; 2015. p.113–124.