
Abstract
Long non-coding RNAs and microRNAs are functional regulators in tumour progression. Herein, we revealed the level LINC02163 was up-regulated in CRC tissues and cell lines, and the expression of LINC02163 negatively correlated with prognosis of CRC patients. Functional experiments demonstrated knockdown of LINC02163 significantly attenuated CRC cells proliferation and metastasis. Mechanism analysis showed miR-511-3p could bind LINC02163 and AKT3, and the expressional level of miR-511-3p negatively correlated with the abundance of LINC02163 and AKT3. Inhibition of LINC02163 suppressed cell proliferation, while transfection of miR-511-3p inhibitor or AKT3 in LINC02163-depletion cells restored cell growth and abolished the cell cycle arrest in G0/G1 phase. Therefore, it was indicated that LINC02163 exerted pro-tumour effect through miR-511-3p/AKT3 axis and was prognostic marker for colorectal cancer.
Introduction
Colorectal cancer (CRC) is one of the most common malignancies in female and male, which has already been the healthy threat worldwide, especially in developed countries [Citation1]. The initiation and malignant development of CRC is a multi-stage and a long-term process involving genetic and epigenetic alterations [Citation2–4]. Distant metastasis greatly reduces the 5-year survival rate of CRC patients and is considered as the leading cause of death in approximately 50% of CRC patients [Citation5,Citation6]. In consequence, there is an urgent need to explore the therapeutic targets and molecular mechanism underlying CRC malignization.
MicroRNAs (miRNAs) and long non-coding RNA (lncRNAs) are two major functional sub-groups of non-coding RNAs which are the predominant transcripts of genome. MicroRNAs are single-strand RNAs with length of 18 ∼ 23 nt. By directly binding to seed sequences within 3′-untranslated region (3’UTR) of downstream mRNAs, microRNAs mediate the degradation or translation inhibition of their targeted genes [Citation7]. Decades of studies have proved miRNAs are involved in almost all bioactivities including tumorigenesis [Citation8,Citation9]. Moreover, in recently years, miRNAs have been found to interact with lncRNAs to regulate the occurrence and progression of multi-types of cancer [Citation10,Citation11].
LncRNAs are non-encoding RNA transcripts with length over 200 nt, and the expressional pattern of lncRNAs has tissue and cell specificity. Abnormal expression of lncRNAs is associated with the initiation and progression of numerous types of tumour. Clinical analysis revealed that several lncRNAs are identified as indicators for patient prognosis and diagnosis [Citation12,Citation13]. Except for the effect on transcription and chromatin stability [Citation14,Citation15], lncRNAs also exert their regulatory roles in tumorigenesis by forming lncRNA/miRNA/mRNA axis. In this condition, lncRNAs sequester the binding between miRNAs and target mRNA to modify critical factors expression [Citation10,Citation11,Citation16].
In this study, with the analysis of RNA-seq data, we identified LINC02163 expression was elevated in CRC tissue and was correlated with the prognosis of CRC patients. The deep mechanism studies revealed that LINC02163, together with miR-511-3p and AKT3 formed regulatory axis in CRC cells to promote CRC malignization by affecting cell cycle of CRC cells.
Materials and methods
Clinical samples collection and cell culture
Colon cancer tissues and matched-normal tissues were obtained from patients (n = 15) of the First Affiliated Hospital of Nanjing Medical University. All participants signed the informed consent forms and the project was approved by the Ethical and Scientific Committee of the First Affiliated Hospital of Nanjing Medical University.
Human CRC cell lines (Colo205, SW620, HCT116, HT-29, LoVo, SW480) and normal colon epithelial NCM460 cells were purchased from American Type Culture Collection (ATCC, Manassas, VA). All cell lines were cultured in Roswell Park Memorial Institute (RPMI)1640 medium supplemented with 10% pre-inactivated foetal bovine serum (Gibco, Carlsbad, CA) and 1% penicillin–streptomycin (HyClone, Logan, UT), and were maintained at 37 °C in an incubator containing 5% CO2 atmosphere.
RNA isolation and quantitative real-time PCR (qRT-PCR) analysis
Total RNA was extracted from CRC cells and clinical samples by TRIzol reagent (Invitrogen, Carlsbad, CA) according to the manufacturer’s instructions. Reverse transcription of miRNAs was conducted by PrimeScript™ RT Master Mix (Takara, Dalian, China). The first-strand cDNA was reversely transcribed by SuperScript II Reverse Transcriptase (Invitrogen, Carlsbad, CA), and qRT-PCR were carried out by SYBR Premix Ex Taq II (TaKaRa Biotechnology, Dalian, China). Fold changes of mRNA and miRNA were calculated with the 2−△△Ct method. LINC02163 and other genes were normalised to intracellular GAPDH, and miRNAs were normalised to U6.
Cell counting kit-8 (CCK-8) and colony formation assays
CCK-8 and colony formation assays were performed to determine cell proliferation. Cells for CCK-8 assay were seeded on 48-well plate at density of 4 × 10⁴ per well. At 12 h, 24 h, 48 h and 72 h post seeding, all cells were harvested for experiments. After removing supernatant, the cells were incubated with 10 μl CCK-8 (Beyotime, Shanghai, CHA) working solution for 2 h. The optical density (OD) at 450 nm was recorded with microplate reader (Bio-Rad, Hercules, CA).
For colony formation assay, 2 × 10³ cells were seeded in six-well plates and normally cultured for two weeks. Obtained cell colonies were fixed with 4% paraformaldehyde for 20 min and stained with 0.1% crystal violet (Sigma-Aldrich, St. Louis, MO) for another 10 min. The number of stained colonies was recorded under microscope.
In vitro migration and invasion assays
A 24-well transwell chamber (CoStar, Badhoevedorp, Netherlands) was used for migration and invasion assays. A number of 4 × 10⁴ cells in serum-free media were seeded into the upper chamber with 8 μm-pore sized polycarbonate membrane (Corning Incorporated, Corning, NY) and the lower chamber was loaded with 500 μl RPMI 1640 medium containing 10% FBS. For invasion assay, the upper chamber was pre-coated with 1 mg/ml Matrigel (Sigma-Aldrich, St. Louis, MO). After 24 h incubation, cells were fixed with 4% paraformaldehyde for 15 min and stained with 0.1% crystal violet for 30 min at room temperature. After PBS washing, the plate was imaged and counted under microscope (Olympus, Tokyo, Japan).
Cell transfection and stable cell lines establishment
Transient transfection in present study were conducted by Lipofectamine 2000 reagent (Invitrogen, Carlsbad, CA) according to commercial instructions. The lentivirus used for shRNAs transducing was generated in 293 T cells according to commonly protocol.
Xenograft experiment
Six-weeks old male BALB/c nude mice purchased from Shanghai SLAC laboratory animal company (Shanghai, China) were maintained in pathogen-free facility. SW620-sh-LINC02163, SW620-sh-NC, Colo205-sh-LINC02163 and Colo205-sh-NC (5 × 10⁶ cells) were subcutaneously injected into nude mice. After one week, the size of tumour were measured every 3 days and tumour growth curves were drawn. After 21 days post cells injection, mice were killed by cervical dislocation. All the experiments protocols were in accordance with the ethical standards of the First Affiliated Hospital of Nanjing Medical University.
Luciferase activity analysis
To detect the binding between LINC02163, miR-511-3p and AKT3, complementary and mutant sequences of LINC02163 and AKT3 transcript were reconstituted into a pGL3-basic reporter vector (Promega, Madison, WI) for dual luciferase assay. SW620 and Colo205 cells were seeded in a 24-well plate and were co-transfected with reporter plasmids and miRNA reagent. Luciferase activity was examined by using Dual-Luciferase Reporter Assay System (Promega, Madison, WI) at 48 h post transfection following the manufacturer’s guidance.
Western blot assay
Experimental cells were lysed in ice-cold RIPA buffer (Beyotime, Shanghai, China), followed by centrifuge at 10,000 g for 10 min at 4 °C to remove cell debris. Total protein was separated by 10% SDS-PAGE gel and was removed onto PVDF membranes (Millipore, Watford, UK) for further detection. After blocking in 5% non-fat milk, the PVDF membrane was immunoblotted by anti-GAPDH (Santa Cruz, Dallas, TX) and anti-AKT3 (Abcam, Cambridge, MA) at 4 °C overnight. With thrice washing in 1 × TBST, the PVDF membrane was incubated with HRP-labeled secondary antibodies (Jackson ImmunoResearch, West Grove, PA) for 1 h at room temperature. Protein bands were detected by ECL Plus Western blotting detection system (Bio Rad, Hercules, CA).
Flow cytometry
All experimental cells were re-suspended and incubated in 5 ml ice-cold 75% ethanol at 4 °C. After twice washing, the cells were re-suspended in 0.3 ml PBS. RNase A was added into cells to the final concentration of 50 µg/ml, followed by digestion for 30 min at 37 °C. After incubation in 5 μl propidium iodide (PI) at 4 °C for 15 min in dark, cell cycle of SW620 and Colo205 cells were determined by flow cytometry.
Statistical analysis
Statistical data analysis was performed by GraphPad Prism 6.0 (GraphPad Software, Inc., La Jolla, CA). The quantified data were presented as mean ± standard deviation (SD). One-way analysis of variance (ANOVA) or Student’s t-test was used for statistical analysis. P value less than 0.05 was considered as statistical differences, p value less than 0.01 represented extremely significant difference, ns indicated no difference.
Results
Linc02163 is up-regulated and associated with poor prognosis in CRC patients
To understand the role of LINC02163 in colon cancer, we first analysed the expression pattern of LINC02163 in human CRC tissue (n = 456) and adjacent normal intestinal tissue (n = 41). Based on the Cancer Genome Atlas (TCGA) database, we identified the level of LINC02163 significantly increased in colon cancer samples (p < .01) (). To validate the up-regulation of LINC02163, qRT-PCR was conducted to quantify LINC02163 expression in the 15 pairs of enrolled clinical CRC samples. The quantification results showed that compared with normal control, LINC02163 expression was increased in clinical samples (). In addition, as shown in , expressional level of LINC02163 in CRC cell lines(Colo205, SW620, HCT116, HT-29, LoVo, SW480) was dramatically higher than that in normal colon epithelial NCM460 cells (p < .05). The SW620 and Colo205 cell lines were selected for further experiments because LINC02163 expression was greatly enhanced in these two cell lines.
Figure 1. LINC02163 expression was elevated in CRC tissues and cell lines. (A) LINC02163 expression in CRC samples (n = 456) and adjacent normal colon tissues (n = 41) was analysed based on TCGA database. (B) LINC02163 level was determined in 15 pairs of CRC samples and adjacent normal colon tissue by qRT-PCR. (C) LINC02163 levels in SW620, SW620, Colo205, Colo205, HT-29, SW480 and NCM460 cell lines were analysed by qRT-PCR. (D) Kaplan-Meier analyses of the correlations between expression of LINC02163 and overall survival rate of patients with CRC. The error bars represent standard deviation (SD). Data were representatives of three independent experiments. *, p <0.05, compared to NCM460 cell line; **, p < 0.01, compared to adjacent tissue group.
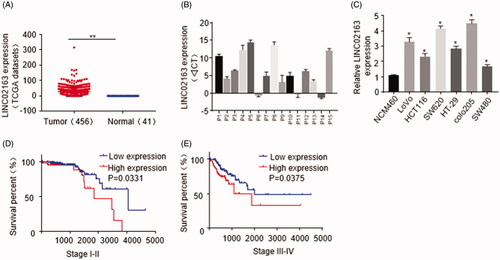
Next, with Kaplan-Meier survival analysis on 41 cases of colon cancer, we found CRC patients (Stage I-II and Stage III-IV) with higher level of LINC02163 showed poor survival, indicating LINC02613 could be used as a potential indicator for prognosis prediction of CRC ().
Knockdown of LINC02163 inhibits proliferation, migration and invasion of CRC cells
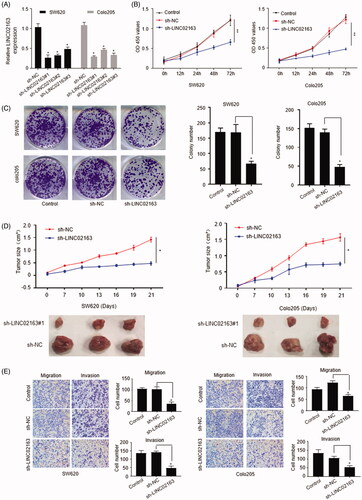
In order to explore the function of LINC02163 in colon cancer development, we generated CRC cell lines with stablely down-regulated LINC02163 by lentivirus mediated shRNA transducing. Based on the knockdown efficiency, SW620-sh-LINC02163#1 and Colo205-sh-LINC02163#1 were selected for further study. SW620 and Colo205 cells transduced with sh-NC were used as negative control (). CCK-8 assay showed compared with control group, knockdown of LINC02163 dramatically reduced the cell proliferation activity (p <0.01) (). Similarly, the colony formation assay also revealed that stable depletion of LINC02163 markedly restricted cell proliferation (). Xenograft assay were set up in nude mice to explore the role of LINC02163 in colon cancer cell growth in vivo. SW620 and Colo205 cells stably transduced with sh-NC or sh-LINC02163 were delivered into nude mice by subcutaneously injection. The tumour volume calculation results clearly revealed that inhibition of LINC02163 expression significantly reduced xenograft tumour size in vivo (). Additionally, compared with control group, knockdown of LINC02163 dramatically repressed colon cancer cells mobility and invasiveness (). Taken together, it was suggested that LINC02163 contributed to colon cancer progression and metastasis.
Figure 2. LINC02163 exerted accelerative role in tumour growth, cell mobility and cell invasion. (A) SW620 and Colo205 cells were transfected with sh-NC and shRNAs targeting LINC02163 for stable cell lines establishment. LINC02163 level was quantified by qRT-PCR assay. (B) CCK-8 assay of SW620 and Colo205 cells with stably down-regulated LINC02163. (C) Colony formation assays in SW620 and Colo205 cells transduced with sh-LINC02163 or sh-NC. (D) Tumour volume curve of nude mice subcutaneously injected with SW620 and Colo205 cells stably transduced with sh-LINC02163 or sh-NC. Representative tumours collected from experimental mice were exhibited in the lower panel. (E) Transwell assays were performed to explore the role of LINC02163 on the mobility and invasiveness of SW620 and Colo205. Data were representatives of three independent experiments. The error bars represented standard deviation (SD). *, p < 0.05, **, p < 0.01, compared to sh-NC control.
Linc02163 acts as a sponge of miR-511-3p in Colon cancer
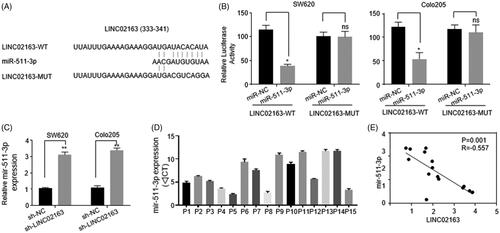
LncRNAs can modulate miRNAs and miRNA-targeted genes level through acting as ceRNA of miRNAs [Citation17]. LINC02163 exerts its impellent role in gastric cancer cells malignization via miR-593-3p/FOXK1 axis, which suggested LINC02163 may assist colon cancer development in a similar manner [Citation18]. By using online software StarBase v2.0 (http://starbase.sysu.edu.cn/), we found LINC02163 contained the potential binding sites of miR-511-3p (). Dual-luciferase assays were performed in both SW620 and Colo205 cells to verify the binding between miR-511-3p and LINC02163. Compared with groups with miR-NC transfection, transfection of miR-511-3p mimic specifically decreased luciferase activity of reporter construction carrying LINC02163-WT sequence in SW620 and Colo205 cells (). Moreover, down-regulation of LINC02163 significantly elevated expressional level of miR-511-3p (). Quantification analysis and Pearson’s correlation curve of clinical samples revealed the expression of LINC02163 negatively correlated with the abundance of miR-511-3p ().
Figure 3. LINC02163 acted as a sponge for miR-511-3p in CRC cells. (A) The predicted complementary sequences of miR-511-3p in LINC02163-WT and LINC02163-MUT. (B)Dual luciferase assays in SW620 and Colo205 cells co-transfected with luciferase reporter plasmids harbouring LINC02163-WT or LINC02163-MUT sequence and miR-511-3p mimic/miR-NC. (C) The inhibitory effect of LINC02163 on miR-511-3p expression were quantified by qRT-PCR in SW620 and Colo205 cells. (D) Expressional level of miR-511-3p in 15 pairs of CRC and normal tissues from patients was determined by qRT-PCR. (E) Pearson’s correlation curve was established to present the negative correlation between miR-511-3p and LINC02163 levels in CRC tissues. The error bars represented standard deviation (SD). Data were representatives of three independent experiments. *, p < 0.05, compared to miR-NC group; **, p < 0.01, compared to sh-NC group; ns, compared to miR-NC group.
We also initially explored the function of miR-511-3p in CRC cells. In SW620 and Colo205 cells, CCK-8 and colony formation assays showed that transfection of miR-511-3p mimic significantly repressed CRC cells proliferation (Supplementary Figure 1(A–C)). Besides, miR-511-3p mimic transfection also inhibited the mobility and invasiveness of CRC cells (Supplementary Figure 1(D,E). These experimental results revealed that miR-511-3p may function as tumour suppressor during CRC development.
Akt3 is a direct target of miR-511-3p in Colon cancer
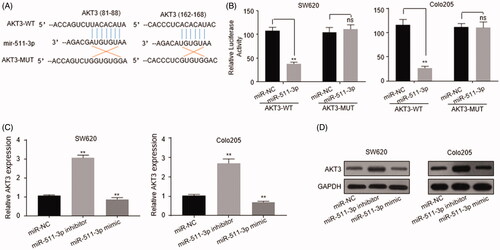
AKT3 was predicted to be one potential target genes for miR-511-3p by TargetScan (http://www.targetscan.org/) (). Full length of wild-type (AKT3-WT) and mutant (AKT3-MUT) 3’UTR of AKT3 was reconstituted into luciferase reporter plasmid, respectively. In both SW620 and Colo205 cells transfected with AKT3-WT, addition of miR-511-3p mimic obviously reduced luciferase activity compared with miR-NC group. However, miR-511-3p mimic transfection did not affect luciferase activity in cells transfected with AKT3-MUT (). Besides, in SW620 and Colo205 cells, transfection of miR-511-3p inhibitor greatly enhanced AKT3 mRNA amount while delivery of miR-511-3p mimic into CRC cells reduced the abundance of AKT3 mRNA (), which was consistent with the endogenous AKT3 protein level (). These results demonstrated that AKT3 mRNA could be targeted and inhibited by miR-511-3p in CRC cells.
Figure 4. AKT3 was the target of miR-511-3p in CRC cells. (A) The predicted complementary sequences of miR-511-3p to AKT3-WT and the AKT3-MUT. (B) Dual luciferase analysis in SW620 and Colo205 cells co-transfected with miR-511-3p mimic/miR-NC and luciferase reporter constructions expressing AKT3-WT or AKT3-MUT. (C) Endogenous mRNA level of AKT3 in SW620 and Colo205 cells transfected with miR-NC, miR-511-3p inhibitor or miR-511-3p mimic was analysed by qRT-PCR. (D) Protein level of AKT3 in SW620 and Colo205 cells transfected with miR-NC, miR-511-3p inhibitor or miR-511-3p mimic was detected by western blot assay. GAPDH was used as internal control. The error bars represented standard deviation (SD). Data were representatives of three independent experiments.**, p < 0.01; ns, no difference, compared to miR-NC group.
Linc02163 promotes CRC cells proliferation by up-regulating AKT3 via sponging miR-511-3p
Quantification of AKT3 and Pearson’s correlation curve proved AKT3 level was positively correlated with the amount of LINC02163 in CRC patients (). Furthermore, knockdown of LINC02163 abolished AKT3 expression, while exogenous addition of miR-511-3p inhibitor in sh-LINC02163 transduced cells significantly restored AKT3 level (). To determine whether LINC02163 exerted its pro-tumorigenesis function through miR-511-3p/AKT3 axis, rescue experiments were conducted in SW620 and Colo205 cells. In CCK-8 and colony formation assays, as expected, deficiency of LINC02163 expression restricted CRC cells proliferation, but transfection of miR-511-3p inhibitor or ectopic transfection of AKT3 into sh-LINC02163-transduced cells obviously accelerated CRC cells proliferation (), indicating LINC02163 promoted CRC progression by enhancing AKT3 level via sponging miR-511-3p.
Figure 5. LINC02163 indirectly regulated AKT3 expression through sponging miR-511-3p. (A) The mRNA level of AKT3 in 15 pairs of CRC and normal tissues from CRC patients was determined by qRT‐PCR. (B) Pearson’s correlation curve showed the positive relevance between AKT3 and LINC02163 abundance. (C) Endogenous mRNA level of AKT3 in SW620 and Colo205 cells was determined by qRT‐PCR. (D) Protein level of AKT3 was detected in SW620 and Colo205 cells by western blotting. GAPDH was used as internal control. (E and F) The effect of LINC02163/miR‐511‐3p/AKT3 axis on proliferation of SW620 and Colo205 cells were determined by CCK‐8 and colony formation assays. (G) The effect of LINC02163/miR‐511‐3p/AKT3 axis on cell cycle of SW620 and Colo205 cells was performed by flow cytometry experiments. The error bars represented standard deviation (SD). Data were representatives of three independent experiments. **, p <0.01, compared to sh‐NC group.
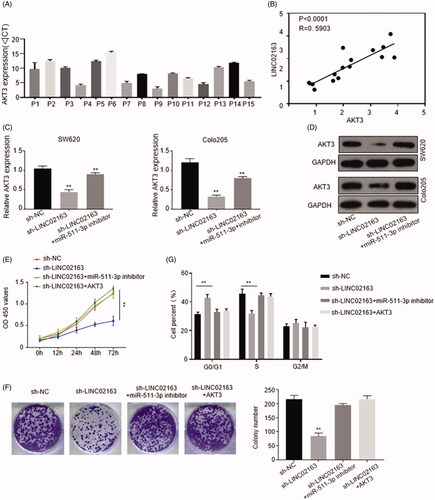
Subsequently, we investigated how LINC02163/miR-511-3p/AKT3 axis affected colon cancer cells proliferation. Flow cytometry analysis revealed that knockdown of LINC02163 resulted in cell cycle arrest in G0/G1 phase. Transfection of miR-511-3p inhibitor or AKT3 partially abolished the cycle arrest effect caused by knockdown of LINC02163 ().
Discussion
Although the incidence of CRC has declined slightly over the past decade, CRC is still one of the leading lethal cancers. Patients with CRC have high recurrence rate within 5 years and a poor prognosis. Therefore, identification of novel molecule and possible mechanism underlying CRC progression is crucial for therapeutic strategies establishment.
In the present study, we first identified that LINC02163 level was up-regulated in CRC samples and cell lines, and correlated with the poor prognosis of CRC patients (). Functional assays revealed that LINC02163 could promote CRC cells proliferation in vivo and in vitro. Besides, LINC02163 also contributed to the metastasis of CRC cells (). Mechanism study showed that LINC02163 could bind to miR-511-3p (), which further regulated AKT3 gene expression to modify the CRC cells growth and metastasis ( and ).
LncRNAs can be easily detected in plasma and serum. Although lncRNA-based tumour diagnostics has not been widely applied to clinical diagnostics, multiple lncRNAs have been identified associated with poor prognosis of CRC [Citation19,Citation20]. In our study, we found that high level of LINC02163 was negatively correlated with prognosis of CRC patients, indicating LINC02163 abundance could be considered as a candidate indicator for CRC diagnosis and prognosis ().
LncRNAs are involved in multifarious biological processes and diseases by affecting genes expression at chromatin, transcriptional and posttranscriptional levels [Citation21]. In a variety of cancers including CRC, lncRNAs act as oncogenes or tumour suppressors to regulate the escape of cell apoptosis, the metastasis and angiogenesis of tumour [Citation22,Citation23].
LINC02163 is a long non-coding RNA without protein coding ability. The specific function of LINC02163 remains unclear, but previous research reported that LINC02163 could regulate growth and epithelialto-mesenchymal transition in gastric cancer cells by interacting with miR-593-3p/FOXK1 axis. This study reminded us that LINC02163 could function as pro-tumoral factor during cancer development. In this study, with in vivo and in vitro experiments, we identified that LINC02163 contributed to CRC cells proliferation and metastasis, suggesting that LINC02163 exerted its role of oncogene in CRC development (), which was similar with the role of LINC02163 in gastric cancer [Citation18].
It is well documented that lncRNAs can regulate genes expression by sponging microRNAs to abolish the interaction between miRNAs and their targeted mRNAs. Our bio-informatics screening and dual-luciferase assay proved that miR-511-3p could bind to LINC02163 and inhibition of LINC02163 significantly enhanced miR-511-3p level (), suggesting the negative correlation between miR-511-3p and LINC02163. Previous study showed that AKT3 was the downstream target of miR-511-3p in prostate cancer cells [Citation24]. In SW620 and Colo205 cell lines, we also observed the binding and negative regulatory relationship between miR-511-3p and AKT3 (). Based on the above discovery, we speculated that LINC02163, miR-511-3p and AKT3 may form axis to modulate the development of CRC.
AKT3 is a member of the AKT family, which takes key roles in a variety of cell growth processes, such as glucose metabolism, apoptosis, cell proliferation, transcription, and cell migration [Citation25]. AKT3 has been demonstrated as oncogenes in CRC through PI3K/AKT signalling pathway [Citation26]. In our study, we found that AKT3 was upregulated in CRC patients and positively correlated with the abundance of LINC02163 in CRC tissues, indicating the pro-tumoral role of AKT3 in CRC (). Additionally, both mRNA and protein level of AKT3 in CRC cells transduced with sh-LINC02163 were greatly rescued by miR-511-3p inhibitor transfection (). Cell proliferation assays displayed CRC cells growth was elevated by inhibition of miR-511-3p or overexpression of AKT3 (). As for mechanism investigation, knockdown of LINC02163 led to cell cycle arrest in G0/G1 stage while transfection of miR-511-3p or AKT3 abolished cycle arrest in LINC02163-depletion CRC cells, indicating LINC02163 promoted cell proliferation through modifying cell cycle progress ().
Conclusion
In conclusion, our study identified LINC02163 functioned as a pro-tumour factor in CRC by promoting CRC cells proliferation and metastasis. Mechanism studies revealed that LINC02163 exerted its role by indirectly regulating AKT3 expression via sponging miR-511-3p to affect cell cycle progress.
Supplemental Material
Download MS Power Point (328.3 KB)Disclosure statement
There are no conflicts of interest.
Related Research Data
References
- Tariq K, Ghias K. Colorectal cancer carcinogenesis: a review of mechanisms. Cancer Biol Med. 2016;13(1):120–135.
- Kanth P, Grimmett J, Champine M, et al. Hereditary colorectal polyposis and cancer syndromes: a primer on diagnosis and management. Am J Gastroenterol. 2017;112(10):1509–1525.
- Ogino S, Lochhead P, Giovannucci E, et al. Discovery of colorectal cancer PIK3CA mutation as potential predictive biomarker: power and promise of molecular pathological epidemiology. Oncogene. 2014;33(23):2949–2955.
- Kordowski F, Kolarova J, Schafmayer C, et al. Aberrant DNA methylation of ADAMTS16 in colorectal and other epithelial cancers. BMC Cancer. 2018;18(1):796
- Binefa G, Rodríguez-Moranta F, Teule à, et al. Colorectal cancer: from prevention to personalized medicine. World J Gastroenterol. 2014;20(22):6786–6808.
- Cassidy S, Syed BA. Colorectal cancer drugs market. Nat Rev Drug Discov. 2017;16(8):525–526.
- Friedman RC, Farh KK-H, Burge CB, et al. Most mammalian mRNAs are conserved targets of microRNAs. Genome Res. 2009;19(1):92–105.
- Ramasamy P. MicroRNAs – a new generation molecular targets for treating cellular diseases. Theranostics. 2013;3:927–929.
- Zhang J, Zhang Y, Li X, et al. MicroRNA‑212 inhibits colorectal cancer cell viability and invasion by directly targeting PIK3R3. Mol Med Rep. 2017;16(5):7864–7872.
- Song W, Mei JZ, Zhang M. Long noncoding RNA PlncRNA-1 promotes colorectal cancer cell progression by regulating the PI3K/Akt signaling pathway. Oncol Res. 2018;26(2):261–268.
- Wang Y, Yang L, Chen T, et al. A novel lncRNA MCM3AP-AS1 promotes the growth of hepatocellular carcinoma by targeting miR-194-5p/FOXA1 axis. Mol Cancer. 2019;18(1):28.
- Shan Y, Ma J, Pan Y, et al. LncRNA SNHG7 sponges miR-216b to promote proliferation and liver metastasis of colorectal cancer through upregulating GALNT1. Cell Death Dis. 2018;9(7):722.
- Dong YZ, Meng XM, Li GS. Long non-coding RNA SNHG15 indicates poor prognosis of non-small cell lung cancer and promotes cell proliferation and invasion. Eur Rev Med Pharmacol Sci. 2018;22:2671–2679.
- Rinn JL, Kertesz M, Wang JK, et al. Functional demarcation of active and silent chromatin domains in human HOX loci by noncoding RNAs. Cell. 2007;129(7):1311–1323.
- Junxia Z, Anlin Z, Yingyi W, et al. New insights into the roles of ncRNA in the STAT3 pathway. Future Oncol. 2012;8:723–730.
- Wu Q, Meng W-Y, Jie Y, et al. LncRNA MALAT1 induces colon cancer development by regulating miR-129-5p/HMGB1 axis. J Cell Physiol. 2018;233(9):6750–6757.
- Cheng Z, Li Z, Ma K, et al. Long non-coding RNA XIST promotes glioma tumorigenicity and angiogenesis by acting as a molecular sponge of miR-429. J Cancer. 2017;8(19):4106–4116.
- Dong L, Hong H, Chen X, et al. LINC02163 regulates growth and epithelial-to-mesenchymal transition phenotype via miR-593-3p/FOXK1 axis in gastric cancer cells. Artif Cells Nanomed Biotechnol. 2018;46(sup2):607–609.
- Dong L, Lin W, Qi P, et al. Circulating long RNAs in serum extracellular vesicles: their characterization and potential application as biomarkers for diagnosis of colorectal cancer. Cancer Epidemiol Biomarkers Prev. 2016;25(7):1158–1166.
- Wang C, Yu J, Han Y, et al. Long non-coding RNAs LOC285194, RP11-462C24.1 and Nbla12061 in serum provide a new approach for distinguishing patients with colorectal cancer from healthy controls. Oncotarget. 2016;7(43):70769–70778.
- Nina H, Damjan G. Long non-coding RNA in cancer. Int J Mol Sci . 2013;14:4655–4669.
- Khorshidi A, Dhaliwal P, Yang BB. Noncoding RNAs in tumor angiogenesis. Adv Exp Med Biol. 2016;927:217–241.
- Ouyang S, Zheng X, Zhou X, et al. LncRNA BCAR4 promotes colon cancer progression via activating Wnt/β-catenin signaling. Oncotarget. 2017;8(54):92815–92826.
- Zhang F, Wu Z. Significantly altered expression of miR-511-3p and its target AKT3 has negative prognostic value in human prostate cancer. Biochimie. 2017;140:66–72.
- Nakatani K, Thompson DA, Barthel A, et al. Up-regulation of Akt3 in estrogen receptor-deficient breast cancers and androgen-independent prostate cancer lines. J Biol Chem. 1999;274(31):21528–21532.
- Agarwal E, Brattain MG, Chowdhury S. Cell survival and metastasis regulation by Akt signaling in colorectal cancer. Cell Signal. 2013;25(8):1711–1719.