
Abstract
In this study, isoliquiritigenin (ISL) incorporated nanoliposomes were prepared and their effects on colorectal cancer (CRC) cell lines were investigated. Herein, we sought to explore the anti-cancer mechanisms of ISL loaded nanoliposomes (ISL-NLs) on AMP-activated protein kinase/mammalian target of rapamycin (AMPK/mTOR) pathways mediated glycolysis. Also, the key targets such as caveolin 1 (CAV1), glucose transporters and Akt/mTOR that promote glycolysis, and are activated via the induction of α-enolase (ENO1), fructose bisphosphate aldolase A (ALDOA) and monocarboxylate transporter 4 (MCT4) expressions were also investigated. It was shown that ISL-NLs significantly suppressed the proliferation and glucose uptake of CRC cell by potentially regulating the glycolysis and lactate targets as well as pathways that formed the basis of the anti-CRC effects of ISL-NLs. The mechanism underlying this effect was further validated via the regulation of some key targets such as ENO1, ALDOA, lactate dehydrogenase A (LDHA) and MCT4 in glycolysis coupled with cellular myelocytomatosis oncogene (c-myc), hypoxia-inducible factor 1-alpha (HIF-1α) in protein kinase B/mTOR (Akt/mTOR) pathways. Moreover, the AMPK proteins were identified to be up-regulated while the lactic acid production was suppressed by ISL-NLs in the CRC cells, indicating that ISL-NLs had an inhibitory effect on AMPK mediated glycolysis and lactate production. Altogether, these results have provided insights into the mechanism underlying the key role that liposomal ISL played in the multiple inhibition of AMPK and Akt/mTOR mediated glycolysis and lactate generation, which may be regulated as the alternative metabolic pathways of CRC as well as serve as adjuvant therapy for the disease.
Introduction
Although colorectal cancer (CRC) is the third most common types of cancer, the survival rate of CRC patients of 5 years is still less than 10% [Citation1,Citation2]. Great efforts have been made to promote the efficiency of CRC metastatic treatment in patients, but the metabolic disorder of glucose and acidic metabolite of lactic acid culminate in acidic tumour microenvironment (TME) which hinders the effective therapeutic strategies of the disease [Citation3]. For instance, the CRC cells showed increased proliferation, migration and invasion in the preference of acidic TME, which further led to the chemotherapy resistance [Citation4]. It is well known that in the presence of oxygen, tumour cells accelerate the uptake of glucose and increase the production of lactic acid which is referred to aerobic glycolysis (also known as the Warburg effect) [Citation5]. Previous works have reported that glucose metabolism enzymes are involved in the progression and prognosis of a variety of cancers, such as CRC [Citation6,Citation7].
An AMP-activated protein kinase (AMPK) is the main cellular energy sensor. Actually, the energy status of the cell is sensed by monitoring the AMP/ATP ratio with the resulting activation of AMPK leading to activation of catabolic while inhibiting the anabolic pathways [Citation8]. Usually, glucose starvation is invariably followed by the activation of AMPK, which in turn initiates multiple catabolic pathways including glucose and fatty acid uptakes as well as oxidation, mitochondrial biogenesis and autophagy [Citation9]. Importantly, the inhibition of AMPK activation is culminated in the blocking of metabolic shift to oxidative phosphorylation, which indicates that AMPK is indeed the pivotal regulator capable of triggering the cellular switch [Citation10]. Notably, the AMPK proteins have been identified to suppress lactic acid production in the CRC cells [Citation11], suggesting an inhibitory effect on the aerobic glycolysis. Specifically, a key glycolytic enzyme like α-enolase (ENO1) has been shown to increase significantly in the CRC tissues, indicating that the enzyme is a potent promoter of the genesis and metastasis of CRC, at least in part, through the regulation of the AMPK/mammalian target of rapamycin (AMPK/mTOR) pathway [Citation12]. Recently, it has been shown through dynamic proteomics analysis that fructose-bisphosphate aldolase A (ALDOA) is a new biomarker for CRC prognosis [Citation13]. Noticeably, ALDOA and pyruvate kinase muscle isozyme M2 (PKM2), are also overexpressed in liver cirrhosis [Citation14]. Other studies have shown an increased expression of the ALDOA, PKM2 and LDHA in the CRC, while the lactate dehydrogenase A (LDHA) expression could induce hypoxia-inducible factor 1-alpha (HIF-1α) [Citation15,Citation16]. The secretion of lactic acid from cells is catalysed by the reversible activity of the LDH and required monocarboxylic acid transporter (MCTs) to drive the reaction forward and prevent the high acidity of intracellular environment [Citation17].
Isoliquiritigenin (ISL), one of the flavonoids of the root of Glycyrrhiza glabra L., was previously shown to exhibit antioxidant, anti-inflammatory and tumour-suppressive effects [Citation18,Citation19]. Actually, the ISL has been reported to play key role in the proliferation and apoptosis of CRC cell, while ISL as a natural antioxidant has demonstrated cardioprotective effect against ischaemic injury which may be attributed to the activation of AMPK and ERK signalling pathways as well as the balance of cellular redox status [Citation20]. Lately, we found that ISL could regulate key enzymes such as LDHA and PKM2, in the down-stream of the glycolytic pathway. Undoubtedly, ISL has been established to be poorly water-soluble, and this property hinders its potential applications as anti-cancer drugs [Citation21]. Therefore, it is imperative to improve the solubility of ISL in aqueous medium through the development of novel nanocarrier strategies in order to enhance its antitumor biological activity. Liposomes which are usually regarded as the most famous method have been used to encapsulate both hydrophilic and lipophilic drugs [Citation22]. The liposomal systems exhibit many desirable characteristics, such as a capacity for self-assembly and biocompatibility [Citation23,Citation24]. It has been reported that the enhancement of gastrointestinal absorption of ISL by nanostructured lipid carrier, and evaluation of ISL-loaded TPGS modified proliposomes in vitro and in vivo.
So far, the effects of liposomal ISL on glycolysis and lactate production in the CRC coupled with its mechanisms are still unclear. In this study, the anti-cancer mechanisms of ISL loaded nanoliposomes (ISL-NLs) on CRC cell growth and AMPK as well as the Akt/mTOR pathways that mediate glycolysis were studied. Also, we investigated key targets such as ENO1, ALDOA, LDHA and monocarboxylate transporter 4 (MCT4) that promote glycolysis, and are activated by Akt/mTOR pathways which induce cellular myelocytomatosis oncogene (c-myc) and HIF-1α expressions. Besides, the significance of ISL-NLs in the regulation of the potential targets of glycolysis and lactate production in the CRC was evaluated using in vitro cultured cells. Next, we constructed distinct energy metabolic signatures in the CRC cell lines based on the gene expression data obtained via the ISL-NLs. Moreover, we highlighted the marked modules that were dominated by lactate on the differentially expressed metabolic genes and factors in the dysregulated glucose metabolism. It was speculated that our results could present a complex multifactorial basis of the underlying strategies to target AMPK/mTOR mediated glycolysis via ISL-NLs, wherein the natural occurring molecule is applied as the anti-metabolic agents for effective treatment of CRC.
Materials and methods
Materials
The ISL (PubChem CID: 638278) was obtained from the National Institute for the Control of Pharmaceutical and Biological Products (NICPBP, Beijing, China). Cholesterol (Shanghai Aladdin Bio-Chem Technology Co., Ltd., Shanghai, China), lecithin (Shanghai Macklin Biochemical Co., Ltd, Shanghai, China), sodium cholate (Sinopharm Chemical Reagent Co., Ltd, Shanghai, China), isopropyl myristate (IPM, Shanghai Aladdin Bio-Chem Technology Co., Ltd, Shanghai, China) were bought from the various aforementioned companies. All the reference substances were of biological and chemical reagent grade, while high performance liquid chromatography (HPLC) was used to identify the purity of reagents less than 95%. Also, HPLC or AR grade organic solvents acetone, chloroform, dichloromethane, ethyl acetate, 95% ethanol, methanol petroleum ether, n-butanol and phosphoric acid were obtained from Sigma (St. Louis, MO). Foetal bovine serum (FBS), trypsin–ethylenediaminetetraacetic acid (trypsin–EDTA), Dulbecco’s modified Eagle’s medium (DMEM), penicillin-streptomycin and l-glutamine were supplied by GIBCO BRL (Invitrogen Corp., Carlsbad, CA). Antibodies such as AMPKα, p-AMPKα, ENO1, ALDOA, LDHA and MCT4, c-myc, and HIF-1α were obtained from the Cell Signaling Technology (Cell Signaling Technology, San Jose, CA). The antibodies namely anti-p-mTOR, anti-mTOR, anti-Akt, anti-Akt phospho (Ser473) and anti-Akt phospho (Thr308) were provided by the Cell Signaling Technology (Santa Cruz Biotechnology, Inc, Santa Cruz, CA). Goat anti-mouse antibodies, horseradish peroxidase-conjugated secondary goat anti-rabbit and anti-β-actin were purchased from Santa Cruz Biotechnology, Inc. (Dallas, TX). Bicinchoninic acid (BCA) protein assay kit was provided by Thermo Scientific (Rockford, IL).
Preparation of isoliquiritigenin loaded nanoliposomes
The ISL-NLs were prepared using the method outlined in our previous report [Citation23]. In brief, the composition of the oil phase included the following: sodium cholate, cholesterol and IPM were melted with a ratio of 5:1:4 (w/w/w). Subsequently, ISL and lecithin were dissolved in 5 mL of ethanol with a ratio of 1:24 (w/w). After evaporation under reduced pressure for 5 min to form thin film, the mixture of ISL and lecithin was reconstituted with 10 mL ethanol. Then, the oil phase was dissolved in the ethanol mixture prior to ultrasonication at room temperature. Next, the ethanol mixture was completely dried for 2 h through evaporation under reduced pressure. Afterwards, the aqueous phase composing of 10.0 mL PBS (pH 6.8) was added to hydrate prior to one cycle ultrasound probe (ice bath). Finally, the liposome suspension was filtered via a 0.2-μm membrane to remove the unincorporated drug to yield liposomal ISL formulation.
Characterization of ISL-NLs
The ISL-NL was dissolved in deionized water and stirred at 25 °C for 24 h. Measuring the particle size was performed through a laser scattering ζ potential measuring instrument (Malvern’s NanoSight NS300, Malvern, UK). Characterization of the particle morphology was carried out with transmission electron microscopy (JEOL, Tokyo, Japan). Next, HPLC (DIONEX Utimate-3000, Sunnyvale, CA) was applied to measure the load liposomal ISL in drug loading content (DLC) and drug loading efficiencies (DLEs) at 207 nm.
Storage stability
In order to assess the stability of ISL-NLs, particle sizes and potential charges were evaluated for 12 d wherein the liposomes were maintained at 4 °C. Briefly, the liposomes were prepared according to the method described earlier. Then, at different time intervals, 100 μL of sample was diluted to 900 μL with 5% (w/v) glucose solution for the determination of particle size, polydispersity index (PDI) and zeta potential using Zetasizer Nano-ZS (Malvern Instruments, Malvern, UK).
Cell culture
HCT116 cell lines (ATCC, Manassas, VA) were cultured in 10% FBS (Atlanta Biologicals, Oakwood, GA) alongside penicillin (100 μg/mL) and streptomycin (GIBCO, Carlsbad, CA) in DMEM (Sigma, St. Louis, MO) medium. Next, the treated cells were cultured in a medium containing ISL-NLs, and were subsequently resuspended in DMEM comprising 10% FBS in different concentrations of ISL or with DMSO (0.1%) served as controls. The HCT116 cells were cultured in a humidified incubator containing 5% CO2 at 37 °C.
Cell viability and proliferation assays
Briefly, the SW620, HCT116 and HT29 cells were cultured with ISL-NLs or ISL (12.5, 25, 50 and 100 μM) before the cells were trypsinized and counted to make suspension. Approximately, 1000 cells were seeded to each well of the 96-well plates. The cells were then treated with 30 μM ISL, while DMSO (0.1%) was used as a control. Cell vitality was detected every 24 h by adding 10 μL of CCK-8 reagent. After incubation at 37 °C for 90 min, the optical density (OD) value of excitation light was detected with enzyme standard instrument operating at 450 nm wavelength. A proliferation curve was drawn using the OD values.
Cell apoptosis analysis with flow cytometer
The HCT116 cells were treated with ISL-NLs or ISL (25, 50 and 100 μM) for 48 h while DMSO (0.1%) was used as a control. After 24 h incubation in serum-free medium for starvation, the HCT116 cells were trypsinized with EDTA-free trypsin. Next, the cells were resuspended in 1× binding buffer (10 mM HEPES/NaOH (pH 7.4), 140 mM NaCl, 2.5 mM CaCl2) after washing with PBS. The cell intensity was adjusted to 3 × 10⁵ cells/mL before 5 μL of Annexin V-FITC was added to 100 μL cell suspension and incubated at room temperature in the dark. Afterwards, 10 μL of 20 μg/mL PI was used to double stain the cells for 2 min. The results were analysed with a flow cytometer (BD FACSCanto II; BD Biosciences, San Jose, CA). It was observed that the viable cells were negative for both PI and Annexin V, while apoptotic cells were positive for Annexin V and negative for PI. Also, the late apoptotic dead cells showed both positive in Annexin V and PI. The apoptotic rate was calculated via BD FACSDiva software (Becton, Dickinson and Company, Franklin Lakes, NJ).
Glucose uptake assay
After the trypsinization, dilutions of the HCT116 cells in deionized water and treatment with ISL-NLs or ISL (25, 50 and 100 μM), or 3-BrPA (25, 50 and 100 μM) alone, the amount of glucose taken up by the cells were determined using Cayman assay kit for glucose measurement. In order to determine the glucose uptake, the amount of glucose consumed by the HCT116 cells was used for subtraction.
Lactate assay
The HCT116 cells were seeded at a density of 2.5 × 10⁵ cells/well in six-well cell culture plates after treatment with ISL-NLs or ISL (25, 50 and 100 μM), or 3-BrPA (25, 50 and 100 μM) alone for 24 h, to wash cells with PBS and incubate in phenol-free and serum-free DMEM. Next, 8 h after collection culture medium, the lactic acid concentration was determined via a detection kit (Randox Laboratories Co., Ltd., London, UK). Using spectrophotometer (Thermo, Waltham, MA) and 570 nm absorbance wavelength, the amount of lactic acid was measured.
Assessment of mitochondrial membrane potential (Δψ) and ROS levels
The Δψ was measured using 5,5′,6,6′-tetrachloro-1,1′,3,3′-tetraethylbenzimidazolo-carbocyanine iodide (JC-1, Sigma, St. Louis, MO). Then, the HCT116 cells were suspended in HEPES-saline buffer and preincubated with 10 μM JC-1 for 10 min at 37 °C. After washing the cells twice, the fluorescence of each sample was read at excitation wavelength of 490 nm and emission wavelength of 530 nm and 590 nm with a fluorescence plate reader (Microplate fluorometer, Spectra GEMINIXS, Molecular Devices, Sunnyvale, CA). The results of fluorescence intensity were expressed as 590–530 nm emission ratio. Intracellular reactive oxygen species (ROS) levels were also measured via the fluorescent probe H2DCFDA after treatment of HCT116 cell with ISL-NLs or ISL (50 μM) or DMSO (vehicle). The ROS production was expressed as fluorescence intensity relative to the untreated control cells.
Mitochondrial respiration
The HCT116 cells were seeded at a density of 2.5 × 10⁵ cells/well in six-well cell culture plates after treatment with ISL-NLs or ISL (50 μM), or glycolytic inhibitor 3-BrPA (50 μM) alone for 24 h. According to the author’s description [Citation25], the mitochondrial respiratory and some changes to HCT116 cells were measured using XF24 analyser extracellular flux (Seahorse Bioscience, Billerica, MA). The cells were then seeded into XF24 V7 cell culture microplate (3.5 × 10⁴ cells per hole density vaccination), prior to cultivation for 48 h and was repeated to five times. Next, the culture medium was changed and was cultured for 1 h with the experiment being conducted in the culture medium without serum or bicarbonate. The cells were loaded into XF24, while the experiment was divided into 3 min of mixing, 2 min of waiting and 3 min of measuring cycle. Under basic conditions, the oxygen consumption was measured in the presence of mitochondrial inhibitor, 0.5 mol/L oligocytomycin (Calbiochem, San Diego, CA) or 0.25 mol/L rotenone (Sigma, St. Louis, MO), mitochondrial decoupling agent and 0.3 mol/L carbonylcyanide-p-trifluoromethoxyphenyl-hydrazone FCCP (Sigma, St. Louis, MO) in order to assess the maximum oxidation capacity. All the experiments were performed at 37 °C. The oxygen consumption rate (OCR), ATP synthesis rate and extracellular acidification rate (ECAR) were calculated by comparing the oligomycin or FCCP-induced ECAR with the basal rate.
Quantitative polymerase chain reaction (qPCR) analysis
The extraction and purification of total RNA from CRC cells were performed with the RNeasy Mini kit in accordance with the manufacturer's instructions (Qiagen, Germantown, MD). From the template of the RNA retrovirus complementary DNA (cDNA), the primer to qPCR (Supplementary Table S1) was used. The PCR reaction was performed in triplicate with the standardization of GADPH RNA, and the comparison with the levels of control. The specific amplification of target genes was verified by using the dissociation from high resolution melting analysis.
Western blotting
The HCT116 cells were lysed with RIPA buffer. Afterwards, 100 µg total protein from each lysate was centrifugated at a rate of 12,000×g for 15 min at 4 °C. Protein concentration was determined using a BCA protein assay kit and subsequently separated with SDS-PAGE prior to being transferred to nitrocellulose membrane via semi-dry blotting (Bio-Rad Laboratories, Shanghai, China) metastatic cells. Western blotting antibodies, viz., AMPKα, p-AMPKα, ENO1, ALDOA, LDHA and MCT4, c-myc, and HIF-1a; anti-Raptor, anti-Rictor, anti-Akt, anti-Akt phospho (Ser473) and anti-Akt phospho (Thr308) were added in 4 °C before incubation overnight. In view of thrice washing with the TBST buffer, the film and the second goat rabbit as well as goat anti mouse antibody incubation for 30 min at room temperature was performed, while the cells were washed thrice washing with TBST buffer. Finally, the enhanced chemiluminescence reagent was used to detect protein bands with ECL Western Blotting Substrate (SuperSignal TM Western Pico Chemiluminescent Substrate; Pierce; Thermo Fisher Scientific, Inc., Waltham, MA), and was scanned using electrophoresis gel image analysis system (DNR) (Bioimaging System, Neve Yamin, Israel).
Statistical analyses
Data are presented as means ± SEM. One-way ANOVA was used to analyse the results when more than one cell type was compared, and then Tukey's post ad hoc test was performed. The data were analysed using Student's two-tailed t-test comparable to the treated cells with untreated cells at the same stage of cancer. The SPSS 13.0 software package (SPSS Inc., Chicago, IL) was used for statistical analysis, and p < .05 was considered statistically significant. For Western imprinting in Bio-Rad on Image analysis system (Hercules, CA) to capture images of the corresponding proteins, and use the Image-Pro software analysis relative to the grey value.
Results
Characterizations of the ISL-NLs
The size distribution of ISL-NL ranged from 12.5 to 99.3 nm with the average diameter of the nanoliposomes being 48.9 ± 36.2 nm (). Morphologically, the particles of ISL-NLs were spherical with narrow size and small diameter (). The average particle diameter and zeta potential of ISL-NLs shown in indicated the potential stability of the formulation, while the DLC and DLE were 18.59 ± 3.28% and 91.38 ± 5.76%, respectively. Possibly, the incorporation of ISL into liposomes was highly efficient, resulting in high drug loading of the drug. The physicochemical properties of ISL-NLs were assessed over 12 days storage to establish their accelerated stability. The particle size, PDI and zeta potential of the ISL-NLs before and after storage were compared (). The result of zeta potential showed that the ISL-NLs had good stability, while the particle size and PDI of ISL-NLs minimally altered after storage for 12 days at 37 °C. These findings indicate that the liposomes were maintained in a suitable form with no obvious aggregation. This phenomenon could likely be due to the PEGylation process which resulted in the stabilization of the liposomes. Overall, these results suggested that the ISL-NLs had relatively good physical stability under the accelerated conditions.
Figure 1. Characterization of ISL-NLs. (A) The size distribution of the isoliquiritigenin (ISL) loaded nanoliposomes (ISL-NLs) is shown, and the average diameter of the nanoliposomes was 82.3 ± 35.6 nm. (B) Transmission electron micrograph of the ISL-NLs.
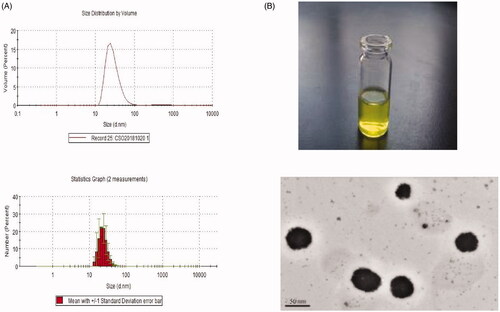
Table 1. The particle size, zeta potential, drug loading and entrapment efficiency of ISL-NLs.
Table 2. Characterization of BA-NLs after 12 days of storage.
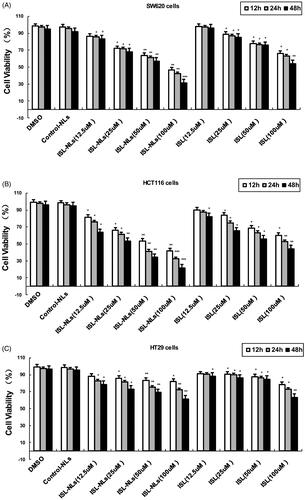
ISL-NLs inhibited the viability and proliferation of CRC cells
We first detected the dose-dependent effects of ISL-NLs or ISL on CRC cell lines. Our results showed that ISL had no significant effect on the survival of SW620, HCT116 and HT29 cells at a concentration lower than 25 μM. At a concentration of 50 μM or higher, ISL had a significant inhibitory effect on the viability of SW620, HCT116 and HT29 cells compared with the control cells (). In contrast, ISL-NLs decreased the survival of HCT116 cells at a concentration lower than 12.5 μM, but significantly inhibited the viability of SW620 and HCT116 cells at concentration of 25 μM (). The viability assay (means ± SEM) showed that the significant decrease of the OD value of excitation light was found in HCT116 cells that were treated with 12.5 μM of ISL-NLs for 12 h, compared with the control cells (). The inhibitory effect of ISL-NLs (at concentration of 25–100 μM) on the proliferation of SW620 and HCT116 cells was most significant during 24 or 48 h treatments, in comparison with the ISL ().
Figure 2. Effects of ISL-NLs on cell viabilities in colorectal cancer cell lines. (A) Viability of SW620 cells, (B) HCT116 cells and (C) HT29 cells. The cells were treated with different concentrations of ISL-NLs for 12, 24 and 48 h and cell viability was measured via the MTT assay. Data are presented as means ± SEM (n = 3). *p < .05, **p < .01, ***p < .001 versus control.
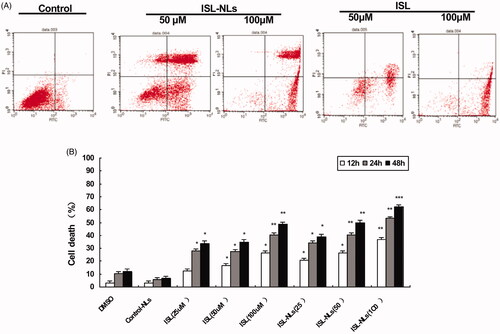
ISL-NLs induced apoptosis in CRC cells
Since 25 μM of ISL or ISL-NLs had a clear effect, and higher concentrations of the dosage forms of the drug may cause toxic effects to the HCT116 cells, we used ISL or ISL-NLs at 25–100 μM concentrations in the rest of the experiments. Next, we investigated whether ISL or ISL-NLs could impair apoptosis in the HCT116 cells. The apoptotic rate of ISL-NLs or ISL treated cells was analysed with flow cytometry. The cells were treated with ISL-NLs or ISL for 48 h and then double stained using Annexin V and PI. Early and late apoptotic cells were identified by Annexin V-positive and PI-negative staining (left upper and left lower). The ISL-NLs treatment significantly increased the apoptotic rate of HCT116 (79.69%) and that of HCT116 cells by ISL (59.20%) compared with the control cells (35.90%, respectively) (p < .05, ). The increased apoptotic rate of ISL-NLs (at concentration of 50–100 μM) on the HCT116 cells was most significant during treatment at 12, 24 and 48 h, compared with the ISL.
Figure 3. The influence of ISL-NLs on g apoptosis in CRC cells. (A) The apoptosis was affected by ISL-NLs and ISL in the CRC cells. The cells were treated for 48 h and were stained for flow cytometric analysis. (B) The rate of apoptosis was influenced by ISL-NLs and ISL in the CRC cells that were treated for 12, 24 and 48 h. The cells were treated for 12, 24 and 48 h and stained for flow cytometric analysis. Data are presented as means ± SEM (n = 3). *p < .05, **p < .01, ***p < .001 versus control.
Lactate secretion and glucose uptake
In previous work, the CRC cells have been observed even under normoxic conditions preferably the conversion of glucose into lactic acid [Citation26]. To further investigate this change in glycolytic progression in the HCT116 cells, the cellular uptake of glucose and lactic acid secretion were measured. As expected, comparable to the HCT116 cells treated with ISL-NLs (p < .01) or ISL (p < .05), glucose uptake by HCT116 cells was modest but significantly increased (). Likewise, lactic acid secretion also increased substantially in the HCT116 cells (p < .001). The cellular uptake of glucose and lactic acid secretion of ISL-NLs (at concentration of 50–100 μM) in the HCT116 cells significantly decreased compared with the ISL. Interestingly, compared with the HCT116 cells, lactic acid secretion in the ISL-NLs treated intermediate phenotype and genotype of HCT116 cells (p < .001), and glucose uptake significantly decreased (p < .05), suggesting that ISL-NLs play key role in the transitional stages of CRC progression (), which may have different substrate utilization and energy requirements in CRC cells.
Figure 4. The influence of ISL-NLs on glycolysis and mitochondrial membrane potential in CRC cells. (A) The glucose uptake, (B) lactic acid production and (C) glucose levels were affected by ISL-NLs and ISL in the CRC cells. The cells were treated for 12, 24 and 48 h to determine the glucose uptake and stained for flow cytometric analysis. (D) ISL-NLs or ISL reduced mitochondrial membrane potential (Δψ) in the HCT116 cell. Mitochondrial membrane potential (Δψ) was measured by JC-1 fluorescence assay. The result was presented as the ratio of red/green fluorescence measured at 590 nm and 530 nm, respectively. Data are presented as means ± SEM (n = 6). *p < .05, **p < .01 versus control. (E) ISL-NLs or ISL reduced the intracellular ROS levels in the isolated HCT116 cell mitochondria. Data are expressed as means ± SEM (n = 6). *p < .05, **p < .01 versus control.
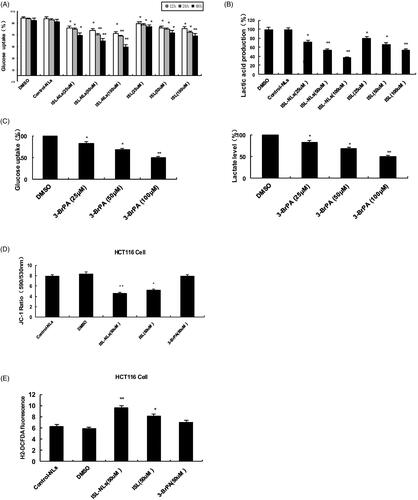
ISL-NLs reduced the mitochondrial membrane potential and ROS levels
There is evidence that AMPK signalling pathway is involved in the regulation of mitochondrial membrane potential (Δψ) in CRC [Citation27]. To understand the mechanisms through which ISL-NLs or ISL activates cardiac AMPK signalling pathway, the mitochondrial membrane potential (Δψ) of HCT116 cells was assessed using JC-1, a lipophilic fluorophore that forms J-aggregates in proportion to its intramitochondrial concentration. The HCT116 cells were preincubated for 20 min with 10 μM JC-1, and treated with ISL accordingly to represent the ratio of red/green fluorescence, and correspond to JC-1 in J-aggregate versus monomeric form. The results demonstrated that ISL-NLs treatment significantly reduced JC-1 dye accumulation and decreased J-aggregate formation in the mitochondria of the HCT116 cells in an independent manner (), which indicated that ISL-NLs caused mitochondrial membrane depolarization. The Δψ reduction may contribute to the activation of AMPK stimulated by ISL-NLs or ISL. The fluorescent probe H2DCFDA was used to measure the effect of ISL-NLs or ISL on the level of intracellular ROS in the HCT116 cells. As shown in , ROS level of HCT116 cells was much lower than that of the treatment group (p < .01 versus vehicle). ISL-NLs or ISL treatment significantly increased the intracellular ROS levels of HCT116 cells (p < .05 versus vehicle). Through treatment of HCT116 cells with ISL-NLs, it has been demonstrated that increase in ROS is a significant contributor to the cell death through uncoupling of the electron transport chain within the mitochondria which culminates in the release of destructive ROS.
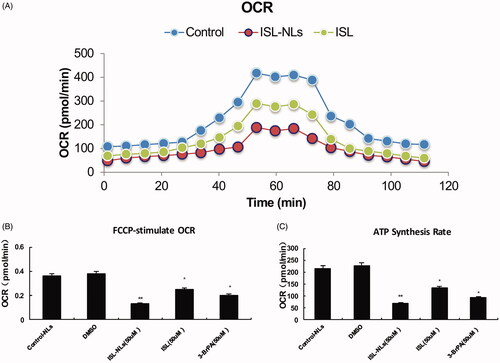
Mitochondrial oxygen consumption rate
In order to further explore whether the presence of sufficient oxygen drives the glycolysis transformation mechanisms, we evaluated the progress of mitochondrial capacity of HCT116 cells during the period of change. Mitochondrial capacity that can be reduced by citrate located in the mitochondria was observed, and this usually corresponds to the TCA cycle flux. With the development of cancer to a more aggressive phenotype, we observed significant decline in respiration from the basal OCR of HCT116 cells (235.22 ± 113.67 pmol/min) to ISL treated HCT116 (134.41 ± 86.32 pmol/min; p < .05) or to ISL-NLs treated HCT116 cells (64.51 ± 49.16 pmol/min; p < .01), indicating a reduction in oxidative metabolism. As cancer progresses, the maximum oxygen consumption of the basic OCR of FCCP stimulation will also decrease (). Importantly, the HCT116 cells strongly responded to FCCP stimulation with an increased OCR. However, this response significantly declined from ISL treated HCT116 (p < .05) to ISL-NLs treated HCT116 cells (p < .01) (). Compared with the control cells, the HCT116 cells treated with ISL-NLs showed significant decrease in the ATP synthesis rate (p < .05) (), suggesting that the ATP synthase was inhibited via the reduction of the OCR indirect measurement that depend on oxidative metabolism produced by ATP.
Figure 5. Oxidative capacity rate is regulated by ISL-NLs during HCT116 cell progression. (A) Oxidative capacity rate (OCR) was measured during an uncoupling challenge. Cellular respiration was treated for 24 h through ISL-NLs or ISL. (B) Change over base-line in OCR after ISL-NLs or ISL treatment for 24 h with carbonylcyanide-p-trifluoromethoxyphenyl hydrazone (FCCP), an electron transport chain uncoupler followed by rotenone, a complex one inhibitor of the electron transport chain. (C) ATP synthesis rate was calculated via the difference between basal OCR and ISL-NLs or ISL treated OCR for 24 h. Data are presented as means ± SEM (n = 6). *p < .05, **p < .01 versus control.
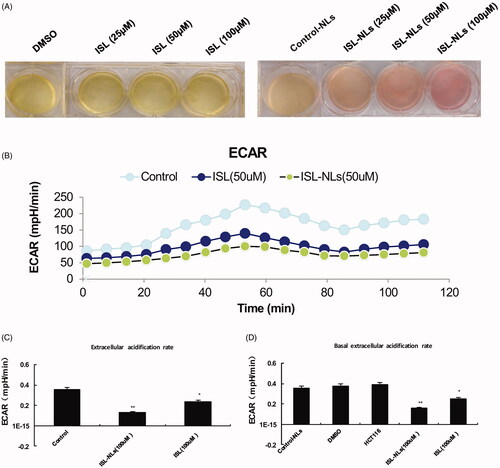
Glycolysis rate
In order to confirm whether an increase in glucose uptake and glycolysis in HCT116 cells correspond to the glycolysis rate, we measured the ECAR, which is a glycolytic surrogate. Increased cellular proton production by anaerobic glycolysis results in increased acidification of the medium or ECAR. As depicted in , compared with the ISL-NLs treated HCT116 cells, the ECAR of HCT116 cells significantly increased (p < .05), suggesting that more aggressive cells are highly glycolytic. It seems to be close to the maximum rate of the cells, because ECAR change of ISL-NLs treated cells was significantly lower than that of the HCT116 cells (p < .01) (). This result indicates that glycolysis in HCT116 cells was activated to the maximum rate which does not usually increase when ATP synthesis inhibits oxidative metabolism. Actually, ISL-NLs reduced the acidification of the culture medium, which could be observed visually by the colour of the medium. This was confirmed by the glycolysis stress test, wherein ECAR values showed that both the basal glycolysis and the maximum glycolytic capacity were significantly reduced by ISL-NLs in comparison with ISL (p < .05) ().
Figure 6. The change of ECAR in glycolysis during HCT116 cell progression by ISL-NLs. Extracellular acidification rate (ECAR), an indication of the rate of glycolysis was modified by ISL-NLs or ISL. (A) HCT116 cells were treated with ISL-NLs or ISL and cultured for 48 h, acidification of the culture medium was evaluated by visually inspecting the colour of the medium. Yellow medium indicates the presence of more lactate. (B) ECAR was measured via the glycolysis stress test in the HCT116 cell lines after the cells were treated with ISL-NLs or ISL for 48 h. *p < .05; **p < .01 compared with the DMSO or control nanoliposome (control-NLs). (C,D) ECAR or basal ECAR levels in the HCT116 cells, where ISL-NLs or ISL treatment showed an increased rate of glycolysis at basal conditions. Data are presented as means ± SEM (n = 6). *p < .05, **p < .01 compared with the DMSO or control nanoliposome (control-NLs).
Effect of ISL-NLs on genes and enzymes in glucose metabolism
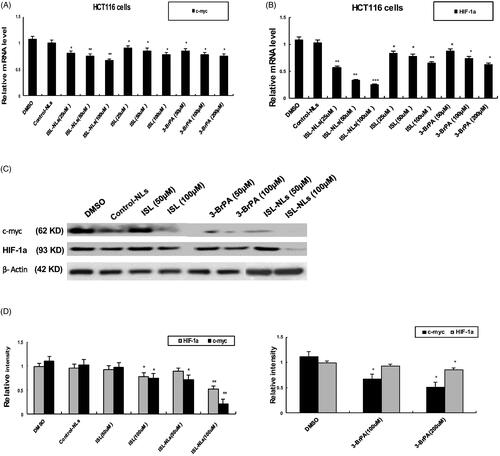
The genes and enzymes involved in glucose metabolism, such as ENO1, ALDOA, LDHA and MCT4, c-myc, and HIF-1α were investigated in this study. The results indicated that the mRNA levels of ENO1, ALDOA, LDHA and MCT4, c-myc, and HIF-1a were reduced in the ISL-NLs-treated CRC cells (), compared with that in the control. At equimolar concentrations, their mRNA levels were also down-regulated by ISL, but ISL-NLs down-regulated the mRNA levels to a greater extent. In contrast, 3-BrPA caused the down-regulation of ENO1, ALDOA, LDHA and MCT4, while after treatment with ISL-NLs, their protein levels were examined. It was found that the protein levels of ENO1, ALDOA, LDHA and MCT4 were significantly down-regulated by ISL or ISL-NLs (). These results suggest that ISL-NLs-induced the inhibition of glycolysis in the CRC cells mediated these key lactate metabolic and glycolytic enzymes. We also examined the mRNA and protein levels of c-myc and HIF-1α after treatment with ISL-NLs, and found that the changes were consistent with the mRNA levels (). Collectively, these results suggest that ISL-NLs-induced inhibition of glycolysis in CRC cells mediated these key glycolytic genes of c-myc and HIF-1α.
Figure 7. The effect of ISL-NLs on glycolytic genes and enzymes in HCT116 cells. (A–D) The mRNA levels of glycolytic genes (ENO1, ALDOA, LDHA and MCT4) were investigated by qPCR analysis, after treatment of HCT116 cells with ISL-NLs or ISL for 48 h. (E–H) The protein levels of glycolytic genes and enzymes (ENO1, ALDOA, LDHA and MCT4) were determined with Western blotting, after treatment of HCT116 cells with ISL-NLs or ISL for 48 h. The data are presented as the means ± SEM from at least three independent experiments performed in triplicate. *p < .05, **p < .01 and ***p < .001 contrasted with the DMSO or control nanoliposome (control-NLs).
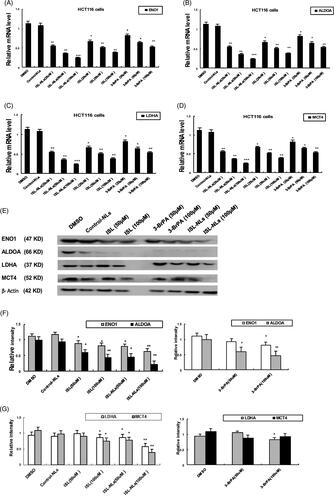
Figure 8. The effect of ISL-NLs on c-myc and HIF-1a in glucose metabolism in HCT116 cells. (A, B) The mRNA levels of c-myc and HIF-1α were investigated by qPCR analysis after treatment of HCT116 cells with ISL-NLs or ISL for 48 h. (C, D) The protein levels of c-myc and HIF-1a were determined by Western blotting after treatment of HCT116 cells with ISL-NLs or ISL for 48 h. The data are presented as the means ± SEM from at least three independent experiments performed in triplicate. *p < .05, **p < .01 and ***p < .001 contrasted with the DMSO or control nanoliposome (control-NLs).
Effect of ISL-NLs on AMPK pathway mediated aerobic glycolysis in CRC cells
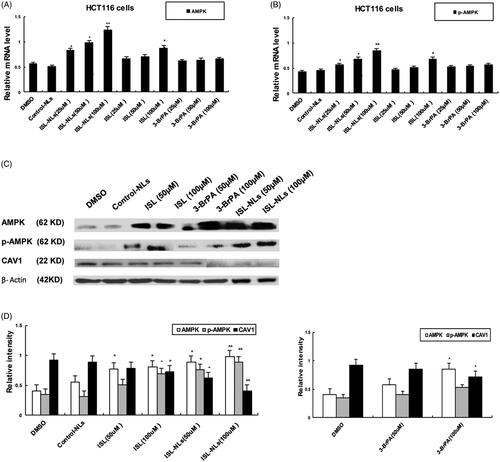
Notably, AMPK in the HCT116 CRC cells was lowly expressed, while RT-PCR analysis demonstrated that ISL-NLs was associated with increased AMPK and p-AMPK(Thr172) mRNA levels, when compared with the control group (). Through western blotting, the HCT116 cells treated with ISL alone were observed to increase in protein levels of p-AMPK(Thr172) expression when compared with the control (). Besides, 3-BrPA caused slight upregulation of AMPK and p-AMPK(Thr172) in comparison with the controls. Treatment of HCT116 cells with 3-BrPA alone resulted in a slight increase in p-AMPK(Thr172) expression (p < .05) compared with the control. The cells treated with ISL-NLs demonstrated a significant increase in the p-AMPK(Thr172)/AMPK ratio. Mechanistically, caveolin 1 (CAV1) is a direct downstream target of AMPK; therefore, the level of CAV1 phosphorylation is usually used to evaluate AMPK function. Our results demonstrated that the overexpression of AMPK activity by ISL-NLs resulted in a significant decrease in the protein expression level of CAV1 compared with the controls (p < .05). Conversely, ISL-NLs exhibited an enhanced effect on AMPK activity and a significant increase in CAV1 levels (). Lactic acid is produced as a by product of aerobic glycolysis [Citation28]. Based on this, the results of the present study demonstrated that lactic acid secretion and glucose uptake of ISL-NLs treated intermediate was significantly decreased, suggesting that treatment with ISL-NLs could activate AMPK or inhibited lactic acid production in the HCT116 cells in comparison with the controls (p < .05; ). The suppression of AMPK activity by ISL-NLs culminated in a significant increase in the production of lactic acid in the cells (all p < .05; ). Likewise, treatment with 3-BrPA did not abrogate the effect of AMPK on lactic acid production, as the lactate levels remained significantly higher compared with the controls (p < .05; ).
Figure 9. The effect of ISL-NLs on AMPK and CAV1 expression in HCT116 cells. (A,B) The mRNA levels of AMPK and CAV1 were measured by qPCR analysis after treatment of HCT116 cells with ISL-NLs or ISL for 48 h. (C,D) The protein levels of AMPK and CAV1 were measured by Western blotting after treatment of HCT116 cells with ISL-NLs or ISL for 48 h. The data are presented as the means ± SEM from at least three independent experiments performed in triplicate. *p < .05 and **p < .01 contrasted with the DMSO or control nanoliposome (control-NLs).
ISL-NLs regulated the Akt/mTOR pathway
We detected the effect of ISL-NLs on the Akt/mTOR pathway, which has been implicated in numerous cellular processes, ranging from cell growth and survival to the promotion of angiogenesis. Biochemically, Akt is phosphorylated by PDK1.22, while phosphorylated Akt regulates cellular processes by phosphorylation of a number of substrates, including Akt substrate and mTOR, which plays the most significant role in tumourigenesis [Citation24]. In this regard, we intended to investigate whether ISL-NLs could change the expression of some key proteins of the Akt/mTOR pathway.
We observed that the expression of Akt and phosphorylated Akt was decreased in the ISL-NLs treated HCT116 group (). In terms of mTOR, the same expression pattern with Akt was observed in the ISL-NLs treated HCT116 group (). In HCT116 cells, ISL (100 μM) suppressed the expression of Akt, p-Akt, mTOR and p-mTOR ().
Figure 10. The effect of ISL-NLs on Akt/mTOR-mediated signalling pathway in HCT116 cells. (A, B) The protein levels of total Akt and p-Akt and p-mTOR regulated by ISL-NLs were determined by Western blotting after treatment of HCT116 cells with ISL-NLs or ISL for 48 h. (C, D) The protein levels of total mTOR and p-mTOR regulated by ISL-NLs were determined by Western blotting after treatment of HCT116 cells with ISL-NLs or ISL for 48 h. The data are presented as the means ± SEM from at least three independent experiments performed in triplicate. *p < .05 and **p < .01 contrasted with the DMSO or control nanoliposome (control-NLs).
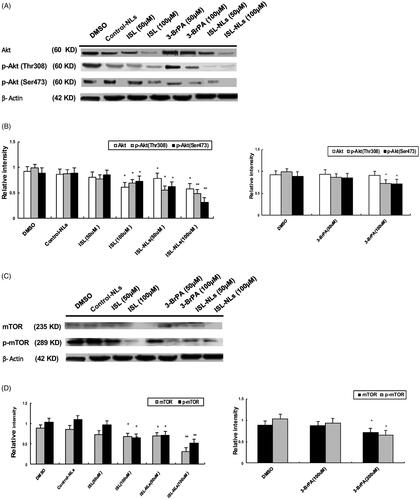
Next, the calculation of the ratio of p-Akt/Akt (p-mTOR/mTOR) is important for evaluating whether the Akt and mTOR pathway is affected by ISL-NLs. These results showed that the respective ratios of p-Akt(Thr308)/Akt by ISL (50 and 100 μM) were 0.962 and 1.13, p-Akt(Ser473)/Akt by ISL (50 and 100 μM) were 1.049 and 1.196, and p-Akt(Thr308)/Akt by ISL-NLs (50 and 100 μM) were 0.708 and 0.844, p-Akt(Ser473)/Akt by ISL-NLs (50 and 100 μM) were 0.784 and 0.534. Moreover, the ratio of p-mTOR/mTOR by ISL (50 and 100 μM) is 1.315 and 0.941, and p-mTOR/mTOR by ISL-NLs (50 and 100 μM) were 1.028 and 1.645.
Overall, these data suggested that the ISL-NLs treatment inhibited Akt and caused a decrease in the phosphorylated form of Akt and mTOR.
Discussion
It is well known that the relation between metabolic alterations fuels different malignant aspects of colorectal tumour cells, such as the pro-proliferative and Warburg effect [Citation29]. For this reason, we sought to investigate the glycolytic potential of CRC cells, as the aerobic glycolysis is one of the most remarkable features of proliferative cancer cells. Numerous proto-oncogenes (e.g. Ras and c-Myc) and tumour suppressors (e.g. p53) are reported to influence energy metabolism, and mutations in the aforementioned genes in CRC cells as well as promote a metabolic phenotype [Citation30], which supports tumour cell growth and proliferation. This process is often mediated by oncogenic signalling pathways such as phosphoinositide 3-kinase (PI3K), hypoxia inducible factors (HIFs), p53 and c-myc, an avian myelocytomatosis viral oncogene homolog, which integrate nutrient and energy state signals to control the expression of genes important for concomitant cancer cell proliferation and energy metabolism [Citation31,Citation32]. AMPK has been well-established to act as sensor of energetic changes and regulate glucose metabolism by promoting ATP conservation and production via the upregulation of glycolysis, fatty acid oxidation and the inhibition of ATP-consuming pathways such as synthesis of protein, fatty acid and glycogen as well as gluconeogenesis [Citation33]. Given its role as metabolic sensor and modulator, AMPK has been implicated as the initiator of cell-cycle arrest under low-glucose conditions coupled with a link to cell-cycle regulators. In CRC, AMPK serves as a crucial sensor of energy status and plays an important role in cellular responses to metabolic stress [Citation34]. Mechanistically, AMPK was shown to promote metabolic adaptation in the murine model of CRC and liver metastasis through AMPK α2 deficiency culminating in elevated ROS, reduced mitophagy and increased cell death in response to tumours or glucose deprivation in vitro [Citation35]. Therefore, AMPK may represent an important therapeutic target for CRC metastasis-induced liver injury.
Chemically, ISL belongs to the family of hydroxy chalcone compounds and has a flavonoid composition extracted from liquorice roots [Citation36]. Results from several studies indicated that ISL has antitumor, anti-virus and anti-inflammatory activities with its treatment resulting in increased vascular elasticity, inhibition of lipid peroxidation and numerous biological effects such as proliferation, apoptosis and autophagy [Citation37–39], while its antitumor effects have attracted much attention in recent years. Although anti-tumorigenic effect of ISL has been associated with the interference of various signalling pathways including JNK/AP1, PI3K/Akt and VEGF/VEGF2 [Citation40,Citation41], direct targets of ISL remain to be characterized. Furthermore, it is unclear whether the potential targets of ISL involved in the glucose metabolism of CRC, which has not been systematically investigated is responsible for anti-cancer effect of ISL. Therefore, the effect of ISL on glycolysis and lactate of CRC was investigated further in the present study.
There is no doubt that ISL is poorly water-soluble compound, which has hindered its potential applications as anti-cancer drugs. Therefore, it is imperative to improve the solubility of ISL in aqueous medium through the development of novel nanocarrier strategies in order to enhance its antitumor biological activity. Liposomes which are usually regarded as the most famous method have been used to encapsulate both hydrophilic and lipophilic drugs. The liposomal systems exhibit many desirable characteristics, such as a capacity for self-assembly and biocompatibility [Citation23,Citation24]. So far, the effect of ISL-NLs and its anti-cancer mechanisms on CRC cell growth and glycolytic potential have not been studied. In this study, the significance of ISL-NLs on regulating the glycolytic potential and lactate targets in CRC using in vitro cultured cells was investigated. Herein, we demonstrated that liposomal ISL significantly suppressed the glucose oxidation of HCT116 cells through the TCA cycle. Furthermore, we have confirmed that there was higher than the average level of glucose oxidation in the HCT116 cells, which utilized glucose as energy source. These results collectively suggested that the enhanced inhibitory effect of ISL was due to the incorporation of the drug into nanoliposomes (liposomal ISL).
It has been observed that in the CRC cells, glucose is preferably converted into lactic acid even under normal oxygen content conditions [Citation42]. We have previously described an energy metabolism network link between KRAS-mutant CRC and multiple metabolism, including glycolysis associated with KRAS status alongside factors and metabolic genes. These metabolic genes and factors induce metabolic changes and regulate energy metabolic pathways together with major energy sources associated with mutant KRAS, often overexpressing in patients with poor prognosis of CRC [Citation43]. It has shown that there is high level of glycolysis in the CRC cell line (HCT116). High expression of factors and metabolic genes is closely related to HCT116 cell line, which is associated with the mutant KRAS of CRC [Citation44,Citation45]. In this study, ISL-NLs were also found to inhibit the levels of glucose uptake and lactate secretion in CRC cells and may regulate glycolysis. Herein, we demonstrated the increasingly glycolytic nature of HCT116 cells as an early event during progression, glucose uptake and lactate production that occur only in the late stages. Furthermore, our results showed an aberrant TCA cycle flux that resulted in the substrates leaving the TCA cycle with concomitant elevation of fatty acid synthesis in the more aggressive HCT116 cells. Importantly, treatment with ISL-NLs in concentration-dependent manner altered glucose uptake and lactate secretion in the HCT116 cells. As expected, compared with HCT116, acid secretion of ISL-NLs treated intermediate phenotype and genotype of HCT116 cells, and glucose uptake significantly decreased, suggesting that ISL-NLs play the key role in the transitional stages during CRC progression.
Extracellular acidification rate was measured to assay glycolytic function of the ECAR, which has been reported by this method reflected key parameters of glycolysis [Citation46]. However, the rate of glycolysis, citrate synthase activity and the carbon flux through the TCA cycle was shifted towards the levels seen in the ISL-NLs-treated CRC cells, which were confirmed by the glycolysis stress test, wherein ECAR values showed that both the basal glycolysis and the maximum glycolytic capacity were reduced by ISL-NLs. The changes in the increasingly glycolytic potential were accompanied by a reduction in the oxidative capacity of the mitochondria. Biochemically, FCCP uncouples mitochondrial respiration from ATP synthesis thus requiring the mitochondria to drastically increase oxygen consumption to keep up with the flow of protons back into the matrix [Citation46]. Our data indicated that ISL-NLs-treated HCT116 cells exhibited a significantly reduced ATP synthesis rate comparable to the HCT116 cells. The ATP synthesis was indirectly measured via reduced OCR when the ATP synthase was inhibited, indicating a reliance on oxidative metabolism for ATP production. The energy stored in ATP is then used directly or indirectly to drive all other cellular processes that require energy. It is then converted ADP back to ATP by the metabolic processes oxidative phosphorylation, glycolysis and the tricarboxylic acid cycle. The reduced FCCP-stimulated respiration could result either to dysfunction in the electron transport chain, decreased number of mitochondria or mitochondria that are already uncoupled and therefore cannot respond to further uncoupling [Citation47].
Recently, a study found that the activated AMPK could stimulate CAV1 to inhibit its activity in glycolysis [Citation48]. Other downstream effects of the AMPK pathways include glucose uptake [Citation49,Citation50], glycolysis [Citation51] and fatty acid oxidation [Citation48, Citation52] that favour the ATP production which supplies enough energy for cell living under the stress conditions. Our results showed that ISL stimulated AMPK Thr172 phosphorylation and its activation in the HCT116 cells. Also, ISL-NLs significantly stimulated the AMPK downstream effector of glucose uptake in the HCT116 cells. These data strongly suggest that ISL-NLs may directly trigger AMPK signalling pathway which in turn modulates glucose homeostasis to inhibit the growth of HCT116 CRC cells. In the current work, the overexpression of AMPK activity resulted in a significant decrease in CAV1 protein expression levels. Conversely, an enhanced AMPK activity demonstrated a substantial increase in CAV1 levels, while ISL-NLs was associated with increased AMPK and p-AMPK(Thr172) protein levels. Likewise, the HCT116 cells treated with ISL alone exhibited an increase in p-AMPK(Thr172) expression in comparison with the control group.
AMPK is shown to promote glucose transport, maintain ATP stores and prevent injury and apoptosis during the stress conditions [Citation53]. Importantly, AMPK can be activated by an increase in the AMP:ATP ratio followed by phosphorylation through liver kinase B1 (LKB1), a serine/threonine kinase [Citation33]. In order to confirm an increase in glucose uptake in accordance with the glycolysis rate, the OCR and ATP synthesis as well as ECAR were calculated by comparing the ECAR induced by oligomycin or FCCP with the basal rate. In this study, our results showed that the ECAR of HCT116 cells significantly increased, suggesting that more aggressive cells are highly glycolytic. These results indicated that glycolysis in HCT116 cells was activated to the maximum rate which does not usually increase when ATP synthesis inhibits oxidative metabolism. Actually, ISL-NLs reduced the acidification of the culture medium, which could be observed visually by the colour of the medium. This was confirmed by the glycolysis stress test, wherein ECAR values showed that both the basal glycolysis and the maximum glycolytic capacity were significantly reduced by ISL-NLs in comparison with ISL. Importantly, HCT116 cells strongly responded to FCCP stimulation with an increased OCR. However, the response significantly declined in ISL-NLs treated HCT116 cells. Compared with the control cells, the HCT116 cells treated with ISL-NLs showed significant decrease in the ATP synthesis rate, suggesting that the ATP synthase was inhibited via the reduction of the OCR indirect measurement that depends on oxidative metabolism produced by ATP.
The Akt/mTOR pathway has been implicated in numerous cellular processes, ranging from cell growth and survival to the promotion of angiogenesis [Citation54,Citation55]. The serine/threonine kinase Akt inhibits apoptosis and mediates cell survival by activating phosphatidylinositol 3-kinase [Citation56]. Another kinase, mTOR is expressed in most mammalian cells [Citation57], and is responsible for inhibiting autophagy and acting as a cellular sensor to nutrients and growth factors, as well as being an important effector in the pathway of PI3K signalling [Citation58]. Deregulation of the mTOR pathway is often observed in CRC, which is consistent with its critical role in regulating cell growth and metabolism [Citation59]. Also, mTOR can increase glutamine flux through c-Myc upregulation, which in turn increases glutaminase activity [Citation60]. By this mechanism, oncogenic Akt and mTOR triggers protein synthesis and enhances CRC cell growth and proliferation. The ability of oncogenic mTOR to triggers apoptosis was investigated in view of its usefulness to evaluate the anti-tumour effect and mechanism of ISL-NLs on glycolysis. Thus, flow cytometric analysis showed that the apoptotic rate obviously increased in the HCT116 cells that were supplemented with ISL-NLs. Further, this study showed that the serine/threonine kinase Akt was down-regulated, while apoptosis markedly increased upon treatment with ISL-NLs. These results verified that the serine/threonine kinase Akt responsible for apoptosis inhibition was down-regulated by ISL-NLs. In addition, mTOR and p-mTOR are associated with the perturbation of metabolic patterns induced by ISL-NLs. In summary, the oncogenic Akt and mTOR were confirmed to be regulated in the reduced glycolysis and enhanced apoptosis triggered by ISL-NLs through flow cytometric analysis and molecular biological methods. The anti-tumour effects of ISL-NLs on tumour cell growth inhibition and induced apoptosis is possibly through the suppression of glycolysis via the regulation of the AKT/mTOR signalling pathway in the HCT116 CRC cells.
The AMPK pathway couples energy status to growth signals. However, AMPK opposes the effects of AKT1 and functions as an inhibitor of mTOR [Citation61,Citation62]. Previous studies have shown that AMPK and mTOR gene expression play a key role in inducing a metabolic shift which regulates lactate level and enhance the metastasis of CRC cells [Citation55,Citation57]. To elucidate the mechanism of liposomal ISL on CRC cells inhibition, we studied the effect of ISL-NLs on components of AMPK/mTOR pathway. We detected the effect of ISL-NLs on the Akt/mTOR pathway with our results showing an increased expression of Akt, while the phosphorylated form (p-Akt) decreased in the ISL-NLs treated HCT116 cells. In terms of mTOR, the same expression pattern with Akt was observed in the ISL-NLs treated HCT116 cells. However, ISL did not influence the expression level of total Akt and mTOR, but significantly reduced the phosphorylated forms (p-Akt and p-mTOR). These data suggested that ISL-NLs treatment inhibited Akt and caused a decrease in the phosphorylated form of Akt and mTOR, thereby suggesting that liposomal ISL suppressed the activation of AKT/mTOR signalling pathway and the downstream proteins in HCT116 cells. Taken together, ISL stimulated AMPK Thr172 phosphorylation and activation in the HCT116 cells, indicating that the AMPK/AKT/mTOR signalling pathway plays an important role in the apoptosis and glycolysis of ISL-NLs-mediated HCT116 CRC cell.
The expression levels of ENO1, which plays a key role in several types of cancer, have been shown to increase significantly in CRC tissues [Citation21]. The high expression of ENO1 is linked to the progression of CRC patients. It has also been proven that HCT116 cell line with ENO1 overexpression could promote cell invasion, migration and proliferation in vitro as well as tumourigenesis and metastasis in vivo. Mechanistically, ENO1 could regulate the AMPK/mTOR signalling pathway. AMPK pathway activation or mTOR pathway suppression is shown to block these ENO1-induced alterations [Citation21]. These findings also suggest that ENO1 may serve as a promising therapeutic target in CRC patients. Therefore, metabolic characteristics of malignant CRC cell should be altered to promote proliferation for the advantageous energy balance or invasive. These aforementioned results indicated that the mRNA levels of ENO1, ALDOA, LDHA, MCT4, c-myc and HIF-1α were reduced in ISL-NLs-treated CRC cells. Also, mRNA levels were down-regulated by ISL, but ISL-NLs down-regulated mRNA levels to a greater extent. We also found that the changes of protein levels were consistent with mRNA levels. The findings suggest that ISL-NLs-induced inhibition of glycolysis in the CRC cells mediated some key glycolytic genes. Together, these data indicate that ENO1 is a potent promoter of CRC genesis and metastasis, while ISL-NLs regulated the ENO1 mediated AMPK/mTOR pathway to inhibit the glycolysis in CRC cells.
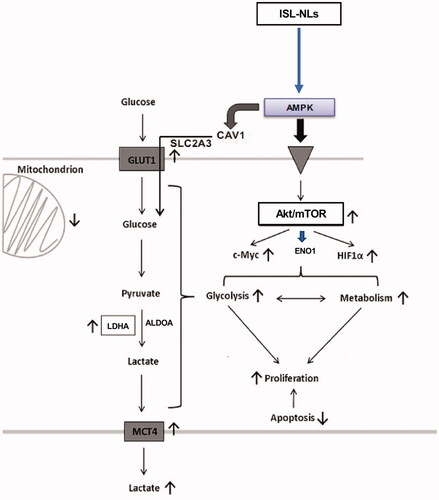
Overall, this study has highlighted the anticancer mechanisms of liposomal ISL on CRC cell growth and glycolysis activated by AMPK and Akt/mTOR pathways. Also, we investigated some key glycolysis promoting targets like ENO1, ALDOA, LDHA and MCT4, as well as metabolic genes, such as c-myc and HIF-1α. It was shown that ISL-NLs significantly suppressed the proliferation and glucose uptake in CRC cell by potentially regulating the glycolysis and lactate targets as well as pathways that formed the basis of the anti-CRC effect of ISL-NLs. The mechanism underlying this effect was further validated by the regulation of some key targets such as ENO1, ALDOA, LDHA and MCT4 in glycolysis coupled with c-myc, HIF-1α in protein kinase B/mTOR (Akt/mTOR) pathways. Moreover, the AMPK proteins were identified to be up-regulated while the lactic acid production was suppressed by ISL-NLs in the CRC cells, indicating that ISL-NLs had an inhibitory effect on AMPK mediated glycolysis and lactate production. Moreover, c-myc and HIF-1a were blocked by ISL-NLs, which played key roles in the multiple inhibition of glycolysis mediated pyruvate and lactate production, which may act as a combined targeting strategy for CRC (). These results have provided insights into the mechanism and evidence that ISL is targeted at alternative metabolic pathways of CRC, which may be useful to serve as adjuvant therapy for the disease.
Figure 11. The effects and mechanisms of ISL-NLs on AMPK/mTOR-mediated glycolysis in CRC. ISL-NLs induced the inhibitory effects on glycolysis pathway by regulating AMPK and Akt/mTOR mediated glycolysis and signalling. ISL-NLs induced CRC cell death through reduction of the glycolysis lactate, which may be regulated in the alternative metabolic pathways for CRC adjuvant therapy.
| Abbreviations | ||
| ALDOA | = | fructose-bisphosphate aldolase A |
| AMPK | = | AMP-activated protein kinase |
| ATCC | = | American Tissue Culture Collection |
| DMEM | = | Dulbecco's modified Eagle’s medium |
| DMSO | = | dimethyl sulphoxide |
| DLC | = | drug loading content |
| DLEs | = | drug loading efficiencies |
| ECAR | = | extracellular acidification rate |
| ELISA | = | enzyme-linked immunosorbent assay |
| ENO1 | = | α-enolase |
| FBS | = | foetal bovine serum |
| HIFs | = | hypoxia inducible factors |
| LDH | = | lactic acid dehydrogenase |
| IPM | = | isopropyl myristate |
| ISL | = | isoliquiritigenin |
| ISL-NLs | = | isoliquiritigenin loaded nanoliposomes |
| MCTs | = | monocarboxylic acid transporter |
| OCR | = | oxygen consumption rate |
| PBS | = | phosphate-buffered saline |
| PEG | = | polyethylene glycol |
| PI3K | = | phosphoinositide 3-kinase |
| ROS | = | reactive oxygen species |
| TME | = | tumour microenvironment |
Supporting_Table_S1__Primer_sequen_.docx
Download MS Word (15.4 KB)Disclosure statement
No potential conflict of interest was reported by the author(s).
Additional information
Funding
References
- Song LL, Li YM. Current noninvasive tests for colorectal cancer screening: an overview of colorectal cancer screening tests. World J Gastrointest Oncol. 2016;8(11):793–800.
- Siegel R. Cancer statistics. CA Cancer J Clin. 2013;63(1):277.
- Anemone A, Consolino L, Conti L, et al. In vivo evaluation of tumour acidosis for assessing the early metabolic response and onset of resistance to dichloroacetate by using magnetic resonance pH imaging. Int J Oncol. 2017;51(2):498–506.
- Zhao M, Liu Q, Gong Y, et al. GSH-dependent antioxidant defense contributes to the acclimation of colon cancer cells to acidic microenvironment. Cell Cycle. 2016;15(8):1125–1133.
- Nam SO, Yotsumoto F, Miyata K, et al. Warburg effect regulated by amphiregulin in the development of colorectal cancer. Cancer Med. 2015;4(4):575–587.
- Yan G, Li L, Bo Z, et al. Lipidome in colorectal cancer. Oncotarget. 2016;7(22):33429–33439.
- Vargas T, Moreno-Rubio J, Herranz J, et al. 3′UTR polymorphism in ACSL1 gene correlates with expression levels and poor clinical outcome in colon cancer patients. PLoS One. 2016;11(12):e0168423.
- Zhang MH, Fang XS, Guo JY, et al. Effects of AMPK on apoptosis and energy metabolism of gastric smooth muscle cells in rats with diabetic gastroparesis. Cell Biochem Biophys. 2019;77(2):165–177.
- Hardie DG, Schaffer BE, Brunet A. AMPK: an energy-sensing pathway with multiple inputs and outputs. Trends Cell Biol. 2016;26(3):190–201.
- Hu M, Chen X, Ma L, et al. AMPK inhibition suppresses the malignant phenotype of pancreatic cancer cells in part by attenuating aerobic glycolysis. J Cancer. 2019;10(8):1870–1878.
- Xiao Z, Liu S, Ai F, et al. SDHB downregulation facilitates the proliferation and invasion of colorectal cancer through AMPK functions excluding those involved in the modulation of aerobic glycolysis. Exp Ther Med. 2018;15(1):864–872.
- Zhan P, Zhao S, Yan H, et al. α-Enolase promotes tumorigenesis and metastasis via regulating AMPK/mTOR pathway in colorectal cancer. Mol Carcinog. 2017;56(5):1427–1437.
- Peng Y, Li X, Wu M, et al. New prognosis biomarkers identified by dynamic proteomic analysis of colorectal cancer. Mol Biosyst. 2012;8(11):3077–3088.
- Long NP, Lee WJ, Huy NT, et al. Novel biomarker candidates for colorectal cancer metastasis: a meta-analysis of in vitro studies. Cancer Inform. 2016;15(Suppl. 4):11–17.
- Wang G, Wang YZ, Yu Y, et al. Triterpenoids extracted from Rhus chinensis Mill Act against colorectal cancer by inhibiting enzymes in glycolysis and glutaminolysis: network analysis and experimental validation. Nutr Cancer. 2019;72:1–27.
- Dai L, Pan G, Liu X, et al. High expression of ALDOA and DDX5 are associated with poor prognosis in human colorectal cancer. Cancer Manag Res. 2018;10:1799–1806.
- Martins SF, Amorim R, Viana-Pereira M, et al. Significance of glycolytic metabolism-related protein expression in colorectal cancer, lymph node and hepatic metastasis. BMC Cancer. 2016;16:535.
- Li Y, Zhao H, Wang Y, et al. Isoliquiritigenin induces growth inhibition and apoptosis through downregulating arachidonic acid metabolic network and the deactivation of PI3K/Akt in human breast cancer. Toxicol Appl Pharmacol. 2013;272(1):37–48.
- Wu S, Xue J, Yang Y, et al. Isoliquiritigenin inhibits interferon-γ-inducible genes expression in hepatocytes through down-regulating activation of JAK1/STAT1, IRF3/MyD88, ERK/MAPK, JNK/MAPK and PI3K/Akt signaling pathways. Cell Physiol Biochem. 2015;37(2):501–514.
- Zhang X, Zhu P, Zhang X, et al. Natural antioxidant-isoliquiritigenin ameliorates contractile dysfunction of hypoxic cardiomyocytes via AMPK signaling pathway mediators. Mediators Inflamm. 2013;2013:390890.
- Yamamoto S, Aizu E, Jiang H, et al. The potent anti-tumor-promoting agent isoliquiritigenin. Carcinogenesis. 1991;12(2):317–323.
- Liu J, Wang Q, Adu-Frimpong M, et al. Preparation, in vitro and in vivo evaluation of isoliquiritigenin-loaded TPGS modified proliposomes. Int J Pharm. 2019;563:53–62.
- Gang W, Jie WJ, Ping ZL, et al. Liposomal quercetin: evaluating drug delivery in vitro and biodistribution in vivo. Expert Opin Drug Deliv. 2012;9(6):599–613.
- Wang G, Wang J, Wu W, et al. Advances in lipid-based drug delivery: enhancing efficiency for hydrophobic drugs. Expert Opin Drug Deliv. 2015;12(9):1475–1499.
- Tan B, Xiao H, Li F, et al. The profiles of mitochondrial respiration and glycolysis using extracellular flux analysis in porcine enterocyte IPEC-J2. Anim Nutr. 2015;1(3):239–243.
- Qin Y, Cheng C, Lu H, et al. miR-4458 suppresses glycolysis and lactate production by directly targeting hexokinase2 in colon cancer cells. Biochem Biophys Res Commun. 2016;469(1):37–43.
- Le DT, Jung S, Quynh NTN, et al. Inhibitory role of AMP-activated protein kinase in necroptosis of HCT116 colon cancer cells with p53 null mutation under nutrient starvation. Int J Oncol. 2019;54(2):702–712.
- Shan M, Dai D, Vudem A, et al. Multi-scale computational study of the Warburg effect, reverse Warburg effect and glutamine addiction in solid tumors. PLoS Comput Biol. 2018;14(12):e1006584.
- Hsu PP, Sabatini DM. Cancer cell metabolism: Warburg and beyond. Cell. 2008;134(5):703–707.
- Satoh K, Yachida S, Sugimoto M, et al. Global metabolic reprogramming of colorectal cancer occurs at adenoma stage and is induced by MYC. Proc Natl Acad Sci USA. 2017;114(37):E7697–E7706.
- Cairns RA, Harris IS, Mak TW. Regulation of cancer cell metabolism. Nat Rev Cancer. 2011;11(2):85–95.
- Markert EK, Levine AJ, Vazquez A. Proliferation and tissue remodeling in cancer: the hallmarks revisited. Cell Death Dis. 2012;3:e397.
- Rabinovitch RC, Samborska B, Faubert B, et al. AMPK maintains cellular metabolic homeostasis through regulation of mitochondrial reactive oxygen species. Cell Rep. 2017;21(1):1–9.
- Raina K, Agarwal C, Wadhwa R, et al. Energy deprivation by silibinin in colorectal cancer cells: a double-edged sword targeting both apoptotic and autophagic machineries. Autophagy. 2013;9(5):697–713.
- Qiu SL, Xiao ZC, Piao CM, et al. AMP-activated protein kinase α2 protects against liver injury from metastasized tumors via reduced glucose deprivation-induced oxidative stress. J Biol Chem. 2014;289(13):9449–9459.
- Kanazawa M, Satomi Y, Mizutani Y, et al. Isoliquiritigenin inhibits the growth of prostate cancer. Eur Urol. 2003;43(5):580–586.
- Ma J, Fu NY, Pang DB, et al. Apoptosis induced by isoliquiritigenin in human gastric cancer MGC-803 cells. Planta Med. 2001;67(8):754–757.
- Hsu YL, Kuo PL, Lin LT, et al. Isoliquiritigenin inhibits cell proliferation and induces apoptosis in human hepatoma cells. Planta Med. 2005;71(2):130–134.
- Wang KL, Hsia SM, Chan CJ, et al. Inhibitory effects of isoliquiritigenin on the migration and invasion of human breast cancer cells. Expert Opin Ther Targets. 2013;17(4):337–349.
- Wang Z, Wang N, Han S, et al. Dietary compound isoliquiritigenin inhibits breast cancer neoangiogenesis via VEGF/VEGFR-2 signaling pathway. PLoS One. 2013;8(7):e68566.
- Wang JR, Luo YH, Piao XJ, et al. Mechanisms underlying isoliquiritigenin-induced apoptosis and cell cycle arrest via ROS-mediated MAPK/STAT3/NF-κB pathways in human hepatocellular carcinoma cells. Drug Dev Res. 2019;80(4):461–470.
- El Halabi I, Bejjany R, Nasr R, et al. Ascorbic acid in colon cancer: from the basic to the clinical applications. Int J Mol Sci. 2018;19(9):2752.
- Wang G, Wang JJ, Yin PH, et al. Strategies to target energy metabolism in consensus molecular subtype 3 along with Kirsten rat sarcoma viral oncogene homolog mutations for colorectal cancer therapy. J Cell Physiol. 2019;234(5):5601–5612.
- Aguirre-Portolés C, Fernández LP, Ramírez de Molina A. Precision nutrition for targeting lipid metabolism in colorectal cancer. Nutrients. 2017;9(10):1076.
- Yun J, Mullarky E, Lu C, Bosch KN, et al. Vitamin C selectively kills KRAS and BRAF mutant colorectal cancer cells by targeting GAPDH. Science. 2015;350(6266):1391–1396.
- Mitov MI, Harris JW, Alstott MC, et al. Temperature induces significant changes in both glycolytic reserve and mitochondrial spare respiratory capacity in colorectal cancer cell lines. Exp Cell Res. 2017;354(2):112–121.
- van Schaardenburgh M, Wohlwend M, Rognmo Ø, et al. Mitochondrial respiration after one session of calf raise exercise in patients with peripheral vascular disease and healthy older adults. PLoS One. 2016;11(10):e0165038.
- Ha TK, Chi SG. CAV1/caveolin 1 enhances aerobic glycolysis in colon cancer cells via activation of SLC2A3/GLUT3 transcription. Autophagy. 2012;8(11):1684–1685.
- Tong X, Zhao F, Mancuso A, et al. The glucose-responsive transcription factor ChREBP contributes to glucose-dependent anabolic synthesis and cell proliferation. Proc Natl Acad Sci USA. 2009;106(51):21660–21665.
- Ha TK, Her NG, Lee MG, et al. Caveolin-1 increases aerobic glycolysis in colorectal cancers by stimulating HMGA1-mediated GLUT3 transcription. Cancer Res. 2012;72(16):4097–4109.
- Deran M, Yang J, Shen CH, et al. Energy stress regulates Hippo-YAP signaling involving AMPK-mediated regulation of angiomotin-like 1 protein. Cell Rep. 2014;9(2):495–503.
- Yao G, Zhang Y, Wang D, et al. GDM-induced macrosomia is reversed by Cav-1 via AMPK-mediated fatty acid transport and GLUT1-mediated glucose transport in placenta. PLoS One. 2017;12(1):e0170490.
- Inoki K, Kim J, Guan KL. AMPK and mTOR in cellular energy homeostasis and drug targets. Annu Rev Pharmacol Toxicol. 2012;52(1):381–400.
- Johnson SM, Gulhati P, Rampy BA, et al. Novel expression patterns of PI3K/Akt/mTOR signaling pathway components in colorectal cancer. J Am Coll Surg. 2010;210(5):767–778.
- Faller WJ, Jackson TJ, Knight JRP, et al. mTORC1-mediated translational elongation limits intestinal tumour initiation and growth. Nature. 2015;517(7535):497–500.
- Li YC, He SM, He ZX, et al. Plumbagin induces apoptotic and autophagic cell death through inhibition of the PI3K/Akt/mTOR pathway in human non-small cell lung cancer cells. Cancer Lett. 2014;344(2):239–259.
- Ma XM, Blenis J. Molecular mechanisms of mTOR-mediated translational control. Nat Rev Mol Cell Biol. 2009;10(5):307–318.
- Kim N, Jeong S, Jing K, et al. Docosahexaenoic acid induces cell death in human non-small cell lung cancer cells by repressing mTOR via AMPK activation and PI3K/Akt inhibition. Biomed Res Int. 2015;2015:239764.
- Toda K, Kawada K, Iwamoto M, et al. Metabolic alterations caused by KRAS mutations in colorectal cancer contribute to cell adaptation to glutamine depletion by upregulation of asparagine synthetase. Neoplasia. 2016;18(11):654–665.
- Csibi A, Lee G, Yoon SO, et al. The mTORC1/S6K1 pathway regulates glutamine metabolism through the eIF4B-dependent control of c-Myc translation. Curr Biol. 2014;24(19):2274–2280.
- Inoki K, Zhu T, Guan KL. TSC2 mediates cellular energy response to control cell growth and survival. Cell. 2003;115(5):577–590.
- Gwinn DM, Shackelford DB, Egan DF, et al. AMPK phosphorylation of raptor mediates a metabolic checkpoint. Mol Cell. 2008;30(2):214.