
Abstract
Cancer stem cells (CSCs) have been implicated in the growth and progression of several types of human cancer. The technology to derive and establish CSCs in vitro could be a critical tool for understanding cancer and developing new therapeutic targets. In this study, we derived expandable CD15+ induced CSCs (iCSCs) from immortalised 293FT human epithelial cells by co-culture with human bone marrow-derived mesenchymal stem cells (BM-MSCs) as feeder cells in vitro. The iCSCs converted through an epithelial-mesenchymal transition program acquired mesenchymal traits, the expression of stem cell markers, and epigenetic changes. Moreover, the iCSCs not only efficiently formed tumorspheres in vitro but also initiated tumours in immunocompromised mice injected with only 10 of the iCSCs. Furthermore, we showed that the expression of the chemokine CXCL12 and its receptor CXCR4 by the iCSCs resulted in the activation of the Fut4 gene through CXCR4/ERK/ELK-1-signalling pathways and the maintenance of the iCSCs in the undifferentiated state through CXCR4/AKT/STAT3-signalling. These findings suggest that immortalised 293FT cells may acquire potential oncogenicity through molecular and cellular alteration processes in microenvironments using BM-MSCs, and could represent a valuable in vitro model as a cancer stem cell surrogate for studying the pathophysiological properties of CSCs.
Introduction
There is increasing evidence for the existence of cancer stem cells (CSCs) within a population of cancer cells, which are defined by specific cell surface antigen expression and are believed to initiate and sustain new tumour growth and mediate chemoresistance [Citation1,Citation2]. The development of a CSC-targeting strategy for the elimination of the CSC population is critical for improving the treatment of cancer patients. However, it is difficult to isolate pure populations of CSCs to expand into large numbers for the characterisation of their biological properties and for high throughput screening of CSC-targeting compounds.
Currently, there are several techniques [Citation3–5] for isolating CSCs from tumour cell lines or tissues including cell sorting technologies by magnetic-activated cell sorting (MACS) or fluorescence-activated cell sorting (FACS) using antibodies against CSC-specific surface antigens [Citation6]. These methods have provided much information about cancer stem cell isolation. However, it is often not feasible to obtain tumour tissues from cancer patients due to legal or administrative limitations, and it has not yet been possible to isolate sufficient numbers of CSCs. Bone marrow-derived mesenchymal stem cells (BM-MSCs), as part of the cancer cell niche, expressing SDF-1α (CXCL12) are multipotent cells, which are also able to enhance the stemness of cancer cells through multiple signalling pathways in vivo [Citation7–9].
In this study, we focussed on generating CSC-like cells, such as CSC surrogates, from non-CSC like cells under a certain cell culture condition. To do this, we used a co-culture method with BM-MSCs to convert an immortalised epithelial 293FT cell line into CSCs. Our newly developed method for the induction and maintenance of CSCs would be very useful to overcome the current limitations of the study with CSCs and expedite the investigation of significance of CSCs in cancer development and treatment.
Methods
Animal studies
All animal protocols were approved by the Korea University Institutional Animal Care and Use Committee (KUIACUC-2015-67) and were performed in accordance with government and institutional guidelines and regulation. Six week-old male BALB/c nude mice (n = 70) were purchased from Central Lab Animal Inc (Seoul, Korea) were housed under a 12-h light/dark cycle (08:00–20:00) with free access to water and food in pathogen-free conditions. The various ranges of unsorted-iCSCs or CD15+ or CD15− or 293FT cells with Matrigel (Corning) were injected subcutaneously at abdomen in Balb/c nude mice, respectively. Number of the injected cells was ranged from 1 × 101 to 5 × 10⁶. The tumours were detected from about 4 weeks after cell implantation, but the exact time of tumour formation was dependent on the cell type or number. Tumours size was measured every 2–3 days and expressed as volume (length × width × height). Mice were sacrificed when tumour size reached 1.5 cm in the largest diameter.
Cell line and culture conditions
Human bone marrow-derived MSC cell lines were purchased from LONZA (Walkersville, MD, USA), human immortalised cell lines (HEK293 and 293 T) were obtained from American Tissue Type Culture Collection (Manassas, VA, USA), 293FT cell lines were obtained from Invitrogen, and DP (dermal papilla) cells were from Dr. Sung (Kyungpook National University, Daegu, Korea). NSC (neural stem cells) were cultured in DMEM media containing 1% GlutaMAX™-I, 10% FBS, and 1% penicillin/streptomycin (all from Gibco) at 37 °C in 5% CO2/95% air and the medium was replaced every third day. Approximately 70–80% confluency of the BM-MSC lines were cultured in LONZA MSCBM (mesenchymal stem cell basal medium) supplemented with 10% MCGS supplement, 2% L-glutamine and 0.1% GA-1000. For iCSC generations, less than 50 cells of each human immortalised cell line were co-cultured with iCSC media (DMEM media containing 1% GlutaMAX™-I, 10% FBS, and 1% penicillin/streptomycin plus 2 mM Glutamine (Gibco) in the presence of BM-MSC feeder cells (passage number 3) for more than 20 days to form colonies, which were sub-cultured by mechanical passaging. Then, established iCSCs and their control cells were expanded up to more than 23–25 passages for further analyses.
Statistics
Data were analysed by two-tailed Student’s t-test. p values < .05 (*) and < .01 (**) were considered statistically significant. Data are presented as the mean ± standard deviation of mean. Survival curves of the mice were analysed by the Kaplan–Meier method and compared with the Log-rank test. Statistical analysis were conducted using SPSS software (IBM).
Results
Conversion of the immortalised and cancer cell lines into CSC-like cells in vitro
To determine whether CSC-like cells can be generated from immortalised and cancer cell lines, we selected five human immortalised cell lines (HEK293, 293 T, 293FT, DP, and NSC) and five human cancer cell lines (U87-MG, MCF7, HeLa, SW480, and A549) and co-cultured a small number of cells (less than 50, approximately) of each cell line on BM-MSC cells in our culture system using DMEM-GlutaMAX™-I as the basal media supplemented with 10% FBS, 25 mM glucose, and 6 mM glutamate (we call this the CSC media for induction and maintenance) for 20 days (; Supplementary Figure S1(a)). BM-MSCs were used as feeder cells to constitute an in vitro microenvironment to induce and maintain CSCs. Seven days after co-culture with BM-MSCs, some colonies with mesenchymal cell morphology appeared on feeder cells from nine cell lines (HEK293, 293 T, 293FT, DP, U87-MG, MCF7, HeLa, SW480, and A549), which were visible under a phase-contrast microscope (). However, no colonies were apparent from the NSC line (Figure S1(a)).
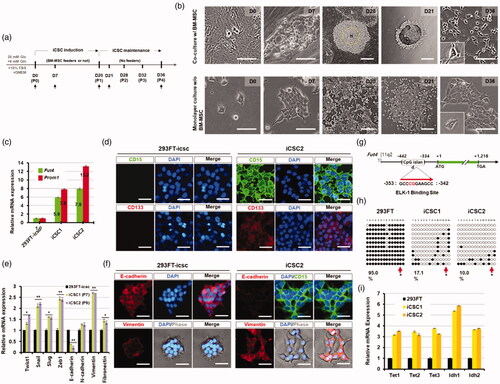
Figure 1. Conversion of 293FT cells to cancer stem cell-like cells using co-culture with human bone marrow-derived mesenchymal stem cells. (a) Experimental procedure to generate induced cancer stem cell-like cells (iCSCs). (b) Phase-contrast images of iCSCs generated from 293FT cells. High-density 293FT cells (H) were isolated and passaged by mechanical dissociation at P1 and then the cells were expanded up to P4 under feeder-free culture conditions with iCSC media. Representative photos (magnification ×400 or ×40; scale bars, 10 µm) showing the morphological difference between 293FT-icsc cells (293FT cell cultured with iCSC media) and iCSCs. Insets in bottom left corner, original magnification ×400. (c) Real-time PCR analyses of either Fut4 mRNAs or Prom1 mRNAs in 293FT-icsc cells and iCSCs. Results are means ± SD calculated from triplicates. Single asterisk indicates p < 0.01. (d) Immunofluorescence images of 293FT-icsc cells and iCSC2 stained with brain cancer stem cell markers, CD15 or CD133. Representative photos (magnification ×200; scale bars, 10 µm). (e) Real-time PCR analyses of EMT-related genes in 293FT-icsc cells and iCSCs. Results are means ± SD calculated from triplicates. Single asterisk indicates p < 0.01. (f) Immunofluorescence images of 293FT-icsc cells and iCSC2 stained with E-cadherin, vimentin. Representative photos (magnification ×200; scale bars, 30 µm). (g) Schematic representation of the CpG island region (-442 to -334 region) in the Fut4 promoter. +1 designated as a translational initiation site of the Fut4 gene. (h) Bisulphite sequencing analyses of the CpG island region in the Fut4 promoter. Each circle represents one CpG site in the CpG Island. Filled circles (●) represent methylated CpG sites, whereas open circles (^) indicate unmethylated CpG sites. (i) Real-time PCR analysis of the DNA demethylation-associated gene expression. Results are means ± SD calculated from triplicates.
Subsequently, the colonies derived from nine cell lines were maintained for 20 days, and then a fraction of the cells from growing colonies was picked up (P0, passage number 0) and expanded up to P4 without feeder cells as described in the supplementary methods (Figure S1(a)). Next, these subculture cells at P4 originated from different cell lines were analysed by FACS analysis with the CD133 antibody, a broad-spectrum marker of CSCs. Interestingly, the number of CD133+ cells was 6 times increased in the 293FT cell line-derived cells compared to the parental 293FT cell line (Figure S1(b)). Similarly, HEK293 cell-derived cells showed a 2.86-fold increase in the number of CD133+ cells compared to the HEK293 cell line; the other cell line-derived colonies did not show any significant increase (Figure S1(b)). We further analysed the cells that were derived from five immortalised cell lines with the CD15 CSC marker. In our FACS analysis, the percentage of CD15+ cells was strikingly increased in the 293FT-derived colonies, which showed a 16.37-fold increase compared to the 293FT cell line, but was not significantly increased in the other immortalised cell line-derived cells (Figure S1(c)). Taken together, these results demonstrate that most of the human immortalised and cancer cell lines were morphologically converted to CSC-like cells in our co-culture system with BM-MSCs, but only 293FT immortalised cell line can develop to the induced CSC (iCSC)-like cell lines (named iCSC1 and iCSC2) expressing CSC marker CD133 and CD15 (Figure S1(d)).
To further characterise the established iCSC lines, the gene expression levels of Fut4 and Prom1 (CD15 and CD133 marker genes, respectively) from the same passage number (P7) of the iCSC lines were analysed by real-time RT-PCR (). Fut4 and Prom1 were highly up-regulated in iCSC lines compared to 293FT cells, and the expression levels of the two genes were significantly higher in iCSC2 than iCSC1 (). In addition, our immunostaining and FACS results using CD133 and CD15 antibodies were consistent with those obtained by real-time RT-PCR analysis (, , showing that the established iCSC lines acquired the properties of CSCs. Interestingly, we found that while the 293FT cell line showed the typical epithelial-like morphology with regular dimensions [Citation10], the iCSC lines showed mesenchymal cell morphology under the culture condition with the CSC media for 36 days ( and Figure S1(d)).
To further examine whether the observed mesenchymal cell morphology of iCSC was originated via the process of an epithelial-to-mesenchymal transition (EMT), we analysed the expression levels of EMT-related genes. The iCSC lines showed high expression levels of the mesenchymal-associated genes such as Twist1, Snail, Slug, Zeb1, vimentin, and fibronectin compared to the 293FT cell line (2.77 ± 2–4.54 ± 2-fold), while the expression level of E-cadherin was dramatically decreased in the 293FT cell line (). These data were consistent with those from our immunostaining analysis ( and Figure S1(g)) although there was no significant difference in N-cadherin expression between the iCSCs and the 293FT cell line (). In addition, we confirmed that the iCSC lines were derived from 293FT cells via short tandem repeat (STR) analysis with the 16 polymorphic DNA markers (Table S1). Taken together, we concluded that the iCSC lines were generated from 293FT cells through an EMT process under coculture with BM-MSCs.
Next, to explore whether upregulation of Fut4 in iCSC1 and iCSC2 lines is caused by epigenetic change in 293FT cells, we examined the methylation patterns on Fut4 promoter of the 293FT cell line and the iCSC1 and iCSC2 lines. The results showed that the levels of methylation of Fut4 of the iCSC lines was much reduced compared to that of the 293FT cell line (17.1% for iCSC1 and 10.0% for iCSC2 versus 95.0% for 293FT cells, respectively) (). Interestingly, our Bisulphite Sequencing PCR (BSP) analysis data showed that the ELK-1 binding consensus sequence containing one CpG dinucleotide was unmethylated in both iCSC1 and iCSC2 ( arrows), but methylated in the 293FT cell line (). Furthermore, we found that mRNA levels of Tet1-3 and Idh1-2, known as the key regulators of DNA demethylation [Citation11], were dramatically increased in the iCSC lines compared to the 293FT cell line ().
Taken together, our results demonstrate that the established iCSCs were epigenetically converted from the 293FT cell line in vitro, and that the iCSC lines may be surrogates for authentic CSCs.
Conversion of the 293FT cell line to CSC-like cells by the SDF-1α/CXCR4 signalling pathway
To understand the underlying mechanism by which BM-MSC converted the 293FT cell line to CSC-like cells, we examined the BM-MSC secreted factors such as chemokines that are involved in the signalling pathways promoting cancer initiation and progression. It is well known that the CXCL12(SDF-1α)/CXCR4 signalling pathway plays a critical role in regulating various cellular activities [Citation12].
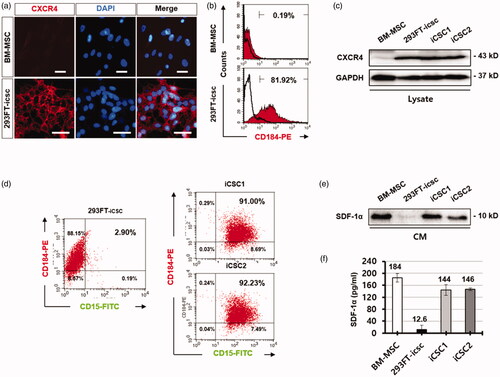
Thus, we first examined the expression levels of CXCR4 and SDF-1α in the 293FT cell line, BM-MSCs, and iCSC lines by FACS analysis. The result showed that CXCR4 was highly expressed in 293FT cells (81.2%) compared to BM-MSCs (0.19%) (), and the population of CXCR4+/CD15+ cells was enriched approximately 31-fold higher in the iCSC lines (91–92.23%) compared to the 293FT cell line (2.9%) (). Western blot and ELISA analyses revealed that both BM-MSCs and the iCSC lines secreted higher levels of SDF-1α compared to the 293FT cell line (). Thus we hypothesised that the conversion of the 293FT cell line to a CSC phenotype could be associated with the activated CXCR4 signalling pathway induced by secreted SDF-1α from BM-MSCs feeder cells.
Figure 2. CXCR4/CD184 was highly increased in iCSCs. (a) Immunofluorescence images of CXCR4/CD184 protein expression in human BM-MSCs and 293FT-icsc cells. (b) Flow cytometry analyses for CXCR4/CD184 protein expression in human BM-MSCs and 293FT-icsc cells. (c) Western blot images of CXCR4/CD184 protein expression in whole cell lysates from human BM-MSCs, 293FT-icsc cells, and iCSCs. (d) Flow cytometry analyses for CXCR4/CD184 and CD15 protein expression in iCSCs. (e) Western blot images of CXCL12/SDF-1α chemokine expression in conditioned media from human BM-MSCs, 293FT-icsc cells, and iCSCs. (f) ELISA analysis of CXCL12/SDF-1α chemokine expression levels in conditioned media from BM-MSCs, 293FT-icsc, and iCSCs. Results are means ± SD independently calculated from triplicates.
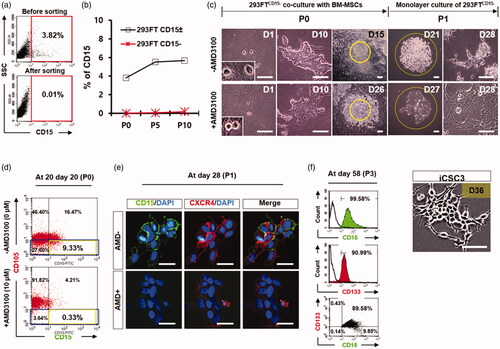
To test this hypothesis, we first excluded potential cancer stem cells in 293FT cells by isolating 293FTCD15− cells (293FTCD15± cells) using MACS and confirmed that the isolated 293FTCD15− cells (P0) were negative for CD15 antibody (). Then, we cultured these cells without BM-MSC feeder cells in our iCSC media up to 10 passages (approximately 30 days) to avoid autonomously converted 293FTCD15+ cells emerged during long-term culture. We did not observe the significant increase of 293FTCD15− cell populations under this culture condition by FACS analysis (). Next, a small fraction of 293FTCD15− cells was co-cultured with BM-MSC feeder cells for more than 20 days in the presence or absence of AMD3100 (10 μM), a specific inhibitor of CXCR4 (). FACS analysis showed that the CD15+ cells were 9.33% in the culture condition without AMD, while CD15+ cells were only 0.33% in the culture condition with AMD at 20 days after co-culture with BM-MSCs (). Consistent with this result, immunostaining analysis also revealed that the CD15+ cells could be detected at about 15 days after co-culture of 293FTCD15− cells (P0) with BM-MSC in a condition without AMD, while the CD15+ cells were not detected in the culture condition with AMD (Figure S2). After small clumps were mechanically passaged (P1) onto a petri-dish without BM-MSC feeder cells at day 21, the CD15+ cells were cultured for more than 7 days and then were clearly detected in a condition without AMD as shown in . Our FACS analysis with the CSC markers CD15 and CD133 showed that the majority (89.58%) of these cells were CD15+/CD133+ at 58 days (P3), and some (9.85%) of these cells were CD15+/CD133− (). The morphology of this established iCSC cell line (named the iCSC3 cell line) was similar to the iCSC1 and iCSC2 lines (). These results demonstrate that the secreted factor SDF-1α from co-cultured BM-MSCs feeder cells contributes to the conversion of 293FTCD15− to iCSCs, which may be mediated by activating CXCR4 signalling in 293FTCD15− cells.
Figure 3. iCSC generation from 293FTCD15− cells. (a) Flow cytometry analysis of CD15/SSEA-1 protein expression in 293FTCD15−-icsc cells after purification of 293FTCD15− cells from 293FTCD15± cells. (b) Flow cytometry analyses of sorted 293FTCD15−-icsc cells over time in culture in a representative time course experiment: passage number 0, 5, and 10 (P0, P5, and P10). (c) Phase-contrast images of iCSCs generated from 293FTCD15−-icsc cells co-cultured with BM-MSC in the presence or absence of AMD3100. Insets in bottom left corner, original magnification ×400. (d) Flow cytometry analyses of the CD105 and CD15 protein expression in 293FTCD15− cells co-cultured with BM-MSC in the presence or absence of AMD3100 at P0. (e) Immunofluorescence images of CD15 and CXCR4 protein expression in iCSC3 at P1. (f) Flow cytometry analysis of CD15 and CD133 protein expression in iCSC3 cells at P3. (g) Images show the colonies formed by 293FTCD15− cells with BM-MSC in the presence or absence of AMD3100 at P0.
Next, we examined the molecular mechanism underlying SDF-1α-mediated iCSC transition of 293FT cells under our experimental condition. Interestingly, we observed that pELK-1 (S383) protein was increased in the nucleus of the iCSC lines treated with recombinant SDF-1α () whereas the protein was completely prevented in the presence of AMD3100 or PD98059, which are specific inhibitors of CXCR4 and ERK1/2, respectively [Citation13] (). In addition, we found that ELK-1 protein directly bound to a region of the Fut4 promoter, using a chromatin immunoprecipitation (ChIP) assay (Figure S3(a–c)). These results indicate that the Fut4 gene is transcriptionally upregulated by activated ELK-1, and in turn increases the expression of CD15 proteins on the cell surface of iCSC.
Figure 4. CXCL12/CXCR4 activates ERK/ELK-1 and AKT/STAT3-signalling pathways in iCSCs. (a) Experimental procedure for the activation of CXCL12/CXCR4 in iCSCs. (b) Immunofluorescence images of pELK-1 subcellular distribution. (c) Western blot images of ERK1/2 (Thr202-204) and ELK-1 (Ser383) phosphorylation in response to SDF-1α/CXCL12 in iCSCs. A graph shows quantification of the western blotting results. (d) Western blot images of AKT (Ser4732) and STAT3 (Tyr705) phosphorylation in response to SDF-1α/CXCL12 in iCSCs. A graph shows quantification of the western blotting results.
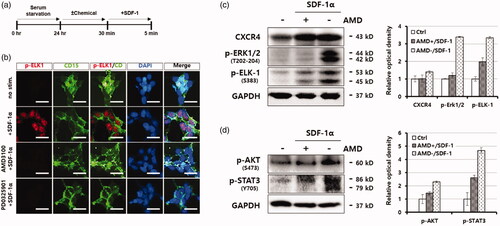
Next, we investigated whether the SDF-1α/CXCR4 signalling pathway is directly linked to ERK/ELK-1-activation [Citation14,Citation15] or AKT/STAT3-activation [Citation16–19] in the iCSC lines. To this end, we treated iCSC1 line with SDF-1α in the presence and absence of AMD3100 and examined phosphorylation status of these signalling proteins by immunoblotting analysis with phsopho-specific antibodies. We observed that activation of CXCR4 signalling pathway by SDF-1α markedly increased the phosphorylation levels of both the ERK1/2 (T202-204) and ELK-1 (S383) proteins (). Similarly, the phosphorylation levels of both AKT (S473) and STAT3 (Y705) proteins were also significantly increased under the same condition (). Taken together, these results demonstrate that SDF-1α activated the ERK/ELK-1 and/or AKT/STAT3 proteins as an autocrine signalling effect.
Self-renewal and differentiation potentials of the iCSC lines in vitro
To evaluate the self-renewal ability of the established iCSC lines, we performed tumorsphere formation assays with the iCSC lines and the 293FT cell line in the NSC culture medium (DMEM/F12, 1% N2, 1% ITSA, 1% B27, 1% penicillin/streptomycin, 20 ng/ml EGF, 20 ng/ml FGF2). A U87-MG human glioblastoma cell line [Citation20] was used as a positive control (Additional file 4: Figure S4(a)). After 10-day suspension culture, all cell lines including the iCSC lines were grown as floating spheres, but the majority of the 293FT and U87-MG cell lines were attached to both mammalian bacterial culture dishes after a 15-day induction ( and (a)). The primary spheres from the iCSC lines showed a fast growth rate compared to the others ().
Figure 5. Sphere formation ability is markedly elevated in iCSCs. (a) Sphere comparison of 293FT-icsc cells and iCSC lines in suspension culture. Representative photos (magnification ×100; black scale bars, 10 µm). (b) Numbers of primary spheres (>10–40 μm or >40 μm) generated from 293FT-icsc cells and iCSCs. (c) Flow cytometry analyses of brain cancer stem cell marker protein levels, CD15 and CD133, in 293FT-icsc cells and iCSCs. (d) Immunofluorescence images of CD15 and CD133 protein expression in 293FT-icsc cells and iCSCs. (e) Real-time PCR analyses of multi-drug resistant gene expression. Results are means ± SD calculated from triplicates.
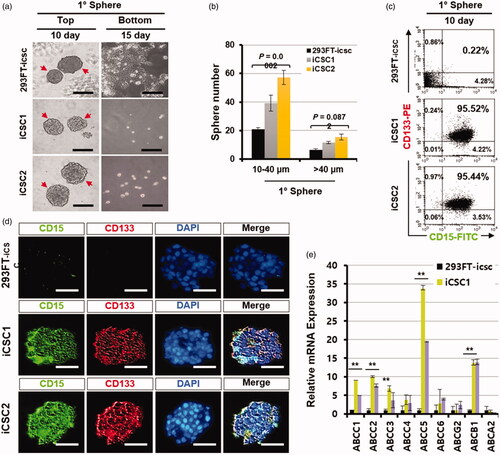
Next, we analysed the cells that were dissociated from the primary spheres of the iCSC lines by FACS with CD15 and CD133 antibodies. Interestingly, most cells dissociated from the iCSC line-derived spheres were CD15+ and CD133+, but the cells from the 293FT cell- or U87-MG cell-derived primary spheres were CD15− and CD133− ( and Figure S4(c)). The primary spheres from iCSC lines were also CD15+ and CD133+ in our immunostaining assays, but the spheres from 293FT and U87-MG cell lines were CD15− and CD133− ( and Figure S4(d)). These results demonstrate that the iCSC lines have self-renewal ability and are clonogenic in vitro.
To examine the level of ABC-binding cassette transporters, known to be highly expressed in CSCs [Citation21], we performed real-time RT-PCR experiments with the total RNA isolated from suspension-cultured iCSC lines. The expression levels of Abcc1, Abcc2, Abcc3, Abcc5, and Abcb1 genes were significantly increased, but not Abcc4, Abcc6, Abcg2, and Abca2 (). Taken together, these results demonstrate that the cells constituting the spheres were highly chemoresistant, indicating that our iCSC lines possess the typical properties of CSCs. Interestingly, we found that the cells in the primary spheres were strongly positive against NSC markers (CD15, CD133, NESTIN, SOX2 or NCAM) [Citation22] and stem cell marker (OCT4) antibodies () when the iCSC lines were grown as spheres, suggesting that a population of cells consisting of iCSC may be CSCs with neural lineage properties.
Figure 6. iCSCs are differentiated into both glial and neuronal lineages in vitro. (a) Immunofluorescence images of neural stem cell marker protein expression in iCSC-spheres. Representative photos (magnification ×100, ×200; scale bars, 10 µm). (b) Experimental procedure for differentiation. (c) Immunofluorescence images of neural lineage marker protein expression in iCSC-spheres. Representative photos (magnification ×200; white scale bars, 10 µm). (d) Quantification of the results of c.
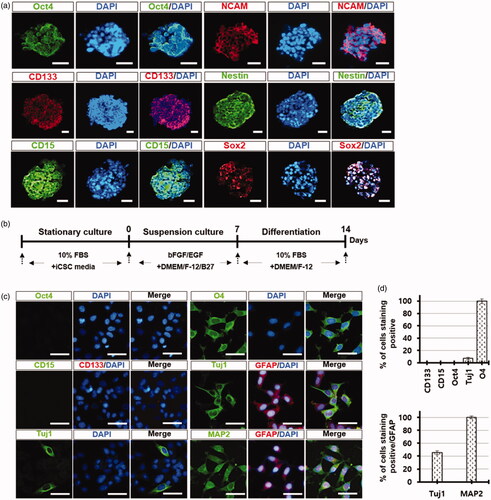
Next, to examine the differentiation potentials of the iCSC lines, the iCSC-derived spheres were cultured in DMEM/F-12 medium supplemented with B27, bFGF, and EGF for 7 days, and then subsequently cultured in the medium supplemented with 10% FBS for 7 days (). Differentiated cells from the iCSC-spheres were positive with neuronal (Tuj1 and MAP2), oligodendrocyte (O4), and astrocyte marker (GFAP) antibodies, but were negative with Oct4, CD15, and CD133 marker antibodies (). Interestingly, some differentiated cells were positive for both neuronal and glial markers (Tuj1/GFAP or MAP2/GFAP) (), indicating that some cells from iCSC-spheres can possess two lineages, such as neuronal and glial. These results demonstrate that the iCSC lines were directly differentiated into the mature cancer cells with neural lineage properties.
Tumorigenicity and self-renewal of the iCSC lines in vivo
To demonstrate the tumorigenic potentials of the iCSC lines, we first isolated the CD15+ and CD15− cells from the iCSC1 line using FACS. The unsorted-iCSC1, CD15+, CD15−, and 293FT cell lines were subcutaneously injected into BALB/c nude mice. The unsorted-iCSC1 line and the CD15+ cells induced tumours at a very low dose (1:133 for iCSC1 cells versus 1:134 for CD15+ cells, p = .995), while the CD15− cells induced tumours only at a high dose (1:28,004 for CD15− cells versus 1:134 for CD15+ cells, p = 2.08e-7), and a high dose of 293FT cells (1 × 10⁴) did not induce tumours (). In addition, as few as ten CD15+ cells or ten cells from the unsorted iCSC1 line were sufficient to initiate tumours in immunocompromised mice, suggesting that the expression of CD15 proteins may be directly involved in maintaining stem cell properties.
Figure 7. Estimation of tumour-initiating cell frequency in the iCSC1 line. (a) Limiting dilution transplantation assay into BALB/c recipient nude mice using the indicated numbers of cells. (b) Comparison of tumour volume over time when the respective cells (1 × 10⁴) were injected into BALB/c mice. Result is shown as mean ± SD from three to six tumours. (c) Resected tumours from BALB/c mice 61 or 71 days after subcutaneous injection using the indicated numbers of cells. (d) Kaplan–Meier survival curve of the mice using the indicated numbers of cells. CD15+ cells and iCSC1 cells show a median mouse survival time (T50) of 15–16 weeks, respectively (log-rank test, p = .7857). (e) Self-renewal ability by serial transplantation of the iCSC line in BALB/c nude mice. 1 × 10⁴ cells were injected for all passages.
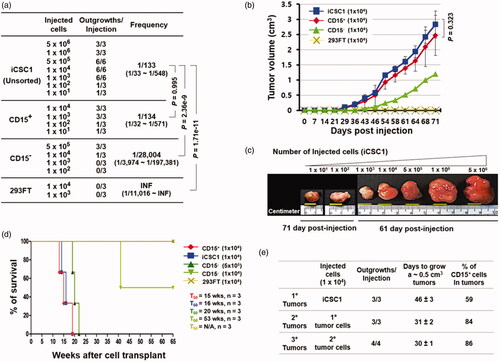
We also evaluated the relationship between the tumorigenic potentials of CD15+ or CD15− cells and their subsequent effects on mortality at the same cell dose (). Three weeks after injection, the tumours were palpable. Some mice injected with the iCSC1 line were euthanized to compare their gross tumour size at 71 days post-injection (). We checked tumour size once every three days; the tumours from the iCSC1 line and CD15+ cells grew at an extremely rapid rate and reached a tumour volume of 0.5 cm3 by 46 days post-injection. However, the tumours from the CD15− cells were slowly developed compared to those from the iCSC1 line and CD15+ cells and reached a volume of 0.5 cm3 volume on day 61 after the initial injection of CD15− cells (). We further examined cumulative survival rates comparing CD15+ cell tumours and CD15− cell tumours along with control cells. The results showed that the median overall survival (T50) among mice injected with cells from the iCSC1 line and the CD15+ cells was less than 16 weeks (16 weeks for iCSC1 cells vs 15 weeks for CD15+ cells; 95% confidence interval [CI] of ratio, 0.86 − 1.27; p = 0.79; ) compared to 53 weeks among mice injected with the CD15− cells at the same cell dose. In contrast, the median overall survival among mice injected with a high dose of CD15− cells was 20 weeks, suggesting that CD15− cells can also initiate tumorigenesis in immunocompromised mice.
Because a key property of CSCs is the ability to self-renew in tumours, we examined whether CD15+ cells from primary tumours formed by the iCSCs could reconstitute secondary tumours. In addition, we also examined whether CD15+ cells from secondary tumours could form tertiary tumours. The CD15+ iCSCs from primary and secondary tumours were subsequently transplanted into new recipient mice and formed secondary and tertiary tumours, respectively. The percentage of CD15+ cells in the tumours was increased (∼59%, 84%, and 86%) (). These results indicate that the iCSCs can self-renew in vivo, and be passaged several times. In aggregate, these results demonstrate that the iCSC lines and the FACS-sorted CD15+ cells have strong tumorigenicity and self-renewal capacity in vivo.
Discussion
In this study, we developed a method for converting immortalised epithelial 293FTCD15− cells to mesenchymal CSC-like cells through epithelial to mesenchymal transition (EMT). During the conversion process, BM-MSCs and their secreted components such as SDF-1α were required, and simple CSC medium consisting of DMEM/F12-GlutaMAX, glutamine, and high glucose supported the conversion and maintenance of the CSC-like cells. The iCSCs were characterised to the neural lineages by various defined CSC markers, and also showed self-renewal capacity in vitro and in vivo. In addition, they were differentiated into glial and neuronal cells in vitro and formed hierarchically organised tumours in vivo that may act as cells of origin of cancer.
A previous report by Woodward et al. showed that 293 T human embryonic kidney cells have cancer stem cell-like features characterised by spheres formed in serum-free stem cell promoting three-dimensional culture conditions containing EGF and FGF2 [Citation23]. The spheres contained a population of higher ALDH1 and CD44+/CD24− cells compared to monolayer, which has been used to define cancer stem cells population in solid tumours including breast, colon, liver, and pancreatic cells [Citation24–26], but not for brain tumours. CSCs may be developed from stem cells [Citation27], may be generated from differentiated somatic cells with oncogenic mutations [Citation27,Citation28], or may be enriched by microenvironmental influences [Citation7,Citation8,Citation29,Citation30]. In our study, the CSC-like cells were directly derived from immortalised epithelial cells in a microenvironment using BM-MSCs without additional genetic manipulation for any artificial mutations, supporting the idea that the microenvironment can regulate the CSC phenotype [Citation31,Citation32]. Importantly, we demonstrated that CXCR4/SDF-1α signalling activation by a ligand, SDF-1α, is an important mechanism by which the iCSCs were generated from the immortalised epithelial 293FT cells.
Our EMT results () showed that several transcription factors that regulate EMT, such as Twist1, Snail1, and Zeb1, were dramatically expressed in iCSCs; these may endow iCSCs with stem cell properties [Citation33] and subsequently, make them more chemoresistant ().
In our study, BM-MSCs actively secreted SDF-1α ligand proteins and the 293FT cells highly expressed CXCR4 receptor proteins, which suggests that the process of converting the epithelial 293FT cells into iCSCs is likely to involve a CXCR4/SDF-1α signalling pathway that is linked to PI3K/AKT/NF-κB, ERK/Elk-1, and JAK/STAT3. Interestingly, we observed that treating 293FTCD15− cells with the SDF-1α inhibitor AMD3100 during co-culture dramatically suppressed their conversion into iCSCs, and the SDF-1α in iCSC lines rapidly promoted nuclear ELK-1 activation in our western blot. In our ChIP assays, the binding of ELK-1 to the Fut4 enhancer was identified in iCSCs, and it was decreased by AMD3100 or PD98059 treatment. Additionally, we observed the methylation dynamics of the ELK-1 binding site in the Fut4 promoter by bisulphite DNA sequencing analysis during the process of reprogramming immortalised epithelial cells into CSC-like cells. These findings demonstrate that CXCR4/SDF-1α signalling is directly involved in the process of reprogramming the immortalised cells to iCSCs and the long-term culture of the iCSCs.
LABB-2019-2361-R2-Supplementary_method.docx
Download MS Word (23.8 KB)LABB-2019-2361-R2-Supplementary_Figure_and_table_legends.docx
Download MS Word (4.7 MB)Disclosure statement
The authors indicated no potential conflicts of interest.
Additional information
Funding
Related Research Data
References
- Kirk R. Tumour evolution: evidence points to the existence of cancer stem cells. Nat Rev Clin Oncol. 2012;9(10):552.
- Iseghohi SO. Cancer stem cells may contribute to the difficulty in treating cancer. Genes Dis. 2016;3(1):7–10.
- Golebiewska A, Brons NH, Bjerkvig R, et al. Critical appraisal of the side population assay in stem cell and cancer stem cell research. Cell Stem Cell. 2011;8(2):136–147.
- Singh SK, Hawkins C, Clarke ID, et al. Identification of human brain tumour initiating cells. Nature. 2004;432(7015):396–401.
- Nishi M, Sakai Y, Akutsu H, et al. Induction of cells with cancer stem cell properties from nontumorigenic human mammary epithelial cells by defined reprogramming factors. Oncogene. 2014;33(5):643–652.
- Zhang DG, Jiang AG, Lu HY, et al. Isolation, cultivation and identification of human lung adenocarcinoma stem cells. Oncol Lett. 2015;9(1):47–54.
- Plaks V, Kong N, Werb Z. The cancer stem cell niche: how essential is the niche in regulating stemness of tumor cells? Cell Stem Cell. 2015;16(3):225–238.
- Ho IAW, Shim WSN. Contribution of the microenvironmental niche to glioblastoma heterogeneity. Biomed Res Int. 2017;2017:9634172.
- Wang X, Prager BC, Wu Q, et al. Reciprocal signaling between glioblastoma stem cells and differentiated tumor cells promotes malignant progression. Cell Stem Cell. 2018;22(4):514–528. e515.
- Tam WL, Weinberg RA. The epigenetics of epithelial-mesenchymal plasticity in cancer. Nat Med. 2013;19(11):1438–1449.
- Ivanov M, Kals M, Kacevska M, et al. Ontogeny, distribution and potential roles of 5-hydroxymethylcytosine in human liver function. Genome Biol. 2013;14(8):R83.
- Sun X, Cheng G, Hao M, et al. CXCL12/CXCR4/CXCR7 chemokine axis and cancer progression. Cancer Metastasis Rev. 2010;29(4):709–722.
- Zhao M, Discipio RG, Wimmer AG, et al. Regulation of CXCR4-mediated nuclear translocation of extracellular signal-related kinases 1 and 2. Mol Pharmacol. 2006;69(1):66–75.
- Barbieri F, Bajetto A, Porcile C, et al. CXC receptor and chemokine expression in human meningioma: SDF1/CXCR4 signaling activates ERK1/2 and stimulates meningioma cell proliferation. Ann N Y Acad Sci. 2006;1090:332–343.
- Chen D, Xia YL, Zuo K, et al. Crosstalk between SDF-1/CXCR4 and SDF-1/CXCR7 in cardiac stem cell migration. Sci Rep. 2015;5:16813.
- Peng SB, Peek V, Zhai Y, et al. Akt activation, but not extracellular signal-regulated kinase activation, is required for SDF-1alpha/CXCR4-mediated migration of epitheloid carcinoma cells. Mol Cancer Res. 2005; 3:227–236.
- Liang Z, Brooks J, Willard M, et al. CXCR4/CXCL12 axis promotes VEGF-mediated tumor angiogenesis through Akt signaling pathway. Biochem Biophys Res Commun. 2007;359(3):716–722.
- Huang C, Gu H, Zhang W, et al. SDF-1/CXCR4 mediates acute protection of cardiac function through myocardial STAT3 signaling following global ischemia/reperfusion injury. Am J Physiol Heart Circ Physiol. 2011;301(4):H1496–1505.
- Islam F, Gopalan V, Smith RA, et al. Translational potential of cancer stem cells: a review of the detection of cancer stem cells and their roles in cancer recurrence and cancer treatment. Exp Cell Res. 2015;335(1):135–147.
- Yu SC, Ping YF, Yi L, et al. Isolation and characterization of cancer stem cells from a human glioblastoma cell line U87. Cancer Lett. 2008;265(1):124–134.
- Jeon HM, Sohn YW, Oh SY, et al. ID4 imparts chemoresistance and cancer stemness to glioma cells by derepressing miR-9*-mediated suppression of SOX2. Cancer Res. 2011;71(9):3410–3421.
- Zou Q, Yan Q, Zhong J, et al. Direct conversion of human fibroblasts into neuronal restricted progenitors. J Biol Chem. 2014;289(8):5250–5260.
- Debeb BG, Zhang X, Krishnamurthy S, et al. Characterizing cancer cells with cancer stem cell-like features in 293T human embryonic kidney cells. Mol Cancer. 2010;9:180.
- Ginestier C, Hur MH, Charafe-Jauffret E, et al. ALDH1 is a marker of normal and malignant human mammary stem cells and a predictor of poor clinical outcome. Cell Stem Cell. 2007;1(5):555–567.
- Huang EH, Singh B, Cristofanilli M, et al. A CXCR4 antagonist CTCE-9908 inhibits primary tumor growth and metastasis of breast cancer. J Surg Res. 2009;155(2):231–236.
- DeCastro AJ, Cherukuri P, Balboni A, et al. ΔNP63α transcriptionally activates chemokine receptor 4 (CXCR4) expression to regulate breast cancer stem cell activity and chemotaxis. Mol Cancer Ther. 2015;14(1):225–235.
- Kreso A, Dick JE. Evolution of the cancer stem cell model. Cell Stem Cell. 2014;14(3):275–291.
- Scaffidi P, Misteli T. In vitro generation of human cells with cancer stem cell properties. Nat Cell Biol. 2011;13(9):1051–1061.
- Calabrese C, Poppleton H, Kocak M, et al. A perivascular niche for brain tumor stem cells. Cancer Cell. 2007;11(1):69–82.
- Melzer C, von der Ohe J, Lehnert H, et al. Cancer stem cell niche models and contribution by mesenchymal stroma/stem cells. Mol Cancer. 2017;16(1):28:
- Farace C, Oliver JA, Melguizo C, et al. Microenvironmental modulation of decorin and lumican in temozolomide-resistant glioblastoma and neuroblastoma cancer stem-like cells. PLoS One. 2015;10(7):e0134111.
- Liu YC, Lee IC, Chen PY. Biomimetic brain tumor niche regulates glioblastoma cells towards a cancer stem cell phenotype. J Neurooncol. 2018;137(3):511–522.
- Zhou P, Li B, Liu F, et al. The epithelial to mesenchymal transition (EMT) and cancer stem cells: implication for treatment resistance in pancreatic cancer. Mol Cancer. 2017;16(1):52.