
 ?Mathematical formulae have been encoded as MathML and are displayed in this HTML version using MathJax in order to improve their display. Uncheck the box to turn MathJax off. This feature requires Javascript. Click on a formula to zoom.
Abstract
Direct molecular methods such as real-time polymerase chain reaction (qPCR) and propidium monoazide (PMA)-qPCR have been successfully used for quantifying viable microorganisms in the food industry. This study attempted to use qPCR and PMA-qPCR for quantifying Lactobacillus delbrueckii spp. bulgaricus sp1.1 physiological states. The qPCR standards of the 16S rRNA gene were employed to calibrate the qPCR assay, which contributed to an amplification efficiency of 98.42%. The number of copies of the 16S rRNA gene was linearly related to cell density, and this linear relationship was used to construct a quantitative curve (R2=0.9981) with a detection limit of 15.1 colony-forming units mL−1·reaction−1. qPCR in combination with an optimal PMA concentration (60 μM) helped in discriminating and quantifying the viable cells, without any interference by heat-killed cells. Compared with the conventional methods, the population heterogeneity of viable, culturable, dormant-like and membrane-permeabilized cells were well identified and quantified using qPCR during L. delbrueckii spp. bulgaricus sp1.1 batch culture. Despite the restriction in the enumeration of lysed cells, qPCR-based methods facilitated reliable identification and quantification of bacterial physiological states and provided additional knowledge on the dynamics of L. delbrueckii spp. bulgaricus sp1.1 physiological states.
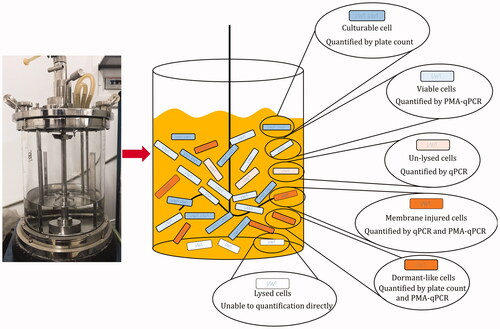
Graphical Abstract
Introduction
Lactic acid bacteria (LAB), such as some Lactobacillus, Streptococcus, and Bifidobacterium, have been used as the main probiotic ingredients in health-promoting products, “living” and available in “adequate amounts” are becoming an important requirement for the concept of probiotics [Citation1–3]. To fulfil the demand of high-yielding of their valuable biomass in probiotic products, all cells should exhibit the ability of high productivity [Citation4]. Nevertheless, previous researchers suggested that the varying of bacterial cell growth is interpreted as heterogeneous cellular states, some of the heterogeneous cellular states reduce cell yields and productivities, making bioprocesses less predictable in production scale [Citation4–6], and heterogeneous cells are a disadvantage when used as probiotics, because the probiotics must be administered in adequate “living” amounts to confer a health benefit on the host [Citation7]. In light of increasing demand for biotechnological production processes improving bacterial cell factory processes, accurate information of bacterial physiological heterogeneity under the dynamic conditions in a bioprocess is of vital importance. Consequently, advanced techniques that provide insights into bacterial cell physiology are needed [Citation8].
A variety of methods are available to study bacterial physiological heterogeneity in bioprocesses, research on microbial physiological states continues to be guided by the development of new analysis tools [Citation9], such as cultivation, flow cytometry (FCM), reporter strains, fluorescent stains, etc. Traditionally, microbial cells are determined using a typical culture-based method—plate count method, however, it is time-consuming and does not display the physiological heterogeneous of bacteria, as some dormant-like (known as viable but nonculturable, VBNC) or dead cells [Citation10,Citation11]. FCM allows the discrimination of three subpopulations of bacterial cells, i.e. viable, dead and injured cells, according to the resulting fluorescent signals [Citation12,Citation13]. However, FCM is unable to monitor and/or quantify the cellular states of a specific microorganism using this method in a complex microbial environment, particularly at low concentrations [Citation14,Citation15]. The reporter strains as well as biosensors, expressing fluorescent protein who is integrated with a promoter of interest, the fluorescence intensity can be correlated to promoter activity [Citation16,Citation17], the combination of two or more fluorescent stains simultaneously have been applied to unveils population heterogeneity [Citation4]. Reporter strains have been proven to be useful tools in numerous studies of population heterogeneity, but its application in lactic acid bacteria has not been reported to date. The fluorescent stain is a supplement to reporter strains to assess further physiological parameters, when employing fluorescent dyes, the global physiological response is seen by using FCM or fluorescence microscopy [Citation16,Citation18]. The membrane integrity can be reflected by fluorescent stains, e.g. propidium iodide (PI), ethidium bromide (EB), SYBR® Green, etc. The metabolic and respiratory activity can be sensed by carboxyfluorescein diacetate (cFDA) or Dihydrorhodamine123 (DHR), the cell-cycle is usually detected by staining cells with 6-diamidino-2-phenylindole (DAPI).
In recent decades, a precise nucleotide-based method that allows real-time continuous detection and quantification of target DNA amplicons using real-time quantitative polymerase chain reaction (qPCR), it has been proven to be a simple yet reliable technique and is recognized as a valuable alternative to culture-dependent methods for bacterial enumeration [Citation19,Citation20]. This method is sufficiently sensitive, specific and reliable in the detection of specific microorganisms within mixed microbial populations in increasingly popular biological and food processes [Citation21,Citation22]. However, the inability to differentiate between viable and nonviable cells is the major disadvantage of qPCR. To circumvent this issue, another assay combining qPCR with propidium monoazide (PMA) was developed to detect viable bacteria based on their membrane integrity. PMA dyes are membrane-impermeable and can bind covalently to genome DNA following photoactivation in vivo. The bound DNA cannot be amplified using PCR, thereby inhibiting the nonviable cell DNA amplification, this method is known as viability-qPCR [Citation23]. It is becoming a reliable technique for estimating and quantifying bacterial viability. Moreover, it is convenient and stable and provides quick results. This system has been used to accurately distinguish between VBNC and dead cells based on their membrane integrity [Citation22,Citation24]; however, when used alone, it cannot distinguish cells with a higher number of cellular physiological states [Citation14].
In the present study, we aimed to determine the dynamics of heterogeneous Lactobacillus delbrueckii spp. bulgaricus sp1.1 (L. bulgaricus sp1.1) populations in batch culture processes by using qPCR and PMA-qPCR protocols. Firstly, the calibration of the qPCR protocol was assessed to obtain an accurate quantification of L. bulgaricus sp1.1 cell density. Thereafter, the optimization and technical validation were performed using PMA-qPCR for defined ratios of viable and nonviable cells. Furthermore, qPCR and PMA-qPCR were implemented and evaluated as approaches to assess L. bulgaricus sp1.1 physiological states during batch culture.
Materials and methods
Bacterial strain and culture condition
The strain L. bulgaricus sp1.1 (CGMCC: 16586) was used in the present work [Citation25,Citation26]. The strain, which was stored in 20% (v/v) glycerol-de Man Rogosa Sharpe (MRS) broth at −20 °C, was pre-cultured in MRS broth (1:50, v/v) at 37 °C statically for 12–14 h twice prior to use. To determine the culturable L. bulgaricus sp1.1 cells, 1 ml cell suspensions were serial 10-fold diluted in sterilized 0.85% sodium chloride solution, then one millilitre of diluted cells in suitable dilution was poured into Petri dishes and mixed with MRS agar. Subsequently, the plates were incubated statically at 37 °C for 36–48 h, the colonies were manually counted and expressed as colony form-unit (CFU)·mL−1.
qPCR assay
The cell number was quantified by qPCR, primers of 5′-TACCAAGGCAATGATGCGTA-3′ (forward primer) and 5′-CATCAGACTTGCGTCCATTG-3′ (reverse primer) were designed to amplify a 123 bp fragment of the L. bulgaricus 16S rRNA gene. The total qPCR volume was 25 μL·reaction−1, including 10 μL of 2 × All-in-one™ qPCR Mix (GeneCopoeia), 2 μL of each 2 mM forward and reverse primers, 2 μL of the purified bacteria genomic DNA (supplement materials), 0.4 μL of ROX reference dye and 3.6 μL of ddH2O. The qPCR reaction was carried out in Applied Biosystems™ 7300 fast real-time PCR system (Thermo Fisher, Waltham, MA, USA): initial denaturation of DNA at 95 °C for 10 min; followed by 40 cycles of the denaturation for 10 s at 95 °C, annealing for 20 s at 55 °C and extension for 15 s at 72 °C; and melting curve analysis was performed immediately at end of cycling by gradually heating from 60 to 94 °C. Negative control with ddH2O was included in each qPCR reaction. Three biological replicates were performed.
Performance and calibration curves of qPCR in quantification
qPCR sensitivity and calibration curves
To evaluate the sensitivity of the qPCR assay, purified 16S rRNA plasmid standards were 10-fold serially diluted in ddH2O to final copy number ranging from 3.44 to 3.44 × 10⁸ copies·reaction−1. The cycle threshold (Ct) values were plotted against the logarithm of 16S rRNA gene copies, and the calibration curve was generated by linear regression of the plotted points. To determine the limit of detection (LOD) and standards for quantification, viable L. bulgaricus sp1.1 cells in OD600 of 0.6 (early exponential phase) were diluted and enumerated by qPCR and plate counts, respectively. The copy numbers were plotted against the viable cell density (log CFU·mL−1). The slope value of the liner curve was adopted to the equation of E = 10−1/slope-1 to calculate the amplification efficiency (E) [Citation19]. Three technical replicates were performed for each sample.
Construction of the 16S rRNA plasmid standard
To accurately quantify cell numbers, we constructed a plasmid standard of the 16S rRNA gene for calibration curve construction. The purified genome fragment containing the full length of the 16S rRNA gene (supplement materials) was inserted into the pMD™19-T vector system (Takara, Japan) following the manufacturer’s protocol. Escherichia coli (E. coli) DH5α competent cell (Takara, Japan) was transformed with the ligation mixture to give the 16S rRNA gene clone libraries. A blue/white screening on plates containing X-gal was carried out to select clones carrying inserted plasmid. About 10–15 white E. coli colonies were randomly picked from Luria-Bertani agar containing 100 μg·ml−1 of ampicillin (Solarbio, China), 100 μg·ml−1 of X-Gal (Solarbio, China), and 125 μg·ml−1 of isopropyl β-D-thiogalactoside (Solarbio, China), transferred into 10 ml Luria Bertani broth containing ampicillin (100 μg/ml) and shaking cultured at 37 °C overnight. Plasmid DNA purification was carried out using the Magnetic Plasmid Kit (Solarbio, China). The purified plasmids were verified by Sanger sequencing in Sangon Biotech. The numbers of copies·μL−1 of target 16S rRNA gene were calculated by the following equation [Citation27]:
n (copies) is the number of targets per DNA molecule (the target number is 1 in the standard plasmid), cDNA (ng·μL−1) is the concentration of purified plasmid DNA, NA is the Avogadro constant (6.022 × 10²³ molecules·mol−1), lDNA (bp) is the genome size, and the average molecular mass of a double-stranded DNA base pair (660 × 109 dalton·bp−1).
PMA treatment and validation procedure
PMA treatment of bacterial cells
PMA (Biotium) was dissolved by 20% dimethyl sulfoxide to prepare a stock concentration of 10 mM and stored at −20 °C protecting from light. PMA treatment was performed as described previously with modification [Citation28–30]. Briefly, the suitable concentrations of PMA were added to 1 ml of cell suspensions in 1.5 ml microcentrifuge tubes and thoroughly mixed before 5 min incubation in darkness at room temperature. Photoactivation of PMA binding to DNA was carried out under direct irradiation of a 500 W iodine-tungsten lamp for 15 min with occasional mixing, and the samples were laid horizontally on ice and placed about 20 cm from the light source. The bacterial cells were subsequently washed twice with PBS prior to genome DNA extraction.
Optimization of PMA concentration
Following cultured L. bulgaricus sp1.1 cell up to an OD600 of 0.8, cells were collected and washed. After suspended with PBS at 4 °C, two parts of cell suspension were withdrawn. One part of the cells were served as viable cells. The other one was incubated at 90 °C in a water bath for 3 min to generate heat-killed (non-viable) cells, the heat-killed cells were subjected to plate counting to verify all cells were dead. Subsequently, the above viable and non-viable cells were transferred to a series of microcentrifuge tubes in a 1 ml aliquot and treated with PMA in final concentrations of 0, 5, 10, 20, 30, 40, 50, 60, 80, and 100 μM, respectively. Genome DNA was extracted to performing the qPCR procedure, 0 μM of PMA was served as control. The Ct value was obtained to determine a suitable PMA concentration. Three biological replicates were performed.
Technical validation of PMA-qPCR
To investigate the potential ability of PMA-qPCR in distinguishing between the viable and non-viable cells, the viable cells were mixed with the heat-killed cells in defined ratios of 100, 50, 10, 1 and 0% in the total cell concentration of approximately 108 CFU·mL−1, respectively. Each mixture was treated with or without PMA (60 μM) and was subsequently evaluated using the qPCR procedure. The mixtures in the ratio of 100% and the ratio of 0% viable cells served as positive and negative controls, respectively. The ddH2O replace the template in qPCR served as blank control to detect background amplification. The results are the average of three independent assays with triplicates ± standard deviation.
To verify the ability of PMA-PCR in the quantification of the viable cells. The L. bulgaricus sp1.1 cells at lag and early-exponential phase were enumerated by PMA-qPCR and plate count. Three biological replicates were performed for the entire experiment.
Implementation and verification of molecular methods to quantify physiological states
Implementation of molecular methods
The qPCR, PMA-qPCR, and plate count methods were implemented to detect cell density during batch culture of L. bulgaricus sp1.1. The L. bulgaricus sp1.1 cells were grown in MRS broth at 37 °C statically. Bacterial cells at a time interval of 1 h (from 8 to 18 h) were collected by centrifugation at 6000 g for 5 min at 4 °C, and then subjected to plate counts, qPCR and PMA-qPCR procedures. Three biological replicates were carried out.
Verification of physiological states by flow cytometry
A 10 mM stock solution of 5-(and 6)-carboxyfluorescein diacetate (cFDA) was prepared by dissolving cFDA powder in dimethyl sulfoxide and stored at −20 °C in dark, and it was diluted to 1 mM before use. The stock solution of propidium iodide (PI) was prepared by dissolving PI in PBS and diluted to 1.5 mM as the working solution. L. bulgaricus sp1.1 cell collections were incubated with 25 μM of cFDA at 37 °C for 10 min for intracellular enzymatic conversion of cFDA to carboxyfluorescein. Cells were washed with PBS to remove excess cFDA, and then 7.5 μM of PI was added to the cells and incubated at 4 °C for 15 min to label the membrane damaged cells. All the experiments were performed in triplicate.
Analysis of the cell fluorescence was performed by Guava easyCyte™ flow cytometer (Merck Millipore) equipped with 488 nm laser in the following steps as described by Hildebrandt et al. [Citation31]. In brief, cFDA and PI double-stained L. bulgaricus sp1.1 cells were fixed in PBS containing 4% paraformaldehyde at 4 °C for 15 min in PBS. Cell concentration of each sample was adjusted to 106∼107 cells·mL−1 to accurate the measurements, unlabelled early-exponential cells were served as the negative control to eliminate cellular autofluorescence. Side scatter (SSC)-HLog against to forward scatter (FSC)-HLog dot plot was used to distinguish the bacterial cell from the background, the threshold was set to the green fluorescence. Data were recorded for 10,000 events and then gated in side scatter (FSC-H log) versus Green-B-HLog dot plot at a low flow rate. The dot plot of red fluorescence against to green fluorescence of gated events was analyzed by FlowJo software (version 10.0.7, FlowJo, LLC).
Statistical analysis
Analysis of data were performed by Microsoft Excel (Microsoft, Redmond, WA) and SPSS (IBM, Armonk, NY). One-way analysis of variance (ANOVA) was carried out to detect significant differences among means, and a t-test was performed to analyze the significance of the matched-pairs data. p<.05 was served as a significant difference.
Results and discussions
Performance and calibration curves of qPCR in quantification
In previous studies, the highly conserved target sequences in the Tu (tuf), pheS, or 16S rRNA gene were used to specifically detect Lactobacillus cells using qPCR [Citation19,Citation32,Citation33], due to the 16S rRNA gene is a component of prokaryotic ribosomes and contains a conserved and species-specific sequence, it has been used as a universal target gene in qPCR [Citation34]. The 16S rRNA gene was used as the target gene in qPCR and PMA-qPCR methods to quantify the L. bulgaricus sp1.1 cells in the present work. Seven serial dilutions of standard plasmids of the 16S rRNA gene from 3.44 × 10² to 3.44 × 10⁸ copies reaction−1 were detected using qPCR. The results indicated a good linear relationship between the cycle threshold (Ct) values and 16S rRNA gene copy number (R2=0.9998; ). Typically, qPCR amplification efficiencies should be as close to 1 as possible, further explaining the specificity of qPCR [Citation30]. The efficiency of amplification for the species-specific primers was 98.42% in this work, this ensured the accuracy of qPCR for quantifying L. bulgaricus sp1.1 DNA.
Figure 1. Calibration curve and performance of qPCR assay in quantification. (A) Calibration curve of Ct values and L. bulgaricus 16S rRNA gene copy number. (B) Relationship between L. bulgaricus 16S rRNA gene copy number and cell concentration for quantification.
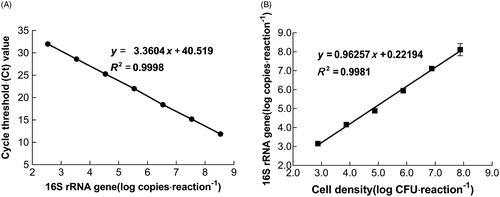
To determine the limit of detection (LOD) and standard of quantification, the 16S rRNA gene copy number was plotted against cell concentration. This resulted in a linear relationship between 16S rRNA copy number and cell concentration (R2 = .9981; ), and agreed with that the 16S rRNA content of bacterial cells is directly correlated with bacterial growth rates [Citation35], this suggested that the 16S rRNA gene of L. bulgaricus sp1.1 was suitable to be the standard for absolute quantification, and could accurately monitor the growth dynamics in the culture process. The LOD was considered as 15.1 CFU·mL−1·reaction−1 (defined as the lowest concentration of analytes that can be detected in PCR [Citation36]). A similar LOD of approximately 2 × 10² CFU mL−1 was obtained when Pseudomonas syringae pv.tomato [Citation23], L. gasseri and L. salivarius [Citation37] were quantified. The limits provide sufficient sensitivity of detection for the quantification of cells batch culture since counts of the bacterial cells should be higher. The linear relationship facilitated the direct conversion of the Ct value to CFU·mL−1 in qPCR, as 1 CFU is approximately 8.70 copies of the 16S rRNA gene (1.41 × 10³−1.30 × 10⁸ copies/1.51 × 102–1.51 × 10⁷ CFU; ). This was estimated as the copy number of the 16S rRNA gene of the L. bulgaricus sp1.1 complete genome, which ranged from 8 to 9 as obtained from the National Centre for Biotechnology Information BLAST (https://blast.ncbi.nlm.nih.gov/Blast). These results indicate that the qPCR method is efficient and sensitive, and allows accurate bacterial DNA quantification.
Optimization and technical validation of PMA-qPCR
Optimization of the final PMA concentration
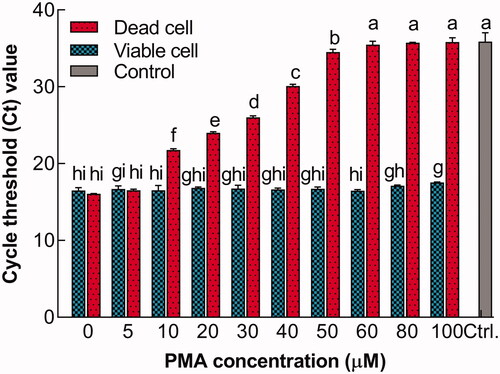
qPCR is routinely used to analyze pathogens, to quantify useful microorganisms, and to characterize the microbiota in food or fermented products [Citation28,Citation34,Citation38]. Nonetheless, this method cannot distinguish between the DNA of viable and membrane-compromised cells. For quantifying viable L. bulgaricus cells, PMA in combination with qPCR was used to overcome this drawback [Citation34]. It has been suggested that an adequate concentration of PMA but no cytotoxicity should be added when detecting the viable cells [Citation23,Citation39]. Accordingly, viable L. bulgaricus sp1.1 cells were treated with various PMA concentrations, following which the Ct values were obtained using qPCR assay (). The results showed that DNA derived from PMA-treated viable cells exhibited extremely high signals (low Ct value); moreover, no significant difference (p>.1) in Ct values was observed at lower concentrations (<80 μM). This finding is consistent with the results that higher PMA concentrations result in the decreased DNA detection from live microorganisms, thereby causing an underestimation of the viable cell number in qPCR [Citation40]. Reportedly, PMA-qPCR-positive viable L. bulgaricus cells were high when PMA concentration was <30 μg·mL−1 (approximately 58.7 μM); the intact cell membrane served as an efficient barrier for PMA and protected viable L. bulgaricus cells from cytotoxicity to some extent [Citation34]. For dead cell suspensions, a positive signal was observed in the concentration of 0–5 μM PMA. When the dead cells were subjected to a PMA concentration of 10 μM or higher, the Ct values were almost the same with the negative control and remained constant, DNA amplification derived from nonviable cells was completely inhibited (p<.05). Previous works suggested that the DNA from the dead Lactobacillus cell can be selective removed when the concentration of PMA was 30 μM or higher [Citation41,Citation42]. Accordingly, the concentration of PMA required to fully suppress amplification of dead cells and simultaneously had no effect on qPCR of living cells was selected to be 60 μM.
Figure 2. Relationship between Ct value and PMA concentration. Bars with different letters indicated significant differences (p<.05).
Technical validation of PMA-qPCR in the discrimination of viable cells
For the technical validation of the PMA-qPCR method, predefined viability ratios of L. bulgaricus sp1.1 cells were assessed in 2.03 × 10⁸ ± 1.53 × 10⁷ CFU mL−1 (). The results showed that Ct values from all premixed cells without PMA treatment were similar (p>.1); however, qPCR failed to reflect the actual number of viable cells in the cell mixtures. In contrast, when PMA treatment was introduced, there was a significant difference was observed in the qPCR signal compared with non-PMA-treated cells (p<.05). These data demonstrated that the Ct values of the cell mixtures preferentially reflected the amount of DNA in the viable cells in the mixtures amplified during qPCR.
Figure 3. Technical validation of PMA-qPCR in the discrimination of viable L. bulgaricus sp1.1 cells. (A) Discrimination of viable L. bulgaricus sp1.1 cells from viable/nonviable cell mixtures by PMA-qPCR. The cells were treated with PMA (w PMA) or without PMA (w/o PMA). (B) Viable cell density quantified by PMA-qPCR and plate count. Bars or dot plots with different letters indicated significant differences (p<.05).
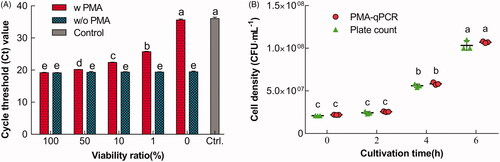
Furthermore, to compare the viable L. bulgaricus cell density detected using PMA-qPCR and plate counts, cells in the lag and early-exponential phase were analyzed. The results showed that the viable cell density detected using PMA-qPCR was consistent with that obtained using plate count (p>.1; ), implying a close correlation relationship between the viable cells detected using both methods. The PMA-qPCR method could accurately identify and quantify viable L. delbrueckii spp. bulgaricus sp1.1 cells.
Implementation and verification of molecular methods to quantify physiological states
Implementation of qPCR and PMA-qPCR methods to quantify physiological states
To determine L. bulgaricus sp1.1 cell growth dynamics, qPCR and PMA-qPCR methods were implemented to detect cell density during batch culture, results show in . In theory, cell density enumerated using the qPCR method represents the total cells obtained by assessing the total cell pellet [Citation43]. However, the total cell density drastically dropped after 11 h (), thereby suggesting that cell lysis during culture. To confirm this, cell-free DNA was recovered from the supernatant and quantified using qPCR. Moreover, the extracellular cytosolic enzyme lactate dehydrogenase (LDH) was used to assess cell lysis [Citation44]. A large amount of cell-free DNA and an increase in LDH activity (, Figure S1) suggested that bacterial cell lysis was occurring throughout the growth [Citation45]. However, there was a discrepancy between the lysed cell density at the decline phase (after 13 h, <1 × 10⁴ CFU mL−1) and the late-exponential phase (before 11 h, >5 × 10⁴ CFU mL−1). This can be attributable to the availability of the DNA for digestion by bacterial nucleases upon its release into the medium (Figure S2) or degradation in other physiological conditions [Citation46]. Moreover, it may be attached to the cell surface [Citation47]. Therefore, the detectable free DNA served as partially lysed cells, and we propose that qPCR is unsuitable to detect lysed cells.
Figure 4. Time distribution of L. bulgaricus sp1.1 cell density and physiological states throughout the course of batch culture. Quantification of (A) unlysed, (C) viable, and (E) culturable L. bulgaricus sp1.1 cells by qPCR, PMA-qPCR, and plate count, respectively. (B) Cell-free DNA was enumerated by qPCR and represents detectable lysed cells. (D) Permeabilized cells were the difference between unlysed and viable cells. (F) Possible dormant-like cells were the difference between viable and culturable cells. (G) Classification of the cellular states in the present work. The insets in (A) and (F) show the optical photomicrographs of unlysed and lysed cells treated with Gram staining. The insets in (B) and (C) show the fluorescence photomicrographs, indicating the viable (green) and permeabilized (red or merged green and red) cells at the end of the exponential phase fermentation after staining with cFDA and PI. The inset in (D) shows the colonies of culturable cells in a Petri dish.
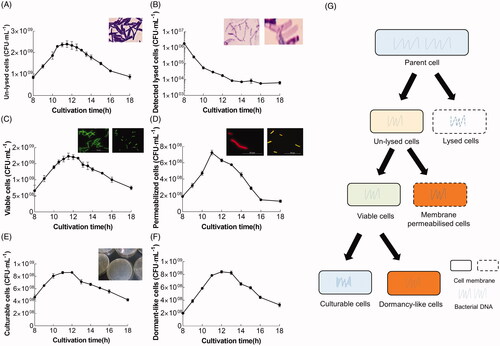
Because PMA could eliminate the DNA from membrane-permeabilized and lysed cells during qPCR, the cell density difference between qPCR () and PMA-qPCR () indicated that a subpopulation of membrane-permeabilized cells existed in the batch culture. Cell membrane permeability was visible during the late-exponential phase (8–9 h; ). This result is consistent with the previous results, the authors used PI staining to distinguish the appearance of membrane-permeable cells [Citation48]. It was demonstrated that the subpopulation of membrane-damaged cells appeared with acidification to a certain pH, particularly, cells in the exponential phase were more sensitive than those in the stationary phase [Citation26]. This may be caused by the maladaptive imbalance in the process of synthesis and hydrolysis of peptidoglycan [Citation49].
Comparison of physiological states detected using qPCR, PMA-qPCR, and conventional assay
To comprehensively analyze the physiological states, viable cells assessed using PMA-qPCR () and plate counts () were compared during L. bulgaricus sp1.1 batch culture. A comparison of the qPCR with the plate counting method for the absolute quantification of bacterial cells showed that both methods are advisable [Citation14]. Furthermore, it was proven that there was no misestimation of viable cells because the cell number enumerated by using PMA-qPCR was consistent with plate counts (). Nonetheless, the cell number difference enumerated using both methods was observed (). Overestimation by PMA-qPCR indicated that some cells were viable with the intact membrane but were unable to form colonies and considered dormant-like. However, it has been suggested that the differences are most probably due to cell chain formation, which strongly confounds accurate plate count CFU enumeration, rather than due to these cells entering a dormant-like state [Citation19]. We confirmed that the bacterial cells exhibited a non-chain morphology after the late-exponential phase using fluorescence microscopy (, right inset). Furthermore, several researchers [Citation50,Citation51] indicated the qPCR protocol can detect dormant-like cells when the qPCR counts matched the amount of the live inoculum. Therefore, the difference between the PMA-qPCR and plate count enumeration implied that part of the viable cells became nonculturable and likely included dormant (or VBNC) cells [Citation39,Citation52]. The dormant-like subpopulation detected in L. bulgaricus culture may be due to heat, cold, starvation, or acidification [Citation53,Citation54]. Accordingly, the detection of dormant-like L. bulgaricus sp1.1 cells (induced by starvation and low temperature) using plate counts and PMA-qPCR indicated that PMA-qPCR could effectively discriminate and quantify these cells in pure L. bulgaricus sp1.1 culture in combination with plate count ( and ). Because dormant-like cells have intact membranes and retain their nucleotide constituents, proton motive force, and metabolic activities [Citation52], they could be identified using double staining (PI and cFDA) coupled with FCM after calibration with standard CFU counts.
In a word, the complexity of subpopulations of L. bulgaricus sp1.1 cell during batch culture could be shown as the resulting different cellular states. The lysed and unlysed cells were identified from the total population, and the unlysed cells comprised viable and membrane-permeabilized cells. The viable cells comprised culturable and dormant-like cells. These suggested that six subpopulations could be identified and quantified using molecular methods combined with culture-dependent assay ().
Verification of physiological states
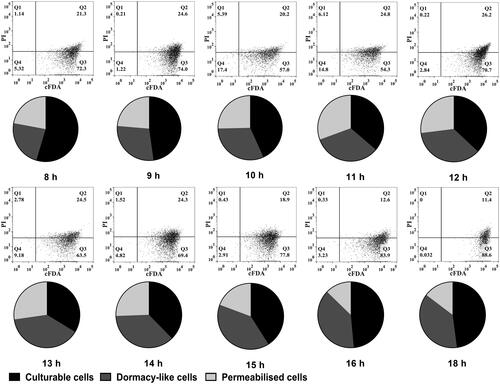
To verify the physiological states, qPCR and PMA-qPCR were compared with the FCM method following double staining (PI and cFDA). The subpopulations were identified based on the different PI and cFDA staining characteristics and are shown in different quadrants in the dot-plot graphs (). cFDA-negative/PI-positive cells (Q1) correspond to cells with inactivated esterase (nonviable) and permeabilized membranes; double-positive cells (Q2) represent viable cells with permeabilized membranes; cFDA-positive/PI-negative cells (Q3) were viable cells with intact membranes, and double-negative cells (Q4) most likely correspond to cell debris [Citation55]. The dual-parameter dot plots shown in indicates the existence of two main subpopulations and exhibits dynamic changes in culture. Approximately 11.4–30.92% of L. bulgaricus sp1.1 cells were membrane-permeabilized (Q1 + Q2), and although viable cells (Q3) were changed and accounted for 72.3–54.3% of the total population before 11 h, they increased from 70.7 to 88.6%. In comparison, the relative abundance of membrane-permeabilized and viable cells (culturable + dormant-like) quantified using qPCR and PMA-qPCR were consistent with that using FCM (pie chart in ), indicating that qPCR and PMA-qPCR are useful techniques to effectively quantify the bacterial physiological states.
Figure 5. Composition of L. bulgaricus cellular states during batch culture identified by FCM and molecular methods. Dot plots are L. bulgaricus sp1.1 cells double-stained with cFDA and PI. Every pie sector corresponds to permeabilized and viable (including culturable and dormant-like) cells. The relative abundance is the relative proportion of each state in total unlysed cells.
Typically, bacterial cells in culture are considered homogeneous. However, bacteria switch to the nonuniform population during adaptation to stress and respond to unfavourable conditions with changes in gene expression patterns [Citation53]. This results in culture heterogeneities that have been evidenced at the single-cell level, and physiological heterogeneity is considered an inherent feature of bacterial growth and behaviour [Citation56]. The viable and membrane-damaged L. bulgaricus cells were well identified using FCM [Citation52]. However, the major disadvantage of this methodology is the limitation of quantification [Citation15]. More physiological states in bacterial cultures were identified and quantified using molecular methods in the present study. Although the finding of heterogeneity in pure culture is common, population complexity and quantification of physiological heterogeneity in culture processes are rarely reported.
Conclusions
It is well known that the culture-dependent analysis of microbial population in bioprocess generates partial and heavily biased results. The present work aimed at investigating the population heterogeneity of L. bulgaricus sp1.1 in batch processes applying the molecular methods such as PMA-qPCR and qPCR combined with plate count. The technical verification and implementation of these methods showed that these methods could discriminate and quantify heterogeneous populations quickly and accurately. The population of L. bulgaricus sp1.1 cells in batch growth of were composed of lysed cells, permeabilized, culturable and dormant-like cells. However, lysed cells were not well quantified because of the limitation of the qPCR method to detect digested DNA. Consequently, the combination of qPCR and PMA-qPCR is a sensible approach to increase the knowledge of population heterogeneity during batch culture with L. bulgaricus sp1.1. Further studies considering the prevention of cell permeability and lysis and the activation of dormant-like cells are required.
Ethical approval
This article does not contain any studies with human participants or animals performed by any of the authors.
Revised-supporting_information.docx
Download MS Word (991.8 KB)Disclosure statement
No potential conflict of interest was reported by the author(s).
Correction Statement
This article has been republished with minor changes. These changes do not impact the academic content of the article.
Additional information
Funding
Related Research Data
References
- Quin C, Estaki M, Vollman DM, et al. Probiotic supplementation and associated infant gut microbiome and health: a cautionary retrospective clinical comparison. Sci Rep. 2018;8(1):8283–8283.
- Kang M-S, Yeu J-E, Hong S-P. Safety evaluation of oral care probiotics Weissella cibaria CMU and CMS1 by phenotypic and genotypic analysis. IJMS. 2019;20(11):2693.
- Chen H, Tian M, Chen L, et al. Optimization of composite cryoprotectant for freeze-drying Bifidobacterium bifidum BB01 by response surface methodology. Artif Cells Nanomed Biotechnol. 2019;47(1):1559–1569.
- Heins A-L, Reyelt J, Schmidt M, et al. Development and characterization of Escherichia coli triple reporter strains for investigation of population heterogeneity in bioprocesses. Microb Cell Fact. 2020;19(1):14.
- Hatzenpichler R, Krukenberg V, Spietz RL, et al. Next-generation physiology approaches to study microbiome function at single cell level. Nat Rev Microbiol. 2020;18(4):241–256.
- Schreiber F, Ackermann M. Environmental drivers of metabolic heterogeneity in clonal microbial populations. Curr Opin Biotechnol. 2020;62:202–211.
- Iqbal UH, Westfall S, Prakash S. Novel microencapsulated probiotic blend for use in metabolic syndrome: design and in-vivo analysis. Artif Cells Nanomed Biotechnol. 2018;46(sup3):S116–S124.
- Calabrese F, Voloshynoyska I, Musat F, et al. Quantitation and comparison of phenotypic heterogeneity among single cells of monoclonal microbial populations. Front Microbiol. 2019;10(2814):
- Schaechter M. A brief history of bacterial growth physiology. Front Microbiol. 2015;6:289.
- Zhong Q, Tian J, Wang B, et al. PMA based real-time fluorescent LAMP for detection of Vibrio parahaemolyticus in viable but nonculturable state. Food Control. 2016;63:230–238.
- Lv X, Wang L, Zhang J, et al. Rapid and sensitive detection of VBNC Escherichia coli O157: H7 in beef by PMAxx and real-time LAMP. Food Control. 2020;115:107292.
- Parbhoo T, Sampson SL, Mouton JM. Recent developments in the application of flow cytometry to advance our understanding of Mycobacterium tuberculosis physiology and pathogenesis. Cytometry A. 2020;97(7):683–693.
- Zhang Y, Delbruck AI, Off CL, et al. Flow cytometry combined with single cell sorting to study heterogeneous germination of Bacillus spores under high pressure. Front Microbiol. 2020;10(3118):
- Roussel C, Galia W, Leriche F, et al. Comparison of conventional plating, PMA-qPCR, and flow cytometry for the determination of viable enterotoxigenic Escherichia coli along a gastrointestinal in vitro model. Appl Microbiol Biotechnol. 2018;102(22):9793–9802.
- Braun RS, Mendis N, Li L, et al. Quantification of viable but non-culturable cells of Legionella pneumophila. Methods Mol Biol. 2019;1921:45–53.
- Heins A-L, Weuster-Botz D. Population heterogeneity in microbial bioprocesses: origin, analysis, mechanisms, and future perspectives. Bioprocess Biosyst Eng. 2018;41(7):889–916.
- Möller J, Rosenberg M, Riecken K, et al. Quantification of the dynamics of population heterogeneities in CHO cultures with stably integrated fluorescent markers. Anal Bioanal Chem. 2020;412(9):2065–2080.
- Heins A-L, Lundin L, Nunes I, et al. The effect of acetate on population heterogeneity in different cellular characteristics of Escherichia coli in aerobic batch cultures. Biotechnol Prog. 2019;35(3):e2796.
- Moser A, Berthoud H, Eugster E, et al. Detection and enumeration of Lactobacillus helveticus in dairy products. Int Dairy J. 2017;68:52–59.
- Jeong S-G, Lee JY, Yoon S-R, et al. A quantitative PCR based method using propidium monoazide for specific and sensitive detection of Pectobacterium carotovorum ssp. carotovorum in kimchi cabbage (Brassica rapa L. subsp. pekinensis). Lwt-Food Sci Technol. 2019;113:108327.
- Verruck S, Silva KJ, de Oliveira Santeli H, et al. Bifidobacterium animalis ssp. lactis BB-12 enumeration by quantitative PCR assay in microcapsules with full-fat goat milk and inulin-type fructans. Food Res Int. 2020;133:109131.
- Han L, Wang K, Ma L, et al. Viable but nonculturable Escherichia coli O157:H7 and Salmonella enterica in fresh produce: rapid determination by loop-mediated isothermal amplification coupled with a propidium monoazide treatment. Appl Environ Microbiol. 2020;86(7):e02566–19.
- Chai AL, Ben H-Y, Guo W-T, et al. Quantification of viable cells of Pseudomonas syringae pv. tomato in tomato seed using propidium monoazide and a real-time pcr assay. Plant Dis. 2020;PDIS11192397RE.
- Truchado P, Gil MI, Larrosa M, et al. Detection and quantification methods for viable but non-culturable (VBNC) cells in process wash water of fresh-cut produce: industrial validation. Front Microbiol. 2020;11:673.
- Gong P, Zhang L, Zhang J, et al. Sampling method for studying the activity of lactic acid bacteria during spray drying. Drying Technol. 2018;36(10):1236–1242.
- Chen S, Gong P, Zhang J, et al. Quantitative analysis of Lactobacillus delbrueckii subsp. bulgaricus cell division and death using fluorescent dye tracking. J Microbiol Methods. 2020;169:105832.
- Achilleos C, Berthier F. Quantitative PCR for the specific quantification of Lactococcus lactis and Lactobacillus paracasei and its interest for Lactococcus lactis in cheese samples. Food Microbiol. 2013;36(2):286–295.
- Zhang Z, Liu W, Xu H, et al. Propidium monoazide combined with real-time PCR for selective detection of viable Staphylococcus aureus in milk powder and meat products. J Dairy Sci. 2015;98(3):1625–1633.
- Dias CO, Scariot MC, de Mello Castanho Amboni RD, et al. Application of propidium monoazide coupled with quantitative PCR to evaluate cell viability of Bifidobacterium animalis subsp. lactis in a non-dairy probiotic beverage. Ann Microbiol. 2020;70(1):22.
- da Cunha ET, Pedrolo AM, Paludo F, et al. Azospirillum brasilense viable cells enumeration using propidium monoazide-quantitative PCR. Arch Microbiol. 2020;202(7):1653–1662.
- Hildebrandt P, Surmann K, Salazar MG, et al. Alternative fluorescent labeling strategies for characterizing gram-positive pathogenic bacteria: flow cytometry supported counting, sorting, and proteome analysis of Staphylococcus aureus retrieved from infected host cells. Cytometry A. 2016;89(10):932–940.
- Klocke M, Mundt K, Idler C, et al. Monitoring Lactobacillus plantarum in grass silages with the aid of 16S rDNA-based quantitative real-time PCR assays. Syst Appl Microbiol. 2006;29(1):49–58.
- Scariot MC, Venturelli GL, Prudêncio ES, et al. Quantification of Lactobacillus paracasei viable cells in probiotic yoghurt by propidium monoazide combined with quantitative PCR. Int J Food Microbiol. 2018;264:1–7.
- Shao Y, Wang Z, Bao Q, et al. Application of propidium monoazide quantitative real-time PCR to quantify the viability of Lactobacillus delbrueckii ssp bulgaricus. J Dairy Sci. 2016;99(12):9570–9580.
- Barer MR. Bacterial growth, culturability and viability. In: Tang Y-W, Liu D, Poxton I, Schwartzman J, editors. Molecular medical microbiology. Vol. 1. 2nd ed. USA: Academic Press; 2015. p. 181–199.
- Kim S-Y, Kim M-J, Jung S-K, et al. Development of a fast real-time PCR assay based on TaqMan probe for identification of edible rice grasshopper (Oxya chinensis) in processed food products. Food Res Int. 2019;116:441–446.
- Lai C-H, Wu S-R, Pang J-C, et al. Designing primers and evaluation of the efficiency of propidium monoazide – quantitative polymerase chain reaction for counting the viable cells of Lactobacillus gasseri and Lactobacillus salivarius. J Food Drug Anal. 2017;25(3):533–542.
- Agrimonti C, Bottari B, Sardaro MLS, et al. Application of real-time PCR (qPCR) for characterization of microbial populations and type of milk in dairy food products. Crit Rev Food Sci Nutr. 2019;59(3):423–442.
- Ruike W, Higashimori A, Yaguchi J, et al. Use of real-time PCR with propidium monoazide for enumeration of viable Escherichia coli in anaerobic digestion. Water Sci Technol. 2016;74(5):1243–1254.
- Lv XC, Li Y, Qiu WW, et al. Development of propidium monoazide combined with real-time quantitative PCR (PMA-qPCR) assays to quantify viable dominant microorganisms responsible for the traditional brewing of Hong Qu glutinous rice wine. Food Control. 2016;66:69–78.
- Nocker A, Cheung C-Y, Camper AK. Comparison of propidium monoazide with ethidium monoazide for differentiation of live vs. dead bacteria by selective removal of DNA from dead cells. J Microbiol Methods. 2006;67(2):310–320.
- Gobert G, Cotillard A, Fourmestraux C, et al. Droplet digital PCR improves absolute quantification of viable lactic acid bacteria in faecal samples. J Microbiol Methods. 2018;148:64–73.
- Faille C, Brauge T, Leleu G, et al. Comparison of the performance of the biofilm sampling methods (swab, sponge, contact agar) in the recovery of Listeria monocytogenes populations considering the seafood environment conditions. Int J Food Microbiol. 2020;325:108626.
- Diop M, Watier D, Masson PY, et al. Assessment of freshness and freeze-thawing of sea bream fillets (Sparus aurata) by a cytosolic enzyme: lactate dehydrogenase. Food Chem. 2016;210:428–434.
- Maier RM, Pepper IL, Gentry TJ. Bacterial growth. Environmental Microbiology. 3rd ed. New York: Academic Press; 2014. p. 37–54.
- Yao W, Mei C, Nan X, et al. Evaluation and comparison of in vitro degradation kinetics of DNA in serum, urine and saliva: a qualitative study. Gene. 2016;590(1):142–148.
- Castan A, Heidrich J, Enfors SO. The use of flow cytometry to detect nucleic acids attached to the surface of Escherichia coli in high cell density fed-batch processes. Biotechnol Lett. 2002;24(3):219–224.
- Hansen G, Johansen CL, Marten G, et al. Influence of extracellular pH on growth, viability, cell size, acidification activity, and intracellular pH of Lactococcus lactis in batch fermentations. Appl Microbiol Biotechnol. 2016;100(13):5965–5976.
- Lewis K. Programmed death in bacteria. Microbiol Mol Biol Rev. 2000;64(3):503–514.
- Mangiaterra G, Amiri M, Di Cesare A, et al. Detection of viable but non-culturable Pseudomonas aeruginosa in cystic fibrosis by qPCR: a validation study. BMC Infect Dis. 2018;18(1):701.
- Pan H, Dong K, Rao L, et al. Quantitative detection of viable but nonculturable state Escherichia coli O157:H7 by ddPCR combined with propidium monoazide. Food Control. 2020;112:107140.
- Rault A, Bouix M, Beal C. Dynamic analysis of Lactobacillus delbrueckii subsp bulgaricus CFL1 physiological characteristics during fermentation. Appl Microbiol Biotechnol. 2008;81(3):559–570.
- Ryall B, Eydallin G, Ferenci T. Culture history and population heterogeneity as determinants of bacterial adaptation: the adaptomics of a single environmental transition. Microbiol Mol Biol Rev. 2012;76(3):597–625.
- Golod NA, Loiko NG, Mulyukin AL, et al. Adaptation of lactic acid bacteria to unfavorable growth conditions. Microbiology. 2009;78(3):280–289.
- Li J, Suo Y, Liao X, et al. Analysis of Staphylococcus aureus cell viability, sublethal injury and death induced by synergistic combination of ultrasound and mild heat. Ultrason Sonochem. 2017;39:101–110.
- Want A, Hancocks H, Thomas CR, et al. Multi-parameter flow cytometry and cell sorting reveal extensive physiological heterogeneity in Bacillus cereus batch cultures. Biotechnol Lett. 2011;33(7):1395–1405.