
Abstract
This research is focussed to quantify IGF1 by electroanalytical analysis on InterDigitated electrode surface and characterized by the microscopic observations. For the detection, antibody and aptamer were used to analyze the level of IGF1. The sandwich pattern (aptamer-IGF1-antibody) was designed on the chemically modified IDE surface and reached the limit of detection to 10 fM with 100 folds enhancement in the sensitivity. Different control experiments (absence of IGF1, binding with IGF2 and with non-complementary aptamer) were failed to show the current changes, discriminated the specific detection. A good detection strategy is to complement the currently following imaging systems for AAA.
Introduction
Abdominal Aortic Aneurysms (AAA) is a progressive multifactorial disease, occurring with 9% of adults aged at ∼65 [Citation1–3]. AAA has been recognized when the abdomen aorta wall distension or bulge due to the weakness of the aorta wall. Smoking found as one of the main reasons for AAA, and other reasons are blood pressure and atherosclerosis [Citation4–6]. When AAA becomes the size of 5.5 cm and more, it ruptures even at the normal blood pressure level. This rupture leads the excess bleeding or haemorrhage and can be fatal. Since the rupture is asymptomatic, the current imaging analyses such as magnetic resonance imaging, computed tomography, and ultrasound are not enough to confirm the occurrence of AAA before being at the ruptured stage. It makes to follow the continuous screening using biological markers at the older age in order to diagnose AAA and the condition [Citation7]. Different biological mechanisms are correlated with AAA and the associated progress for rupturing [Citation8]. Along with imaging, researches are focussing on the blood-based biomarker to diagnose and identify the condition of AAA. Identifying the right biological marker helps to target the diagnosis of AAA and analyze its size. Insulin like growth factor-1 (IGF1) was found as the suitable biomarker for AAA. [Citation9] have conducted the research to identify the role of IGF1 with AAA, and found that in serum level of IGF1 was positively correlated with the size and growth of AAA. Identifying the level of IGF1 helps to predict the size of AAA and helps to prevent the surgery. In addition, in an older men, higher level of IGF1 has been found to be associated with AAA [Citation10]. Various researchers confirmed the positive correlation of with the level of IGF1 for the identification of AAA and its sizes [Citation11,12]. In this research, the biomarker IGF1 was identified on the aptamer-immobilized InterDigitated electrode (IDE) and sandwiched by the appropriate antibody for the detection molecule.
Affinity of detection molecule with target plays a major role for measuring the lower level of target detection [Citation13,Citation14]. This research uses aptamer as the capturing probe and antibody as the detection probe to detect IGF1 at its lower level. Antibody is a well-known detection molecule efficiently used with various Immunosensing systems, such as Enzyme Linked Immunosorbent Assay, Western blot, Surface plasmon analysis, Waveguide-mode sensor and RAMAN spectroscopy [Citation15–18]. Due to the higher stability in biological fluid, antibodies are used to detect the analytes in the body fluid, which includes saliva, serum, and sweat. On the other hand, aptamer is known as an artificial antibody developed from the DNA randomized library by involving three major steps, which are binding with target, separation of bound and unbound and amplification of bound molecule [Citation19–23]. Since the selected aptamers having proof of higher binding affinity than antibody to its target molecule, research are focussing to utilize the aptamer in various fields, including biosensor [Citation24,Citation25]. Antibodies and aptamers are having their specific positive features and both have different binding sites with their target molecule. In this context, sandwich detection strategy with aptamer and antibody can be possible to enhance the target detection [Citation26]. In the sandwich detection aptamer and antibody both can work as either capture or detection molecule, but in general high affinity capture molecule improves the detection of target molecule. Since aptamers having more binding affinity at several instances with its target, here aptamer was used as the capture probe, while antibody was used as the detection probe for detecting IGF1 on IDE sensing surface.
IDE is the amperometric based sensor, found as the promising tool due to its simple, rapid, user-friendly, portable and multiple detections. In particular IDE is more attractive due to its miniature size. IDE operates with the electric field penetration, and make them sensitive with the changes on the surface. IDE is a dielectric system forming a uniformly arranged gaps and fingers with the desired sizes. The optimized gap regions and layer depositions on IDE have found to enhance the performance of sensor, especially with the sensitivity. In addition, the suitability of oxide materials followed by the appropriate surface functionalization promotes the sensing behaviour. With this proper arrangement IDE based dielectrode sensor operates by the mechanism of dipole moment upon the attaching or interacting the molecule(s) on the surface. In addition, IDE surface is completely exposed to the open measurement and faster [Citation27,28]. IDE sensor has been used to detect a wide range of molecules, which includes DNA, antibody and aptamer at their lower level. The current study is preferred to utilize IDE sensor for detecting the level of IGF1 by using aptamer and antibody sandwich pattern.
Materials and methods
Reagents and biomolecules
IGF1, IGF2 Anti-IGF1 were procured from Sino Biological (China). Al-coil, Phosphate buffered saline (PBS). Al-etching solution, and 1,1′-Carbonyldiimidazole (CDI) and human serum were acquired from Sigma-Aldrich (USA). Ethanolamine was received from Fisher Scientific (UK). Biotinylated-aptamer for IGF1 detection was synthesized and received from the local supplier. The original aptamer sequence (5′-ATACGGGAGCCAACACCAGATGCGAGGACGGTGGGTGGGAGGGTGGAGGTCTCGAGAGCAGGTGTGACGGAT-3′) was adopted from the earlier report [Citation29]. For the control experiment, the non-complementary sequences of the aptamer (5′-TATGCCCTCGGTTGTGGTCTACGCTCCTGCCACCCACCCTCCCACCTCCAGAGCTCTCGTCCACACTGCCTA-3′) were prepared. Silica wafer was received from Mallinckrodt Baker (USA). Resist developer and positive photoresist were purchased from Futurrex Inc. (USA).
IDE sensing surface fabrication
IDE sensor was fabricated by wet etching method as described previously [Citation21]. In the first step on the silicon wafer, IDE electrode was printed. For that the first the positive photo resist was coated on the silicon wafer surface and backed for 90 s. Then the pattern was transformed to the surface, and UV (Ultra-Violet) light was exposed on the surface for 10 s. Followed by developing on the surface for 15 s by using the RD-6 developer and again backed for 110°C to remove the excess moisture and the adhesion between the silica and silver layer. At last, the silver etchant process was carried out for 23 s to clear the unexposed portion. Further the necessary chemical functionalization was performed to immobilize the biomolecule on the fabricated IDE electrode. The surface was characterized by the microscopic assessments as described by Letchumanan et al [Citation21,27].
Immobilization of aptamer on IDE sensor surface
Specific aptamer for IGF1 was immobilized on IDE sensor surface by using biotin-streptavidin linker. Initially to immobilize the streptavidin on IDE surface, CDI chemical linker was used. For that, 0.5 M of CDI was added on IDE and kept for 1 h at room temperature (RT). The surface thoroughly with distilled water, to eliminate the excess CDI, 200 nM of diluted 5 µL of streptavidin was dropped and kept for 1 h. Then the surface was washed with PBS buffer, and the excess surfaces were masked by 1 M of diluted ethanolamine for 1 h to get improved signal to noise ratio. Finally, 1 M of diluted biotinylated aptamer was dropped on streptavidin modified IDE surface and kept for 30 min at RT to allow the binding of biotin with the tetravalent streptavidin. This surface was utilized to identify and quantify IGF1 level. The changes of current were recorded after each immobilization process for comparison.
Detection of IGF1 on aptamer-IDE sensor: electroanalytical analysis
IGF1 detection was analyzed by aptamer-IDE surfaces. For that, IGF1 concentration with 1 nM was dropped on the biotinylated-aptamer surface. The changes in current level were recorded after wash the surface with PBS buffer. A linear sweep voltage with 0 to 2 V at 0.01 V step voltage were used for the measurements by ammeter and parameters were followed as shown in the earlier report [Citation27].
Limit of detection of IGF1 by aptamer interaction
Detection limit of IGF1 was estimated by carrying the experiment with different concentrations of IGF1 interaction with aptamer. For this experiment, IGF1 concentrations are from 10 fM to 1 nM with ten order dilutions made and added on aptamer surfaces individually and kept for 30 min. Washed the sensor surface with PBS buffer and measured the current changes before and after the immobilization of IGF1. The differences in the current were plotted in excel to calculate detection limit.
Aptamer-IGF1-antibody sandwich detection
To improve the detection, aptamer-IGF1-antibody sandwich was analyzed on IDE sensor. For that, on the aptamer-IGF1 interacted surface, 200 nM of anti-IGF1 antibody was dropped and kept 30 min. Washed the sensor surface with PBS and tested the changes in current level before and after the immobilization of anti-IGF1 antibody. The values from the differences in the current levels were plotted in excel sheet for calculating the interaction of IGF1 and antibody.
Selective detection of IGF1
IGF1selective detection was analyzed with three different type of control biomolecules, namely, (i) non-complementary aptamer sequence instead of aptamer, (ii) with control protein (IGF2) instead of IGF1, (iii) the surface without aptamer. These three control biomolecules were compared with the IGF1 specific detection with aptamer.
Detection of IGF1 from human serum
IGF1 was also detected from human serum, for that diluted human serum from 1:1280 to 1:80 by two order dilutions and added independently on the aptamer modified IDE sensor, followed by sandwiched with 200 nM of antibody. The changes of current were calculated for each experiment and compared.
Results and discussion
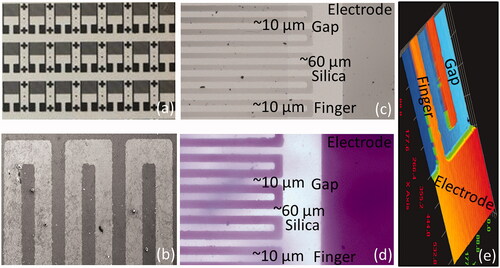
Abdominal Aortic Aneurysms (AAA) has been identified by the chronic inflammation occurs in the area of abdomen aorta of human, especially at the age of 60 or older. Smoking and hypertension were found to be the main causes of AAA [Citation30]. The rupture or breaking down of AAA causes the heavy bleeding and it can be fatal. The sizes of 5.5 cm or more are considered as the larger AAA and need to be repaired [Citation6,31]. Until now, imaging such as computed tomography (CT), ultrasound, and magnetic resonance imaging (MRI) were performed to diagnose AAA [Citation32]. In general AAA do not show any symptom until it become serious, so that along with the imaging a regular screening on AAA biomarkers helps to identify and treat AAA easily. Moreover, biomarkers also help to monitor the progression of treatment with AAA. In this research, IGF1, a biomarker for AAA was detected by its aptamer on IDE sensor. Additionally, to improve the detection, aptamer-IGF1-antibody was also carried out on IDE surface to diagnose AAA. Before being go for the biomolecular assembly and interaction, the surface uniformity and intactness were morphologically confirmed by high power, scanning electron microscope and 3D-nanoprofiler imaging analyses (). This study primarily aims to generate an alternate method over sensitive fluorescence and bioluminescence detections. To fulfil this notion, low current levels have been used at narrow sweep current intervals. Further, the optimal gap size was desired at 10 µm, further the sandwich pattern enhanced the sensitivity. Current study uses alternate strategy instead of impedance to quantify the specific binding of IGF-1 on the probed surface. The system operates based on the dipole moment of dielectrodes with the attachment/interaction of molecules [Citation27].
Figure 1. Surface morphology analysis on IDE. (a) Basic mask design of IDE; (b) SEM image; (c) High-power microscopy image; (d) Normal image under 3D-nanoprofiler; (e) 3D-image under 3D-nanoprofiler.
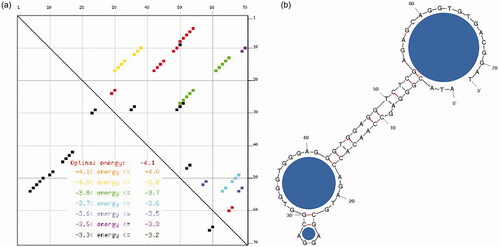
is the schematic presentation of IGF1 detection by sandwich pattern of aptamer-IGF1-antibody on IDE sensor. Since it was proved that biomolecule, especially DNA immobilization on sensing surface through biotin-streptavidin strategy improves the high number capture probe immobilization with the proper arrangement, this study used the similar strategy to immobilize the biotin on IDE surface [Citation28,33]. Streptavidin was immobilized on IDE surface through CDI chemical linker and then biotinylated aptamer was interacted and the surface was used to detect IGF1. Aptamer and antibody can have different binding sites on the single target and improves the detection. In the current study, IGF1 was sandwich patterned between aptamer and antibody [Citation26]. In most of the sandwich-based analysis, polyclonal antibody has been used as the capture probe and monoclonal antibody used as the detection probe. Herein, aptamer is expected to capture more IGF1, and used as the capture probe and antibody was used as the detection probe. shows the crystal structure of IGF1 (PDB accession: 1GZR) from the protein data bank. Similarly, the secondary structure of aptamer was predicted by mfold software with its energy levels (). The predicted aptamer folding pattern displays the three prominent loops and strong stems.
Figure 2. (a) Schematic representation of IGF1 detection by aptamer-antibody sandwich. IGF1 was interacted on chemically immobilized aptamer surface and then sandwiched by antibody. Figure inset explains the dipole moment mechanism. (b) Crystal structure of IGF1. PDB accession is 1GZR.
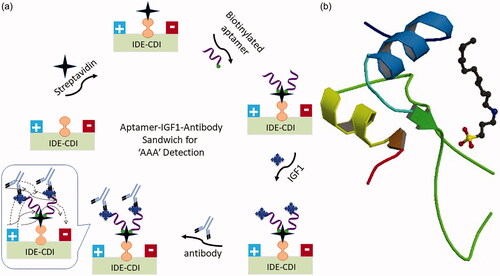
Figure 3. Probably secondary structures of IGF-1 aptamer. (a) Secondary structure with stems and loops; Loop regions are indicated by blue circles. (b) Energy levels (dG). Predicted by the mfold online software.
Process of aptamer immobilization on IDE sensor
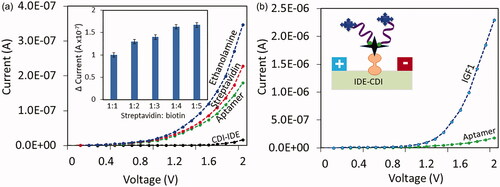
explains biotinylated aptamer immobilization process on IDE sensor. After each step the current changes level were noted to get the conclusion of the biomolecule immobilization on IDE sensor. CDI treated IDE sensor current level was shown as 1.64E-08 A, after drop streptavidin, it was increased to 2.28E-07 A. This current increment is clearly stated the interacting of streptavidin on CDI-modified sensor. Further, the surface was covered by ethanolamine, and the current was increased to 3.47E-07 A. Finally, the biotinylated aptamer was added, the current change was drastically dropped to 1.8E-07 A, due to the interaction of biotin with streptavidin. It has been widely accepted that single streptavidin molecule is able to capture four biotin molecules. Considering this concept, this study titrated five different ratios (1:1, 1:2, 1:3, 1:4 and 1:5) of streptavidin and biotinylated aptamer. As displayed in the (inset) could observe gradual increments until 1:4 and at 1:5 it reaches the saturation. Based on these observations, 200 nM of streptavidin and 1 uM of biotinylated aptamer were used in this study. This overall immobilization process confirms the modification of IDE surface with aptamer.
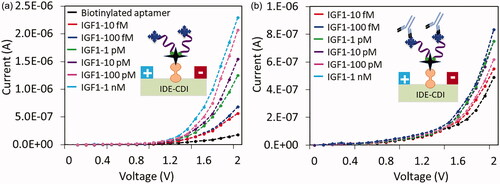
Figure 4. (a) Surface Chemical immobilization of aptamer on IDE surface. Streptavidin was immobilized on IDE surface through CDI linker, and then biotinylated aptamer was interacted with streptavidin. With each immobilization steps the current changes was clearly monitored. Figure inset displays the titrations with different ratios of streptavidin and biotin. (b) Detection of 1 nM IGF1 on aptamer immobilized surfaces is shown. After interacting IGF1 on aptamer surface, the current was drastically increased. Diagrammatically represented by the figure insets.
Igf1 detection on aptamer-IDE surface: electroanalytical analysis
On the aptamer-IDE surface, IGF1 was interacted and quantified. IGF1 at the concentration of 1 nM was added on IDE-aptamer surface, and the current level was increased from 1.8E-07 to 2.29E-06 A. The difference in the current before and after interacting IGF1 was found as 2.11E-06 A (). This increment in current was confirmed by the interaction of aptamer and IGF1.
Limit of IGF1 detection by aptamer
Limit of detection with IGF1-aptamer interaction was calculated by analyzing different concentrations of IGF1 binding. shows the binding of IGF1 from 10 fM to 1 pM on the immobilized aptamer with IDE surface. As shown in figure with 10 fM of IGF1, the current level was increased to 5.63E-07 A. Further, with the increased the concentrations to 0.1, 1, 10, 100, and 1000 pM, the current were increased as 6.87E-07, 1.25E-06, 1.55E-06, 2.07E-06 and 2.29E-07 A, respectively. The concentrations of 100 and 1000 pM are showing the closed current changes level, indicating the saturation with IGF1 and aptamer interaction.
Figure 5. (a) Detection limit of IGF1 on aptamer modified surface. Different concentrations of IGF1 were interacted on aptamer surface, the current changes were noticed. With increasing concentrations, the current levels were gradually increased. (b) Sandwich with antibody. 200 nM of antibody was interacted on aptamer-IGF1 (10 fM to 1 nM) modified surfaces, the current levels were recorded. With increasing IGF1, the levels of current were gradually decreased. Diagrammatically represented by the figure insets.
Sandwich pattern with aptamer-IGF1-antibody
To elevate the IGF1 detection, aptamer-IGF1-antibody sandwich pattern was analyzed on IDE sensor surface. On the aptamer-IGF1 (10 fM to 1 nM) surfaces, 200 nM antibody was added and the current changes were recorded. On all the interacted concentrations of IGF1, the current changes were clearly noted after adding the similar concentration of antibody (). On 10 fM of IGF1 attached surface, the current was decreased from 5.63E-07 to 4.89E-07 A. Similarly, changes on other concentrations were monitored, with 100 fM it was from 6.84E-7 to 5.45E-07 A, 1 pM showed from 1.25E-6 to 8.32E-07 A, 10 pM displayed from 1.59E-6 to 7.5E-07 A, 100 pM showed from 2.07E-6 to 7.5E-07 A, and 1 nM showed from 2.29E-6 to 6.1E-07 A ().
Figure 6. (a) Current level of IGF1 binding on aptamer and antibody binding on IGF1. Error bar indicates the averaged values from triplicates (n = 3) with the standard deviations. (b) Difference in current changes with IGF1 binding on aptamer and antibody binding on IGF1. Plotted by a linear graph and the limit of detection was found as 10 fM. The limit of detection (LOD) was considered the lowest concentration of an analyte (from the calibration line at low concentrations) against the background signal (S/N = 3:1), in other word, LOD = standard deviation of the baseline + 3σ.
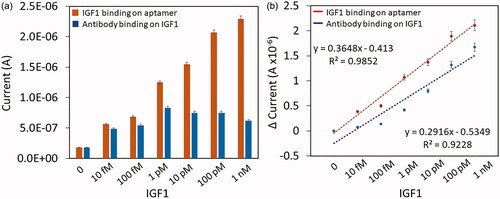
Correlations between interactions were analyzed graphically by using the slope of the regression line and explored with the multiple linear regression. With the coefficient variance of the model (R2), the standardized correlation coefficient was presented. The obtained R2-value with IGF1 and aptamer was 0.9852 and with antibody it was 0.9228. A linear regression model was constructed based on graph of linear equation. From this result, it was concluded that with all the concentrations of IGF1, this sandwich assay improved the current level, indicates the improved detection by aptamer-IGF1-antibody sandwich pattern. The detection limit was calculated by suing the 3σ and it was found as 10 fM of IGF1 (). Based on the obtained slopes, both involved two probing molecules (aptamer and antibody) either as capture or detection molecule. But pattern of sandwiches are vice-versa and both molecules contributed for these detections. However, when uses aptamer as the capture molecule, the response in current was higher with ultimate increment in the detection limit to the level at 10 fM (n = 3; LOD = standard deviation of the baseline + 3σ). Whereas, when antibody used as the capture molecule the detection limit was reaching at 1 pM with the discrimination by 100 folds lesser sensitivity and aptamer behaves better. Even though the size of antibody is larger than aptamer, it does not show the current level improvement. These results clearly proved that aptamer can be an ideal capturing molecule and antibody is good to be as detection molecule.
Detection of IGF1 in human serum by sandwich with aptamer and antibody
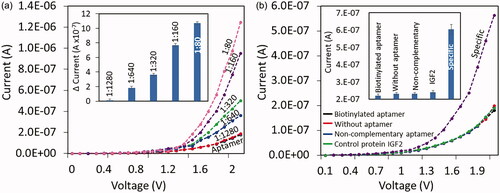
After the successful identification of pure IGF1 on IDE sensor, IGF1 was detected from the human serum by using aptamer. Human serum was diluted as 1:500, 1:250, 1:125, and 1:60 and 1:30 and added on aptamer immobilized surfaces and sandwiched by IGF1-antibody. As shown in the figure, 1:500 dilution shows slight change of current, from 1:250 the changes were clear and the current increments were getting the conclusion of the detection of IGF1 from human serum (). In various researches, it was proved that aptamers are more stable in serum containing sample. The obtained result in the current research is also concluded the stability of the aptamer for IGF1 detection in human serum.
Figure 7. (a) IGF1 detection from diluted human serum. Diluted human serum from 1:80 to 1:1280 was dropped on aptamer surface and then sandwiched by antibody. From the dilution of 1:640, the current level was noted to increase. (b) Control experiments. Performed with commentary aptamer, IGF2 and without aptamer. All control experiments did not show any significant changes in current compared with the specific interaction of aptamer with IGF1. Differences in current changes were plotted as figure insets. Error bar indicates the averaged values from triplicates (n = 3) with the standard deviations.
Selective IGF1 detection by aptamer
Three control experiments with different biomolecules were performed to analyze the selective IGF1 detection by the aptamer. As shown in without aptamer, IGF1 did not show any particular current changes. And also, the non-complementary aptamer (complementary bases of aptamer sequences) cannot interact with IGF1. The other control was carried out with the protein IGF2 and it failed to bind with IGF1 aptamer. From the results obtained above was concluded that IGF1 was specifically bind with its immobilized aptamer on IDE sensing surface. Further, the reproducibility of different surface modifications was evaluated and the outcome clearly indicates a good reproducibility (). Overall, the demonstrated sensing system has shown high-performance and comparable with the currently available systems ().
Figure 8. Reproducibility test. The repetitions were performed on different surface modifications.
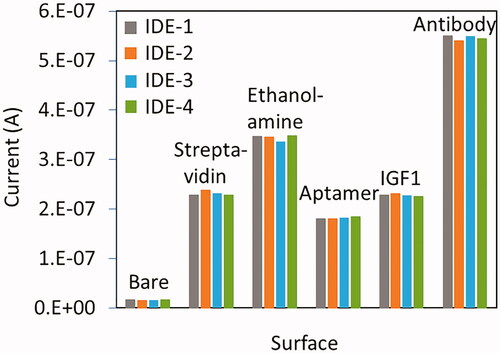
Table 1. Comparison with the current detection methods on AAA.
Conclusion
This research is focussed to detect IGF1 [a well-known biomarker for Abdominal Aortic Aneurysms (AAA)] by its aptamer on the InterDigitated electrode (IDE) sensor, because AAA is a life-threatening vascular disease, predominantly found with the people at older ages. It was found that the limit of detection of IGF1 was 10 fM. Further, the sandwich pattern of aptamer-IGF1-antibody was improved the current level in all the concentrations of tested IGF1. In addition, IGF1 was detected from the diluted human serum, and from 1:250 dilution, the current changes were clearly noted. This research helps to diagnose the AAA and its condition to support the imaging analyses.
Author contributions
The authors all contributed to the preparation of the manuscript and discussion. All authors read and approved the final manuscript.
Disclosure statement
No potential conflict of interest was reported by the author(s).
Data availability statement
All of the data are fully available without restriction.
Correction Statement
This article has been republished with minor changes. These changes do not impact the academic content of the article.
Additional information
Funding
References
- Humphrey JD, Holzapfel GA. Mechanics, mechanobiology, and modeling of human abdominal aorta and aneurysms. J. Biomech. 2012;45(5):805–814
- Sakalihasan N, Michel JB, Katsargyris A, et al. Abdominal aortic aneurysms. Nat Rev Dis Prim. 2018; 4(1): 34.
- Schwartz SA, Taljanovic MS, Smyth S, et al. CT findings of rupture, impending rupture, and contained rupture of abdominal aortic aneurysms. AJR Am J Roentgenol. 2007; 188: W57-W62.
- Danzer D, Becquemin JP. Abdominal aortic aneurysm. In: Geroulakos, G., van Urk, H., Hobson II, R.W., Calligaro, K.D. (Eds.), Vascular surgery: cases. questions and commentaries; Springer-Verlag London. 2018. p. 453.
- De Rango P, Farchioni L, Fiorucci B, et al. Diabetes and abdominal aortic aneurysms. Eur J Vasc Endovasc Surg. 2014; 47(3):243–261.
- Tambyraja AL, Chalmers RTA. Aortic aneurysms. Surgery. 2009; 27 (8): 342-345.
- Soto B, Gallastegi-Mozos T, Rodríguez C, et al. Circulating CCL20 as a new biomarker of abdominal aortic aneurysm. Sci Rep. 2017;7:17331.
- Martinez-Pinna R, Ramos-Mozo P, Madrigal-Matute J, et al. Identification of peroxiredoxin-1 as a novel biomarker of abdominal aortic aneurysm. Arterioscler Thromb Vasc Biol. 2011;31(4):935–943.
- Lindholt JS, Martin-Ventura JL, Urbonavicius S, et al. Insulin-like growth factor i - A novel biomarker of abdominal aortic aneurysms. Eur J Vasc Endovasc Surg. 2011;42(5):560–562.
- Yeap BB, Chubb SAP, McCaul KA, et al. Comment on ‘insulin-like growth factor 1’ – a novel biomarker of abdominal aortic aneurysm. Eur J Endocrinol. 2012;166(2):191–197.
- Golledge J, Tsao PS, Dalman RL, et al. Circulating markers of abdominal aortic aneurysm presence and progression. Circulation. 2008;118(23):2382–2392.
- Koole D, Van Herwaarden JA, Pasterkamp G, et al. Comment on “insulin-like growth factor 1 – a novel biomarker of abdominal aortic aneurysm. Eur J Vasc Endovasc Surg. 2012; 43(3):360.
- Lakshmipriya T, Horiguchi Y, Nagasaki Y. Co-immobilized poly(ethylene glycol)-block-polyamines promote sensitivity and restrict biofouling on gold sensor surface for detecting factor IX in human plasma. Analyst. 2014;139(16):3977–3985.
- Liu F, Zhang J, Chen R, et al. Highly effective colorimetric and visual detection of ATP by a DNAzyme-aptamer sensor. Chem Biodivers. 2011;8(2):311–316.
- Gopinath SCB, Perumal V, Rao BS, et al. Voltammetric immunoassay for the human blood clotting factor IX by using nanogapped dielectrode junctions modified with gold nanoparticle-conjugated antibody. Microchim Acta. 2017;184(10):3739–3745.
- Gopinath SCB, Tang TH, Citartan M, et al. Current aspects in immunosensors. Biosens Bioelectron. 2014;57:292–302.
- Ng AHC, Uddayasankar U, Wheeler AR. Immunoassays in microfluidic systems. Anal Bioanal Chem. 2010;397(3):991–1007.
- Wang C, Lakshmipriya T, Gopinath SCB. Amine-aldehyde chemical conjugation on a potassium hydroxide-treated polystyrene ELISA surface for nanosensing an HIV-p24 antigen. Nanoscale Res Lett. 2019;14(1):21.
- Gopinath SCB, Awazu K, Fujimaki M. Waveguide-mode sensors as aptasensors. Sensors. 2012;12(2):2136–2151.
- Lakshmipriya T, Fujimaki M, Gopinath SCB, et al. A high-performance waveguide-mode biosensor for detection of factor IX using PEG-based blocking agents to suppress non-specific binding and improve sensitivity. Analyst. 2013b;138(10):2863–2870.
- Letchumanan I, Gopinath SCB, Md Arshad MK, et al. Gold nano-urchin integrated label-free amperometric aptasensing human blood clotting factor IX: a prognosticative approach for “Royal disease". Biosens Bioelectron. 2019a;131:128–135.
- Song KM, Jeong E, Jeon W, et al. Aptasensor for ampicillin using gold nanoparticle based dual fluorescence-colorimetric methods. Anal Bioanal Chem. 2012;402(6):2153–2161.
- Wang Y, Li ZH, Hu DH, et al. Aptamer/graphene oxide nanocomplex for in situ molecular probing in living cells. J Am Chem Soc. 2010;132(27):9274–9276.
- Cheen OC, Gopinath SCB, Perumal V, et al. Aptamer-based impedimetric determination of the human blood clotting factor IX in serum using an interdigitated electrode modified with a ZnO nanolayer. Microchim Acta. 2017;184(1):117–125.
- Gopinath SCB, Kumar PKR, Tominaga J. A BioDVD media with multilayered structure is suitable for analyzing biomolecular interactions. J Nanosci Nanotechnol. 2011;11:1–7.
- Lakshmipriya T, Fujimaki M, Gopinath SCB, et al. Generation of anti-influenza aptamers using the systematic evolution of ligands by exponential enrichment for sensing applications. Langmuir. 2013a;29(48):15107–15115.
- Letchumanan I, Md Arshad MK, Balakrishnan SR, et al. Gold-nanorod enhances dielectric voltammetry detection of c-reactive protein: A predictive strategy for cardiac failure. Biosens Bioelectron. 2019b;130:40–47.
- Lv Q, Wang Y, Su C, et al. Human papilloma virus DNA-biomarker analysis for cervical cancer: signal enhancement by gold nanoparticle-coupled tetravalent streptavidin-biotin strategy. Int J Biol Macromol. 2019;134:354–360.
- Bruno JG, Richarte AM. Development and characterization of an enzyme-linked DNA aptamer-magnetic bead-based assay for human IGF-I in serum. Microchem. J. 2016;124:90–95.
- Aggarwal S, Qamar A, Sharma V, et al. Abdominal aortic aneurysm: a comprehensive review. Exp Clin Cardiol. 2011; 16(1): 11–15.
- Baxter BT, Terrin MC, Dalman RL. Medical management of small abdominal aortic aneurysms. Circulation. 2008;117(14):1883–1889.
- Lindholt JS, Juul S, Fasting H, et al. Screening for abdominal aortic aneurysms: single centre randomised controlled trial. BMJ. 2005;330(7494):750.
- Lakshmipriya T, Gopinath SCB, Tang T-H. Biotin-streptavidin competition mediates sensitive detection of biomolecules in enzyme linked immunosorbent assay. PLOS One. 2016;11(3):e0151153.
- Guo S, Li Y, Li R, et al. High-performance detection of an abdominal aortic aneurysm biomarker by immunosensing. Biotechnol Appl Biochem. 2020;67(3): 383–388.
- Nivetha AK. Divination of abdominal aortic aneurysm by deploying ultrasonic transducer sensor. Int J Eng Res Technol. 2018;6:1–4.
- Hong X, Hong X, Zhao H, et al. Improved immunoassay for insulin-like growth factor 1 detection by aminated silica nanoparticle in ELISA. Process Biochem. 2020;91:282–287.
- Springer F, Schlierf R, Pfeffer JG, et al. Detecting endoleaks after endovascular AAA repair with a minimally invasive implantable, telemetric pressure sensor: an in vitro study. Eur Radiol. 2007; 17(10): 2589–2597.
- Schlierf R, Görtz M, Rode TS, et al. 2005. Pressure sensor capsule to control the treatmnent of abdominal aorta aneurisms. Digest of technical papers – International Conference on Solid State Sensors and Actuators and Microsystems, TRANSDUCERS ’05. Seoul, South Korea.
- Ding Y, Tian Q, Dong Y, et al. Gold-silane complexed antibody immobilization on polystyrene ELISA surface for enhanced determination of matrix metalloproteinase-9. Process Biochem. 2021;100:231–236.
- Zhai J, How TV, Hon B. Design and modelling of a passive wireless pressure sensor. CIRP Ann Manuf Technol. 2010;59 (1): 187–190.
- Fok M, Bashir M, Fraser H, et al. A novel microwave sensor to detect specific biomarkers in human cerebrospinal fluid and their relationship to cellular ischemia during thoracoabdominal aortic aneurysm repair. J Med Syst. 2015; 39(4):208.
- Lu B, Liu L, Wang J, et al. Detection of microRNA-335-5p on an interdigitated electrode surface for determination of the severity of abdominal aortic aneurysms. Nano Res Lett. 2020;15:105.