
Abstract
Current studies indicated that immune-associated genes (IAGs) have important roles in the occurrence and development of bladder cancer (BC). The current work aims to identify the prognostic values of IAGs in BC and establish a prognostic signature based on IAGs. RNA sequencing data and protein expression data were used to identify differentially expressed IAGs in BC. An IAGs based signature was further constructed and the prognostic and predictive values of the signature were evaluated by survival analysis and nomogram. RNA isolation and reverse transcription-quantitative PCR (RT-qPCR) were further performed to investigate the expression levels of IAGs in BC cells and were used to explore the relationship between IAGs and M2 tumour-associated macrophages (TAMs) secreted transforming growth factor-β1 (TGF-β1) in BC cells. We selected five IAGs to develop an IAGs signature model, which were significantly related to survival outcomes of BC patients. RT-qPCR showed that five IAGs were significantly differentially expressed and three IAGs were positively correlated with M2 TAMs secreted TGF-β1 in T24 cells. We identified and validated an IAGs based signature to predict the prognosis of BC patients. Furthermore, M2 TAMs may promote the expression of IAGs in BC via the TGF-β1 signalling pathway.
Introduction
Bladder cancer (BC) is a major malignant and highly aggressive tumour in the urinary system, with an estimated 80,470 new cancer cases in the United States in 2019 [Citation1]. The BC age-standardized mortality rate (per 100,000 person/year) was 3.2 for men versus 0.9 for women worldwide [Citation2]. Surgical resection is the main treatment for localized BC, whereas chemotherapy and immunotherapy are preferred treatments for advanced and metastatic BC. Nevertheless, due to the intrinsic genetic heterogeneity of patients, patients with similar pathological features still have a significantly different risk of disease recurrence and progression. In recent years, the development and advances in liquid chromatography coupled to tandem mass spectrometry (LC–MS/MS) have revolutionized the analytical study of biomolecules by enabling their accurate identification and quantification in an unprecedented manner. In addition, LC–MS/MS provides accurate quantitative profiling of proteins in complex biological samples such as cell lines, tissues and body fluids and has emerged as an innovative analytical technique to identify biomarkers for tumours. At present, the molecular mechanism of BC has not yet been realized, while increasing evidence demonstrated that genetic factors, especially immune-associated genes (IAGs) and immune systems play vital roles in the occurrence and progression of BC [Citation3–6]. Furthermore, as Bacillus Calmette-Guérin (BCG) has obtained successful responses against non-muscle invasive bladder cancer (NMIBC), immunotherapies such as programmed death-1 (PD-1)/programmed death-ligand 1 (PD-L1) or cytotoxic T-lymphocyte-associated protein 4 (CTLA-4) inhibitors are becoming a promising novel approach for the treatment of BC [Citation7–9]. However, the immune response efficacy of immunotherapies in patients still low. Therefore, identify immune factors, especially IAGs, to serve as novel biomarkers to predict disease progression, prognosis and response to treatment in patients with BC by using LC–MS/MS is still urgently needed.
In this study, we used the transcriptome data and proteomics data to identify differentially expressed IAGs in BC patients and constructed an IAGs based signature which was significantly associated with the prognosis of BC patients. Finally, we established a nomogram that incorporates the IAGs based signature and clinical factors for individualized prediction of prognosis in BC patients. In addition, the mRNA expression levels and potential mechanisms of five IAGs in BC cells were further investigated in vitro experiments.
Materials and methods
Data collection
The messenger RNA expression profiles and clinical data of BC cohorts were obtained from TCGA official website (https://tcga-data.nci.nih.gov/tcga/). Four hundred and eight BC patients were collected in our study and detailed clinicopathological features are displayed in . IAGs comprehensive list was obtained from The Immunology Database and Analysis Portal (ImmPort, https://immport.niaid.nih.gov) [Citation10], including a total of 2498 IAGs.
Table 1. TCGA and our BC patients’ characteristics.
LC–MS/MS analysis
In the present study, all of the tissues and clinical information were collected from the 10 patients treated with surgical resection, including 10 BC tissues and corresponding 10 normal tissues. We included these patients who underwent laparoscopic radical cystectomy and who did not receive preoperative radiotherapy and chemotherapy. According to the ethical guidelines as required by the Declaration of Helsinki, informed consent was provided by each patient, and the research protocol was approved by the Ethical Committee of the Affiliated Hospital of Qingdao University.
Comparative proteomic profiling is commonly used in LC–MS/MS. In the present study, we used the same method to explore the expression levels of the variety of proteins in BC samples and normal samples. The process contained protein extraction, trypsin digestion, TMT/iTRAQ labelling, HPLC fractionation, LC–MS/MS analysis, database search and bioinformatic methods. The detailed information of experimental procedures is shown in supplementary 1. The enrichment of the differentially expressed protein against all identified proteins was detected by a two-tailed Fisher’s exact test, and protein domains with a corrected p value <.05 were recognized as statistically significant. To further distinguish up- or down-regulated of these proteins in BC, we set the threshold of the ratio between BC and normal samples to 1.2.
Identification of differentially expressed IAGs
The differentially expressed IAGs between TCGA BC and normal samples were identified using edgeR (version R 3.5.1, https://bioconductor.org/packages/release/bioc/) [Citation11]. False discovery rate (FDR)<0.05 and |log2 fold change (FC)|>1 were recognized as the cut-off values. Subsequently, we further screened IAGs by combining with proteomics data. Boxplots were applied to display IAGs, which were differentially expressed in both mRNA and protein levels.
Construction of an IAGs based prognostic risk signature
Univariate Cox regression analysis was performed using the R package “survival”, and genes with a significance level of p < .05 were selected as candidate survival-related IAGs to establish an IAGs based signature. A least absolute shrinkage and selection operator (LASSO) Cox regression method was performed using the “glmnet” package (R Foundation for Statistical Computing, Vienna, Austria) to identify the best IAGs based signature for predicting the prognosis of BC patients [Citation12]. The risk score that incorporates the expression level of each prognostic IAGs and its corresponding coefficient was calculated as follows: risk score = Ʃ(βi×Expi) (i = the number of prognostic IAGs). Subsequently, the median risk score was set as a cut-off value to further classify BC into high- and low-risk groups. Kaplan–Meier’s curves were used to investigate the survival outcome differences between the high- and low-risk groups. The receiver operating characteristic (ROC) analysis was used to evaluate the sensitivity and specificity of the IAGs based signature risk score in predicting the survival of BC patients. Univariate and multivariate Cox regression analyses were used to assess prognostic significances of the IAGs based signature and various clinical factors. In addition, we used the Wilcoxon signed-rank test to investigate the relationship between IAGs risk score and clinical characteristics. Furthermore, we divided 365 muscle-invasive BC patients (T2–T4) into two molecular subtypes (basal or luminal) based on gene expression [Citation13]. Wilcoxon’s signed-rank test was used to analyse the expression levels of five IAGs in two subtypes.
Development of a nomogram based on the IAGs signature and clinical characteristics
A prognostic nomogram including clinical factors (age, gender, pathologic stage, pathologic T, pathologic N, pathologic M, diagnosis subtype, radiation therapy, tobacco smoking history, number pack years smoked) and the IAG based signature risk score to evaluate the probability of 1-, 2- and 3-year OS for BC patients via the R package (https://cran.r-project.org/web/packages/rms/) [Citation14].
Correlation analysis between risk score and immune cell infiltration in BC
Previous studies demonstrated that IAGs influence the progression of tumours by modulating the progress of immune response and remodelling the immune microenvironment of tumours. Thus, tumour immune estimation resource (TIMER), a useful resource for comprehensive analysis of tumour-infiltrating immune cells, was employed to explore the correlations between the signature risk score and immune cell infiltration [Citation15]. The composition of six tumour-infiltrating immune cell subsets (B cells, CD4+ T cells, CD8+ T cells, macrophages, neutrophils and dendritic cells) was estimated by using the TIMER algorithm. The levels of immune cell infiltration in BC patients were obtained from the TIMER website and the relationship between the signature risk score and six tumour-infiltrating immune cells was performed in R.
RNA isolation and reverse transcription-quantitative PCR
To further validate the mRNA expression levels of five IAGs in BC cell lines, RNA isolation and reverse transcription-quantitative PCR (RT-qPCR) were performed. The T24 (human BC cells) and SV-HUC-1 (human bladder cell biochemistry Pillon) cell lines were supplied by the cell bank of the Chinese Academy of Sciences. The materials used for the cell culture, including the 1640 culture medium, FBS, trypsin, penicillin and streptomycin, were purchased from Gibco Co. (Grand Island, NY). The total RNA was extracted using Trizol (Takara, Dalian, China, code no 9109) according to the manufacturer’s recommendations. For the detection of mRNA levels, the total RNA (500 ng) was transcribed into cDNA using a PrimeScript™ RT reagent kit (Perfect Real Time) (Takara, Dalian, China, code no, RR037A). All the primers were synthesized by Huada Gene (Beijing, China) and the sequences are shown in . The amplification of cDNAs was conducted with Roche Light Cycler 480II real-time PCR detection system (Roche, Basel, Switzerland). Gene expression was normalized against β-actin and relative expression levels of STAT1, ANXA6, CACYBP, AHNAK and CALR were determined by the comparative threshold cycle (Ct) method using the formula 2−(ΔΔCt).
Table 2. Sequences of the primers used for real-time quantitative PCR.
The relationship between M2 TAMs secreted TGF-β1 and five IAGs in T24 cells
TIMER analysis indicated that the signature was significantly related to macrophages in BC. Current studies have demonstrated that M2 tumour-associated macrophages (TAMs) can secret transforming growth factor-β1 (TGF-β1), which played an important role in the immune response and escape of tumours. Therefore, the relationship between M2 TAMs secreted TGF-β1 and five IAGs expression levels were further explored in T24 cells. The T24 cells were seeded at 2–10 × 105 cells/well in 24-well plates for 24 h and incubated at 37 °C in a humidified atmosphere containing 5% CO2. THP-1 is a human leukaemia monocytic cell line, which has been extensively used to study macrophages functions, mechanisms and signalling pathways [Citation16]. In the present study, THP-1 monocytes were seeded at 2 × 10⁵ cells/well in 24-well plates and were stimulated for 48 h with 100 ng/ml PMA (phorbol-12-myristate-13-acetate) to fully differentiate into macrophages. After that, PMA-differentiated macrophages (M0) were primed with fresh medium supplemented with 20 ng/ml IL-4 for 24 h to the M2 phenotype. Subsequently, M2 TAMs in 24-well plates were cultured with normal 1640 medium (glucose 2000 mg/ml) or 1 μg/ml TGF-β1 antibody (AF-246-NA, Bio-Techne China Co. Ltd., Shanghai, China) with 24 h. Then, the T24 cells were stimulated with the supernatant of M2 TAMs for 48 h. Commercially, human TGF-β1 ELISA kit (Abcam, Cambridge, UK, ab100647) was used to measure TGF-β1 in the supernatant of cell cultures according to the manufacturer’s instructions. The expression levels of five IAGs were investigated by RT-qPCR.
Co-culture of M2 TAMs and T24 cells
THP-1 cells were seeded at 5 × 10⁵ cells/well in a Transwell insert (Corning, New York, NY); the pore size of the membrane was 0.4 µm, which would not allow the cells to pass through. THP-1 monocytes were stimulated for 48 h with 100 ng/ml PMA. After that, M0 cells were primed with fresh medium supplemented with 20 ng/ml IL-4 for 24 h to the M2 phenotype. The T24 cells were seeded at 2 × 10⁵ cells/well on corresponding receiver plates. Therefore, the M2 TAMs and T24 cells could be collected separately after co-culture. The co-culture of M2 TAMs and T24 cells was cultured with a normal 1640 medium or 1 μg/ml TGF-β1 antibody for 48 h. The five IAGs expression levels in T24 cells under the co-culture conditions were investigated by performing RT-qPCR.
Results
Identification of differentially expressed IAGs in BC
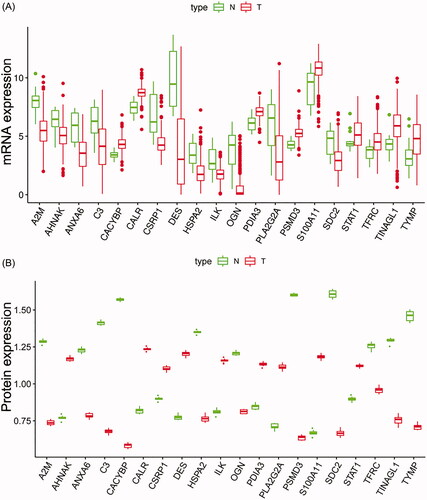
The mRNA expression data of TCGA BC patients were subjected to identify IAGs, which were differentially expressed in mRNA levels. We identified 260 IAGs between 408 BC tissues and 19 normal tissues (Supplementary 2). To investigate the differences in the protein levels of these 260 IAGs between BC and normal samples, we collected samples from 10 patients in the Affiliated Hospital of Qingdao University. These samples were processed and analysed using LC–MS/MS following the process outlined in supplementary 3. The result showed that the protein levels of 20 IAGs were differentially expressed in BC among these 260 IAGs. Boxplots were used to screen the mRNA and protein levels of 20 IAGs in BC (). The detailed information of the protein expression of 20 IAGs in our samples is shown in Supplementary 4.
Figure 1. Boxplots of the mRNA (A) and protein (B) expression levels of 20 IAGs in BC and normal tissues.
Identification of prognostic IAGs and construction of an IAGs based prognostic signature
Univariate Cox regression analysis showed that seven out of 20 IAGs were identified to have significant prognostic values in BC (p < .05) (). LASSO Cox regression analysis was then applied to construct a prognostic signature in BC by using seven IAGs, and the regression coefficient was computed (). While five genes were included, the signature achieved the best performance (). The signature contains five IAGs, including ANXA6 (annexin A6), AHNAK (AHNAK nucleoprotein), STAT1 (signal transducer and activator of transcription 1), CACYBP (calcyclin binding protein) and CALR (calreticulin). The detailed information is shown in . We further calculated the risk score for 403 BC patients as follows: risk score = (0.0082 × expression value of ANXA6) + (0.0161 × expression value of AHNAK) + (0.0252 × expression value of CACYBP) + (–0.0079 × expression value of STAT1)+(0.0011 × expression value of CALR), and the median risk score as the cut-off value to divide BC patients into high- and low-risk groups. Kaplan–Meier’s analyses indicated that high risk scores were significantly related to poor overall survival (OS) (p= 7.79e–07, ), progression-free interval (PFI) (p= 1.459e–04, ) and disease-specific survival (DSS) (p= 2.647e–05, ) in BC patients. In addition, ROC curves were performed and the area under the curves (AUCs) of the IAGs based signature, age, gender, grade, pathologic stage, pathologic T, pathologic N, M, diagnosis subtype, radiation therapy and smoking history were 0.739, 0.569, 0.422, 0.580, 0.637, 0.597, 0.620, 0.535, 0.392, 0.454 and 0.632, respectively, which indicated superior predictive accuracy of IAGs based signature in survival outcomes (). Furthermore, the relationships between the risk score and prognosis in non-muscle-invasive BC (NMIBC) patients receiving BCG treatment or BC patients who received radiation therapy were further analysed. Survival analyses showed that high risk scores indicate poor survival outcomes in NMIBC patients who received BCG treatment (p= 1.431e–03, ) and BC patients who received radiation therapy (p= 1.877e–02, ).
Figure 2. The relationship between differentially expressed IAGs and survival of BC patients. Univariate Cox regression analysis shows that a total of seven differentially expressed IAGs are closely associated with the OS of BC patients (p < .05).
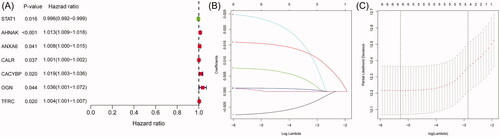
Figure 3. Survival analyses of the IAGs based signature in BC. Kaplan–Meier’s curves revealed that high risk scores are closely associated with poor overall survival (OS), progression-free interval (PFI) and disease-specific survival (DSS) in BC patients (A–C). The ROC curves showed that AUCs for the IAGs based signature, age, gender, grade, pathologic stage, pathologic T, pathologic N, M, diagnosis subtype, radiation therapy and smoking history were 0.739, 0.569, 0.422, 0.580, 0.637, 0.597, 0.620, 0.535, 0.392, 0.454 and 0.632 (D), respectively. High risk scores indicate poor survival outcomes in NMIBC patients receiving BCG treatment (E) and BC patients receiving radiation therapy (F).
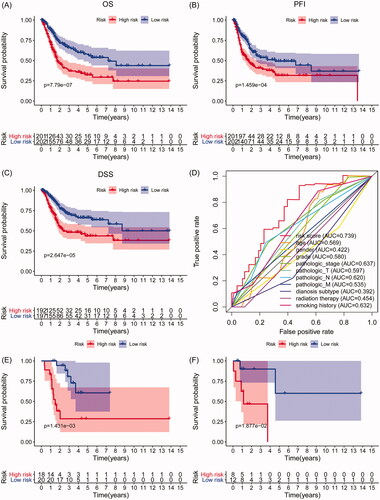
Table 3. LASSO Cox regression analysis for OS of five IAGs in BC.
The IAGs based signature is an independent prognostic factor for BC
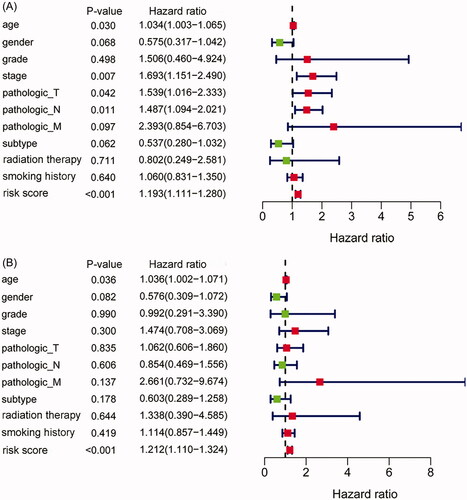
Univariate and multivariate Cox regression analyses were used to evaluate the independence of the IAGs based signature in clinical application. Univariate Cox regression analysis showed that age (p= .03), stage (p= .007), pathologic T (p = .042), pathologic N (p= .011) and the IAGs risk score (p < .001) were related to the OS of BC patients (). Multivariate Cox regression analysis showed that the IAGs based signature was an independent prognostic factor for BC (p < .001, ).
Figure 4. The IAGs based signature was an independent prognostic predictor for BC. Univariate Cox regression analysis showed that age, stage, pathologic T, pathologic N and the IAGs based signature risk score were associated with the OS of BC patients (A). Multivariate Cox regression analysis indicated that the IAGs based signature was an independent prognostic factor for BC (B).
Association between the IAGs based signature and clinical characteristics
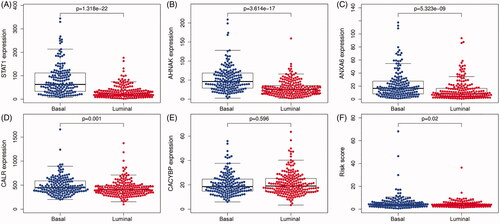
The choices of therapeutic strategies for BC patients are largely based on clinical features. Therefore, we further evaluated the association between IAGs based signature and clinical characteristics in BC patients. Our study showed that the IAGs based signature was significantly associated with grade (p= 1.129e–05), stage (p= 1.831e–08), pathologic T (p= 2.058e–06), pathologic N (p= 6.833e–07), pathologic M (p= .001), diagnosis subtype (p=.003), lymphovascular invasion present (p= 1.794e–04) and new tumour event after initial treatment (p= 1.141e–04), but not associated with age (p= .152), gender (p= .675), BC extracapsular extension (p= .858) and new neoplasm event type (p= .394) in BC patients (). Recent studies indicated that BC has distinct molecular subtypes, which were significantly related to survival outcomes of BC patients. The results showed that STAT1, AHNAK, ANXA6 and CALR were highly expressed in the basal subtype (). However, CACYBP was not associated with the molecular subtype of BC (). Furthermore, BC patients with high risk scores may indicate the feature of a basal subtype ().
Figure 5. The relationship between the IAGs based signature and clinical characteristics. The IAGs based signature was associated with grade, stage, pathologic T, pathologic N, pathologic M, diagnosis subtype, lymphovascular invasion present and new tumour event after initial treatment (A–H), but not correlated with age, gender, BC extracapsular extension and new neoplasm event type in BC patients (I–L).
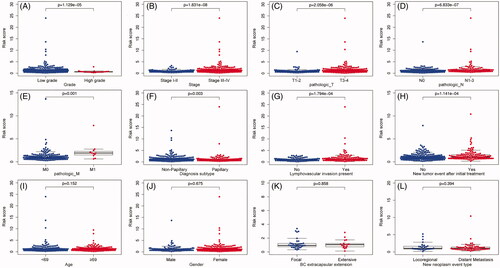
Figure 6. The expression level of five IAGs in different molecular subtypes of BC. STAT1, AHNAK, ANXA6 and CALR were highly expressed in the basal subtype (A–D). However, the expression of CACYBP was not associated with the molecular subtype of BC (E). Furthermore, BC patients with high risk scores may indicate the feature of a basal subtype (F).
Construction of a prognostic nomogram for BC
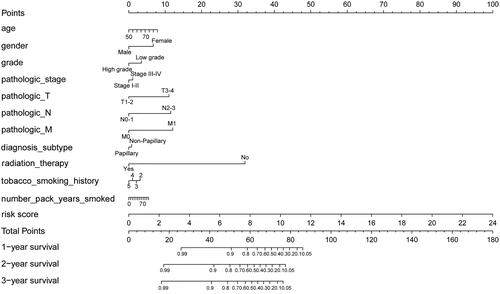
A prognostic nomogram was constructed to monitor the prognosis of BC patients by combining clinical factors (age, gender, grade, pathologic stage, pathologic T, pathologic N, pathologic M, diagnosis subtype, radiation therapy, tobacco smoking history, number pack-years smoked) with the IAGs based signature risk score. The result revealed that the prognostic nomogram could superiorly predict the 1, 2 and 3 years OS of BC patients ().
Figure 7. A prognostic nomogram with clinical features and the IAGs based signature for BC. The nomogram could superiorly predict 1, 2 and 3 years OS of BC patients.
Correlation analysis between the risk score and immune cell infiltration in BC
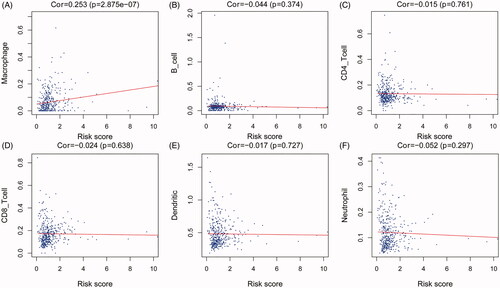
To identify the significance of the IAGs based signature in the tumour microenvironment, the relationship between the abundance of six types of tumour-infiltrating immune cells (B cells, CD4+ T cells, CD8+ T cells, neutrophils, macrophages and dendritic cells) and the IAGs based signature risk score was explored in BC. The results indicated that the risk score was positively associated with the infiltration of macrophages (p= 2.875e–07, ), However, the risk score was not correlated with the infiltration of B cells, CD4+ T cells, CD8+ T cells, dendritic cells and neutrophils ().
Figure 8. Association between the IAGs signature risks score and immune cell infiltration in the microenvironment of BC. The results revealed that the risk score was positively associated with the infiltration of macrophages (A). However, the risk score was not correlated with the infiltration of B cells CD4+ T cells, CD8+ T cells, dendritic cells and neutrophils (B–F).
M2 TAMs may promote the expression levels of IAGs via the TGF-β1 signalling pathway
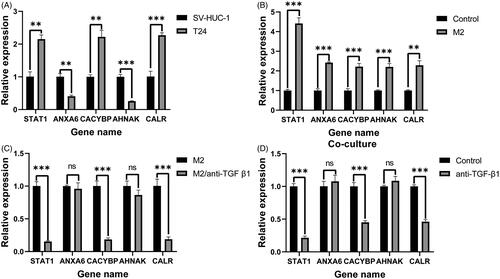
RNA isolation and RT-qPCR were further performed to validate the expression levels of five selected IAGs in T24 and SV-HUC-1 cell lines. The results demonstrated significant differences in the expression levels of five IAGs between T24 and SV-HUC-1 cell lines (). Among these five IAGs, STAT1, CACYBP, CALR were upregulated, ANXA6 and AHNAK were downregulated in T24 cells. Compared with the unstimulated T24 cells, the expression of five IAGs was significantly elevated in T24 cell lines after stimulated with the supernatant of M2 TAMs (). Furthermore, the TGF-β1 inhibitor was used to inhibit the production of TGF-β1 in M2 TAMs. Compared to M2 TAMs without TGF-β1 inhibitor, the production of TGF-β1 in M2 TAMs with TGF-β1 inhibitor was significantly decreased (Supplementary 5). The expression levels of STAT1, CACYBP and CALR were significantly downregulated in T24 cells when stimulated with the low TGF-β1 supernatant of M2 TAMs (). T24 cells and M2 TAMs were co-cultured in a Transwell system. The mRNA levels of STAT1, CACYBP and CALR were decreased by inhibiting the concentration of TGF-β1 in the co-culture system. However, there were no significant changes in the expression levels of ANXA6 and AHNAK by inhibiting the concentration of TGF-β1 in the co-culture system (). In summary, five IAGs were differentially expressed and M2 TAMs secreted TGF-β1 can promote three IAGs expression in BC cells.
Figure 9. RT-qPCR validation of five IAGs expression in BC cells. The significant differences in the expression levels of five IAGs between T24 and SV-HUC-1 cell lines (A). Among these five IAGs, STAT1, CACYBP and CALR were upregulated, ANXA6 and AHNAK were downregulated in T24 cells. Compared with the unstimulated T24 cells, the expression of five IAGs was significantly elevated in T24 cell lines after stimulated with the supernatant of M2 TAMs (B). The expression levels STAT1, CACYBP and CALR were significantly downregulated in T24 cells when stimulated with the low TGF-β1 supernatant of M2 TAMs (C). The mRNA levels of STAT1, CACYBP and CALR were decreased by inhibiting the concentration of TGF-β1 in the coculture system. However, no significant changes in the expression levels of ANXA6 and AHNAK by inhibiting the concentration of TGF-β1 in the co-culture system (D). **p <.005; ***p <.0005.
Discussion
BC is a common malignant tumour in humans, although multiple prognostic predictors for BC have been explored, available biomarkers are not sensitive enough to predict the prognosis of BC. Due to the profound research on the mechanism of tumour immune escape and immunotherapy, IAGs are getting increasing attention in recent years. Considering the important role of the immune microenvironment in the progression of cancer, it is crucial to investigate immune-related predictors for BC patients. In addition, previous studies have been constructed various signatures to predict the prognosis of BC patients, whereas few studies were performed by combining with transcriptome data and proteomics data. In the present study, transcriptome data from the TCGA database and proteomics data from our samples were used to identify differentially expressed IAGs and establish an IAGs based prognostic signature in BC patients. A total of 20 differentially expressed IAGs were identified, seven of which were closely associated with the survival of BC. Five IAGs (ANXA6, AHNAK, CACYBP, STAT1 and CALR) were finally used to construct an IAGs based signature model and survival analyses showed that high risk scores were correlated with the poor OS, PFI and DSS in BC patients. High risk scores indicate poor survival outcomes in NMIBC patients receiving BCG treatment and BC patients receiving radiation therapy. The result indicated that the IAGs signature risk score may be used as a novel predictive factor of BC patients after BCG treatment and radiotherapy. Furthermore, multivariate Cox regression analysis confirmed that the IAGs based signature was independently related to the prognosis of BC. Moreover, the signature was closely related to the grade, stage, pathologic T, pathologic N, pathologic M, diagnostic type, lymphovascular invasion present and new tumour event after initial treatment in BC patients. Therefore, the IAGs based signature risk score may predict the occurrence and progression of BC. In addition, a nomogram integrated with IAGs based signature and clinical features was constructed, which can superiorly predict the survival outcomes of BC patients. TIMER was applied to identify the correlation between the risk score and the infiltration of immune cells in the BC microenvironment. The result indicated that the IAGs based signature was positively related to the infiltration of macrophages, which has been reported to promote the progression of BC [Citation17,Citation18]. In addition, RT-PCR showed that the expression of five IAGs was elevated in T24 cells and M2 TAMs can promote the expression of STAT1, CACYBP and CALR in T24 cells by secreting TGF-β1. M2 TAMs were associated with the progression of tumours and TGF-β1 was closely related to the proliferation, invasion and metastasis of tumours. Therefore, M2 TAMs mayinfluence the immune microenvironment of BC by secreting TGF-β1 to promote the recurrence and progression of BC.
Among these seven IAGs, ANXA6 can regulate IL-2 homeostasis and sensitivity in T cells [Citation19] and has been demonstrated that was correlated with the development of cancers, such as breast cancer and pancreatic cancer [Citation20,Citation21]. Chen et al. showed that ANXA6 could enhance the radioresistance of nasopharyngeal carcinoma by inhibiting PI3K/AKT/mTOR signalling pathway [Citation22]. AHNAK, a large structural scaffold protein, has been proven to be a prognostic biomarker in pancreatic ductal adenocarcinoma, glioma, as well as BC [Citation23–25]. Matza and Flavell found that AHNAK1 and Ca(v)1 alpha1 subunits are highly expressed in both helper (CD4+) and killer (CD8+) T cells and after their differentiation and require these molecules for Ca2+ entry during an immune response [Citation26]. In addition, AHNAK can also suppress lung cancer cell proliferation by inhibiting M2 alternative activation of macrophages [Citation27]. CACYBP, a calcyclin binding protein, was associated with the proliferation of cancer cells [Citation28,Citation29] and can serve as a prognostic biomarker in cancers [Citation30,Citation31]. Previous studies revealed that CACYBP can enhance the multidrug resistance of cancer cells to promote the progression of cancers by inhibiting the apoptosis of cancer cells [Citation32,Citation33]. Niu et al. suggested that CACYBP can promote the progression of gastric cancer by stimulating ubiquitin-mediated degradation of p27Kip1 [Citation29]. STAT1 can regulate T cell differentiation and macrophage type and exhibit tumour-suppressor properties by inhibiting tumour-related signalling pathways and promoting the immunosurveillance of tumours [Citation34,Citation35]. Zhang et al. showed that STAT1 inhibits the proliferation of colorectal cancer cells by modulating the PTEN/AKT signalling pathway [Citation36]. Ryan et al. indicated that STAT1 is an important regulator of the antitumor response by enhancing the immune responses of T-cell in a tumour [Citation37]. CLAR, a highly conserved chaperone protein, was associated with invasion and angiogenesis, antitumor immunity, and prognosis of tumours [Citation38,Citation39]. A previous study has also shown that extracellular CALR mediated the effects of immunomodulatory and suppressed the phagocytosis of dying cancer cells by dendritic cells, which can inhibit antitumor immune responses induced by chemotherapeutic drugs or by PD-1 blockade [Citation40]. In this study, a prognostic signature incorporating five IAGs was established based on transcriptomics data and proteomics data. The AUC of IAGs based signature was 0.739, which showed satisfactory accuracy in predicting the survival of patients with BC. These results indicated that the IAGs based signature can be applied to identify BC patients at high risk and enabling early interventions to improve the survival outcomes. Furthermore, we suggest that the IAGs based signature can also better reflect the immune status of BC patients. However, as a retrospective study, our research still has a bias due to heterogeneity, further experimental studies are needed to investigate the potential effects and mechanisms of these IAGs in the prognosis of BC.
In conclusion, we identified and validated an IAGs based signature, which can be applied as an independent predictor in evaluating the prognosis of BC patients. Furthermore, M2 TAMs may promote the expression of IAGs in BC via the TGF-β1 signalling pathway. Further clinical trials and experimental explorations are needed to validate the prognostic significance of the IAGs based signature in BC.
Ethics statement
The studies involving human participants were reviewed and approved by the Ethical review committees of The Affiliated Hospital of Qingdao University. The patients/participants provided their written informed consent to participate in this study.
supplementary_5.tif
Download TIFF Image (4.3 MB)Supplementary_4.docx
Download MS Word (20.6 KB)supplementary_3.tif
Download TIFF Image (574.7 KB)Supplementary_2.docx
Download MS Word (48.9 KB)supplementary_1.docx
Download MS Word (20.3 KB)Disclosure statement
The authors declare that they have no conflict of interest.
Data availability statement
The data used to support the findings of this study is included within the article, and the data are available from the corresponding author upon request.
Additional information
Funding
References
- Siegel RL, Miller KD, Jemal A. Cancer statistics, 2019. CA A Cancer J Clin. 2019;69(1):7–34.
- Babjuk M, Burger M, Compérat EM, et al. European association of urology guidelines on non-muscle-invasive bladder cancer (TaT1 and carcinoma in situ) – 2019 update. Eur Urol. 2019;76(5):639–657.
- Poli G, Egidi MG, Cochetti G, et al. Relationship between cellular and exosomal miRNAs targeting NOD-like receptors in bladder cancer: preliminary results. Minerva Urol Nefrol. 2020;72(2):207–213.
- Mearini E, Poli G, Cochetti G, et al. Expression of urinary miRNAs targeting NLRs inflammasomes in bladder cancer. Onco Targets Ther. 2017;10:2665–2673.
- Poli G, Brancorsini S, Cochetti G, et al. Expression of inflammasome-related genes in bladder cancer and their association with cytokeratin 20 messenger RNA. Urol Oncol. 2015;33(12):505.e1–505.e7.
- Schneider AK, Chevalier MF, Derré L. The multifaceted immune regulation of bladder cancer. Nat Rev Urol. 2019;16(10):613–630.
- Saad FT, Hincal E, Kaymakamzade B. Dynamics of immune checkpoints, immune system, and BCG in the treatment of superficial bladder cancer. Comput Math Methods Med. 2017;2017:3573082.
- Poli G, Cochetti G, Boni A, et al. Characterization of inflammasome-related genes in urine sediments of patients receiving intravesical BCG therapy. Urol Oncol. 2017;35(12):674.e19–674.e24.
- Felsenstein KM, Theodorescu D. Precision medicine for urothelial bladder cancer: update on tumour genomics and immunotherapy. Nat Rev Urol. 2018;15(2):92–111.
- Bhattacharya S, Andorf S, Gomes L, et al. ImmPort: disseminating data to the public for the future of immunology. Immunol Res. 2014;58(2–3):234–239.
- Robinson MD, McCarthy DJ, Smyth GK. edgeR: a Bioconductor package for differential expression analysis of digital gene expression data. Bioinformatics. 2010;26(1):139–140.
- Friedman J, Hastie T, Tibshirani R. Regularization paths for generalized linear models via coordinate descent. J Stat Softw. 2010;33(1):1–22.
- Robertson AG, Kim J, Al-Ahmadie H, et al. Comprehensive molecular characterization of muscle-invasive bladder cancer. Cell. 2018;174(4):1033.
- Shen C, Liu J, Wang J, et al. Development and validation of a prognostic immune-associated gene signature in clear cell renal cell carcinoma. Int Immunopharmacol. 2020;81:106274.
- Li T, Fan J, Wang B, et al. TIMER: a web server for comprehensive analysis of tumor-infiltrating immune cells. Cancer Res. 2017;77(21):e108–e110.
- Chanput W, Mes JJ, Wichers HJ. THP-1 cell line: an in vitro cell model for immune modulation approach. Int Immunopharmacol. 2014;23(1):37–45.
- Martínez VG, Rubio C, Martínez-Fernández M, et al. BMP4 induces M2 macrophage polarization and favors tumor progression in bladder cancer. Clin Cancer Res. 2017;23(23):7388–7399.
- Chen C, He W, Huang J, et al. LNMAT1 promotes lymphatic metastasis of bladder cancer via CCL2 dependent macrophage recruitment. Nat Commun. 2018;9(1):3826.
- Cornely R, Pollock AH, Rentero C, et al. Annexin A6 regulates interleukin-2-mediated T-cell proliferation. Immunol Cell Biol. 2016;94(6):543–553.
- Keklikoglou I, Cianciaruso C, Güç E, et al. Chemotherapy elicits pro-metastatic extracellular vesicles in breast cancer models. Nat Cell Biol. 2019;21(2):190–202.
- Leca J, Martinez S, Lac S, et al. Cancer-associated fibroblast-derived annexin A6+ extracellular vesicles support pancreatic cancer aggressiveness. J Clin Invest. 2016;126(11):4140–4156.
- Chen Q, Zheng W, Zhu L, et al. ANXA6 contributes to radioresistance by promoting autophagy via inhibiting the PI3K/AKT/mTOR signaling pathway in nasopharyngeal carcinoma. Front Cell Dev Biol. 2020;8:232.
- Lee H, Kim K, Woo J, et al. Quantitative proteomic analysis identifies AHNAK (neuroblast differentiation-associated protein AHNAK) as a novel candidate biomarker for bladder urothelial carcinoma diagnosis by liquid-based cytology. Mol Cell Proteomics. 2018;17(9):1788–1802.
- Zhang Z, Liu X, Huang R, et al. Upregulation of nucleoprotein AHNAK is associated with poor outcome of pancreatic ductal adenocarcinoma prognosis via mediating epithelial–mesenchymal transition. J Cancer. 2019;10(16):3860–3870.
- Zhao Z, Xiao S, Yuan X, et al. AHNAK as a prognosis factor suppresses the tumor progression in glioma. J Cancer. 2017;8(15):2924–2932.
- Matza D, Flavell RA. Roles of Ca(v) channels and AHNAK1 in T cells: the beauty and the beast. Immunol Rev. 2009;231(1):257–264.
- Park JW, Kim IY, Choi JW, et al. AHNAK loss in mice promotes type II pneumocyte hyperplasia and lung tumor development. Mol Cancer Res. 2018;16(8):1287–1298.
- Chen X, Mo P, Li X, et al. CacyBP/SIP protein promotes proliferation and G1/S transition of human pancreatic cancer cells. Mol Carcinog. 2011;50(10):804–810.
- Niu YL, Li YJ, Wang JB, et al. CacyBP/SIP nuclear translocation regulates p27Kip1 stability in gastric cancer cells. World J Gastroenterol. 2016;22(15):3992–4001.
- Lian YF, Huang YL, Zhang YJ, et al. CACYBP enhances cytoplasmic retention of P27Kip1 to promote hepatocellular carcinoma progression in the absence of RNF41 mediated degradation. Theranostics. 2019;9(26):8392–8408.
- Nie F, Yu XL, Wang XG, et al. Down-regulation of CacyBP is associated with poor prognosis and the effects on COX-2 expression in breast cancer. Int J Oncol. 2010;37(5):1261–1269.
- Chen X, Zheng P, Xue Z, et al. CacyBP/SIP enhances multidrug resistance of pancreatic cancer cells by regulation of P-gp and Bcl-2. Apoptosis. 2013;18(7):861–869.
- Tang Y, Zhan W, Cao T, et al. CacyBP/SIP inhibits doxourbicin-induced apoptosis of glioma cells due to activation of ERK1/2. IUBMB Life. 2016;68(3):211–219.
- Kang YH, Biswas A, Field M, et al. STAT1 signaling shields T cells from NK cell-mediated cytotoxicity. Nat Commun. 2019;10(1):912.
- Kemmner S, Bachmann Q, Steiger S, et al. STAT1 regulates macrophage number and phenotype and prevents renal fibrosis after ischemia-reperfusion injury. Am J Physiol Renal Physiol. 2019;316(2):F277–F291.
- Zhang X, Li X, Tan F, et al. STAT1 inhibits MiR-181a expression to suppress colorectal cancer cell proliferation through PTEN/Akt. J Cell Biochem. 2017;118(10):3435–3443.
- Ryan N, Anderson K, Volpedo G, et al. STAT1 inhibits T-cell exhaustion and myeloid derived suppressor cell accumulation to promote antitumor immune responses in head and neck squamous cell carcinoma. Int J Cancer. 2020;146(6):1717–1729.
- Liu XL, Zhao D, Sun DP, et al. Adenovirus-mediated delivery of CALR and MAGE-A3 inhibits invasion and angiogenesis of glioblastoma cell line U87. J Exp Clin Cancer Res. 2012;31(1):8.
- Kasikova L, Hensler M, Truxova I, et al. Calreticulin exposure correlates with robust adaptive antitumor immunity and favorable prognosis in ovarian carcinoma patients. J Immunother Cancer. 2019;7(1):312.
- Liu P, Zhao L, Loos F, et al. Immunosuppression by mutated calreticulin released from malignant cells. Mol Cell. 2020;77(4):748–760.e9.