
 ?Mathematical formulae have been encoded as MathML and are displayed in this HTML version using MathJax in order to improve their display. Uncheck the box to turn MathJax off. This feature requires Javascript. Click on a formula to zoom.
Abstract
Determination of thyroid-stimulating hormone (TSH) level in serum or plasma is defined as a sensitive method for the diagnosis of hyperthyroidism and hypothyroidism and also in many diseases thought to be related to TSH levels. In this study, a novel simple impedimetric immunosensor based on polyamidoamine dendrimer was developed. Anti TSH antibody was immobilized on the gold electrode by using cysteamine self-assembled monolayer strategy. In constructing the immunosensor, a polyamidoamine dendrimer was used to increase the surface area in which Antı-TSH was immobilized and glutaraldehyde was used as a cross-linker. After each immobilization step, the electrode surface was monitored by electrochemical impedance spectroscopy, cyclic voltammetry, scanning electron microscopy and energy-dispersive X-ray spectroscopy techniques and optimization studies were performed. The reproducibility, repeatability, linearity and sensitivity of the immunosensor were examined. Also, the interference experiments for glucose, salts and proteins in serum were performed. The limit of detection and limit of quantification values of the proposed immunosensor were 0.026 mIUL−1 and 0.086 mIUL−1, respectively and it was able to detect the amount of TSH within a linear range of 0.1–0.6 mIUL−1.
Introduction
Thyroid-stimulating hormone (TSH) is a glycoprotein having a molecular weight between 28 and 30 kDa. Human-TSH (hTSH) has two subunits, α- and β- subunits consist of 92 and 118 amino acids, respectively. α-subunit is structurally similar to that of follicle-stimulating hormone, luteinizing hormone, and human chorionic gonadotropin, β-subunit is specific to hTSH [Citation1]. It is a glycoprotein that is glycosylated in a manner similar to other glycoprotein hormones, which is composed of carbohydrate chains of about 20% of its molecular weight and includes three asparagine-linked carbohydrate chains [Citation1,Citation2].
TSH is synthesized and secreted from thyrotrophs of the anterior pituitary and stimulates the release of T3 and T4 hormones, which play a role in the regulation of metabolism and neural activity from the whole body, by stimulating the thyroid glands it reaches through the blood [Citation3].
The reference concentration of TSH in the serum is 0.45–4.12 mIUL−1 for adults and 0.4–5.9 mIUL−1 for elders over 70 years. However, the reference range of TSH in serum is still controversial and the Academy of Clinical Biochemistry recommended that the upper limit of the TSH reference range be lowered to 2.5 mIUL−1 [Citation4,Citation5]. The fact that the TSH concentration being higher and lower than the reference values is defined as hypothyroidism and hyperthyroidism, respectively [Citation6]. The Serum TSH levels which differ from reference values can be directly related to many diseases.
TSH is responsible for the regulation of human metabolism. It regulates the function of the nervous system, musculoskeletal system, and reproductive tissue. It is also critical in regulating body temperature, body weight, and blood cholesterol levels [Citation6–9]. The low TSH levels may lead to hypopituitarism, multinodular goitre, thyroid nodules, as well as Graves’ disease, and autonomic disease in which antibodies mimic TSH [Citation10,Citation11]. Hyperthyroidism may affect the cardiovascular system and may impair the quality of life by increasing heart rate and reducing exercise capacity. Besides, it may cause a decrease in bone mineral density [Citation12]. Also, Blood TSH concentration is a widely used biomarker for the early diagnosis of thyroid cancer [Citation13,Citation14].
When all this is evaluated, it is clear that there is a need for new methods that can detect the TSH levels at concentrations lower than 0.5 mIUL−1 and also at reference range, for many patients suffering from TSH related diseases [Citation15].
To this day, different measurement methods have been reported to determine the level of TSH, such as Radio-immunoassay (RIA) [Citation16], surface-enhanced Raman scattering [Citation17], Immunoradiometric assay (IRMA) [Citation18], fluorescence immunoassay [Citation19], enzyme-linked immunosorbent assay (ELISA) [Citation20] and immunochemiluminescent assay (ICMA) [Citation21]. While some of these methods have LOD (limit of detection) values less than 0.5 mIUL−1, they have some analytical disadvantages such as long sample preparation and analysis time and qualified personnel requirements. They are also not suitable for routine analysis and require expensive equipment.
The interest in electrochemical methods has increased with the developments in analytical methods in the last two decades [Citation22]. Due to their important advantages such as low instrumentation cost, high sensitivity, and selectivity, as well as the development of new materials for the modification of electrodes, electrochemical methods are widely used in the analysis of biological molecules such as dopamine, acetaminophen, levodopa, hydroxylamine, and glutathione [Citation23–26].
Biosensor technology is one of the good applications of electrochemical methods for hormone analysis and an alternative to advanced bioanalytical systems thanks to their portable and simple features. Biosensors based on potentiometry for the determination of testosterone and cortisol [Citation27,Citation28], kinetic exclusion analysis based biosensor for the determination of T3 and T4 [Citation29], and amperometry-based biosensors for the determination of insulin, epinephrine, vasopressin has been reported [Citation30–32].
Antibody-based biosensors for TSH determination are great advancement of analytical technology. Some of them also have been reported based on different techniques such as microfluidic electrochemical enzyme immunoassay [Citation33], lateral flow immunochromatographic assay [Citation34], enzyme immunoassay with chemiluminescence [Citation35], surface plasmon resonance [Citation36], kinetic exclusion analysis [Citation37], square-wave voltammetry [Citation38] and linear sweep voltammetry [Citation39]. These immunosensors generated a signal proportional to antibody–antigen interaction that could offer shorter fabrication times, lower cost, and higher sensitivity compared to other methods mentioned above.
In recent years, Electrochemical Impedance Spectroscopy (EIS) based impedimetric biosensors are interesting because of their short determination times, high sensitivity, low detection limits and simplicity. Impedimetric immunosensors have been developed for hormones such as oestrogen, parathyroid hormone, human growth hormone, insulin and TSH [Citation40–44]. The concentration of the target analyte can easily be determined with EIS by measuring the change in the charge transfer resistance that occurs when the antigen was bounded to the antibody immobilized on the working electrode surface. Nyquist curves obtained from EIS spectra are typically composed of two sections, linear and semicircular, and the diameter of the semicircle is used to calculate the charge transfer resistance on the surface of the working electrode [Citation45].
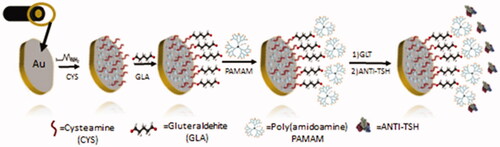
In this study, we proposed a simple and rapidly fabricated immunosensor based on EIS for the sensitive quantification of TSH. The self-assembled monolayer (SAM) strategy and PAMAM dendrimer were used for the immobilization of Anti-TSH on the electrode surface. Firstly, SAM was generated on the Au electrode surface using cysteamine. After, the PAMAM dendrimer was used for enhancing the surface area of the electrode, and the construction of the biosensor was completed with Anti-TSH immobilization using glutaraldehyde (GLT) as cross-linker.
Experimental
Materials and methods
TSH, Anti-TSH, Cysteamine, Glutaraldehyde, Serum Replacement Solution Potassium Ferricyanide, Potassium Ferrocyanide, and PAMAM dendrimer were purchased from Sigma-Aldrich (St. Louis, Missouri, USA). The TSH Anti-TSH were prepared at certain concentrations in ultra-pure water and stored at −20 °C until used. The artificial serum solution was prepared by using 4.5 mM KCl, 5 mM CaCl2, 4.7 mM (D+) glucose, 2.5 mM urea, and 145 mM NaCl in the serum replacement solution 3 which contained only human proteins such as human serum albumin, human recombinant insulin and human transferrin. Ag/AgCl reference electrode, platinum counter electrode and Working gold electrode were provided from BASI, Warwickshire, UK. Ag/AgCl reference electrode was stored in 3 M KCL solution until used. All electrochemical experiments were carried out by using a Gamry Interface 1000 Potentiostat/Galvanostat (Gamry Instruments, Warminster, USA) interfaced with a PC via an ECM Analyst software (Gamry Instruments, Warminster, USA).
Preparation of biosensor
Electrode cleaning is crucial to ensure that impurities from previous tests on the working electrode surface do not affect measurements. For this purpose, before each biosensor fabrication, a paste was prepared on a synthetic rayon (Buehler Microcloth PSA, Buehleri UK) using aluminium oxide (Al2O3 < 50 nm partical size) and a few drops of ultra-pure water, and the working electrode was slowly cleaned on this surface. After this process, to remove residual aluminium oxide particles on the working electrode surface, the working electrode was washed with purified water and incubated in absolute ethanol (99.9%) (v/v) for 5 min, then it was incubated in ultra-pure water for 5 min in the ultrasonic water bath. Then it was dried with pure argon and called as bare electrode (Au-BARE) in this study.
For Self Assembled Monolayer (SAM) formation on the electrode surface, the cleaned working electrode (bare electrode) was incubated for 1 h in 0.1 M cysteamine solution prepared in absolute ethanol (99.9%) (v/v). At the end of this period, the working electrode surface was washed with pure ethanol and then with ultra-pure water to remove the remaining cysteamine molecules from the surface (Au-BARE-CYS). In the second step, the working electrode was incubated in 1% glutaraldehyde (v/v) solution (as a cross linker between PAMAM and SAM) for 10 min. The working electrode was then incubated for 1 h in 1.5% PAMAM (w/v) in methanol in order to increase the number of amino groups on the surface thereby increasing the success of immobilization (Au-BARE-CYS-PAMAM). Then PAMAM modified working electrode was incubated for 10 min in 1% Glutaraldehyde (v/v) solution and then incubated with 2.5 ng/5 µL Anti TSH for 1 h. Finally, the biosensor was washed with ultra-pure water to remove unbounded antibodies from the SAM modified electrode surface and dried with pure argon. At the end of this step, the biosensor construction was completed (Au-BARE-CYS-PAMAM-ANTI_TSH). The total fabrication time period of the biosensor is quite short, such as 200 min and production of the biosensor does not require much chemical diversity. All steps of the construction of the biosensor were shown in Scheme 1. Also, the cyclic voltammograms and EIS spectra of each immobilization step of the ANTI_TSH are shown in ,b).
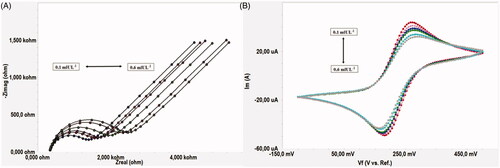
Figure 1. (A) EIS spectra of each immobilisation step of the ANTI_TSH [-■-■-(pink): Au-BARE, -▲-▲- (green): Au-BARE-CYS, -●-●- (red): Au-BARE-CYS-PAMAM, -♦-♦- (blue): Au-BARE-CYS-PAMAM-ANTI_TSH]. (B) Cyclic voltammograms of each immobilisation step of the ANTI_TSH [-■-■-(blue): Au-BARE, -▲-▲- (light green): Au-BARE-CYS, -●-●- (red): Au-BARE-CYS-PAMAM, -♦-♦- (dark green): Au-BARE-CYS-PAMAM-ANTI_TSH].
![Figure 1. (A) EIS spectra of each immobilisation step of the ANTI_TSH [-■-■-(pink): Au-BARE, -▲-▲- (green): Au-BARE-CYS, -●-●- (red): Au-BARE-CYS-PAMAM, -♦-♦- (blue): Au-BARE-CYS-PAMAM-ANTI_TSH]. (B) Cyclic voltammograms of each immobilisation step of the ANTI_TSH [-■-■-(blue): Au-BARE, -▲-▲- (light green): Au-BARE-CYS, -●-●- (red): Au-BARE-CYS-PAMAM, -♦-♦- (dark green): Au-BARE-CYS-PAMAM-ANTI_TSH].](/cms/asset/b9b9762e-c177-4297-9e56-1a6fc0dfe7bf/ianb_a_1867153_f0001_c.jpg)
Scheme 1. Construction of the biosensor.
Principals of the electrochemical measurements
The proposed biosensor was first cleaned and prepared as described above. Cyclic voltammograms and EIS spectra were obtained after each immobilization step to determine the success of immobilization steps and the electrochemical behaviour of the biosensor. Also, EIS was used to determine the TSH levels in samples. EIS is an effective method for determining charge transfer resistances (Rct) and the concentration of the target analyte is related to Rct which is calculated from the semicircular diameter of Nyquist curves. For this purpose, EIS spectrums were obtained at different concentrations of TSH (0.1–0.6 mIUL−1) and Rcts were calculated from EIS spectrums which were analyzed by fitting to the Nyquist plots via Gamry Potentiostat ECM Analyst software. The standard calibration graph was plotted between different TSH concentrations versus Rct values. Rct values at different TSH concentrations were calculated using the following equation:
Where Rct(ANTI-TSH) was defined as Rct value after ANTI-TSH was immobilized on the electrode surface and Rct(ANTI–TSH/TSH) was defined as the Rct value after TSH was attached to ANTI-TSH. CV and EIS measurements were performed in a redox probe solution (K3[Fe(CN)6/K4[Fe(CN)6] solution (1:1) containing 0.1 M KCl). CV measurements were performed in the potential range of −0.5 to 1.0 V with a step size of 1 mV and a scanning rate of 50 mV/s. EIS measurements were performed at 5 mV alternating current, impedance spectra frequency range was 10,000–0.05 Hz.
Scanning electron microscopy and energy-dispersive X-ray spectroscopy investigations
Identification of the basic composition and monitoring of the structural morphology of the bare and modified electrodes were performed by scanning electron microscopy (SEM) with energy-dispersive X-ray spectroscopy (EDX) at Trakya University Technology Research and Development Centre (TUTAGEM). An acceleration voltage was 5 kV.
Results and discussion
Anti-TSH immobilization and optimization
Cysteamine was used for the formation of SAM for the immobilization of ANTI-TSH to the bare electrode surface. Cysteamine is a highly suitable molecule for SAM formation reactions due to its stable structure. It is a highly active molecule due to its thiol (–SH) and amine (–NH2) functional groups. When the gold electrode is incubated with cysteamine for a certain period of time, the thiol group of cysteamine provides the formation of SAM. Therefore, it has been used frequently in biosensor designs [Citation46–48].
The uniform formation of SAM on the bare electrode surface affects the success of the next immobilization steps. Therefore, the concentration of cysteamine used for SAM formation is very important and needs to be optimized. In order to determine the optimum cysteamine concentration for the formation of SAM, four biosensors were fabricated using four different concentrations of cysteamine (10, 50, 100 and 150 mM), and EIS spectra were obtained from seven different TSH concentrations (0.1–0.7 mIUL−1) for each biosensor. The calibration graphs were plotted between TSH concentrations versus Rct values calculated from EIS spectra by using ECM Analyst software and it was shown in . Rct values were calculated as the average of 3 biosensor responses at same TSH concentration.
Figure 2. Calibration graphs of biosensors prepared using different cysteamine concentration; [-●-●-(blue): 10 mM CYS, -●-●- (dark grey): 50 mM CYS, -●-●- (green): 100 mM CYS, -●-●- (red): 150 mM CYS].
![Figure 2. Calibration graphs of biosensors prepared using different cysteamine concentration; [-●-●-(blue): 10 mM CYS, -●-●- (dark grey): 50 mM CYS, -●-●- (green): 100 mM CYS, -●-●- (red): 150 mM CYS].](/cms/asset/f4c7b6f5-bbac-43da-bdc1-5a5848433853/ianb_a_1867153_f0002_c.jpg)
As seen in , the biosensor responses were affected by cysteamine concentrations. The correlation coefficient (R2) values were calculated as 0.9751, 0.9443, 0.9903 and 0.9281 from the calibration graph plotted for biosensors fabricated using 10, 50, 100 and 150 mM cysteamine, respectively. The R2 value indicates how well the regression model fits the observed data. The closer the R2 value is to 1.00, the higher the accuracy of the biosensor responses obtained. Although relatively high Rct values were obtained for the biosensors fabricated using lower concentrations (10 and 50 mM) of cysteamine, R2 values were lower compared to the biosensor prepared using 100 mM CYS. This may be due to insufficient CYS concentration for regular SAM formation. Deviation in Rct values was an expected result, as an irregular SAM formation would result in irregular antibody binding. The highest Rct values were obtained with the biosensor fabricated using 150 mM cysteamine, but it had the lowest R2 value. The reason for this situation may be that excessive use of CYS caused excess antibody accumulation on the surface and therefore deviations were inevitable although high Rct values were obtained. Although the biosensor fabricated using 100 mM cysteamine had a relatively low Rct value, it had a very good R2 value of 0.9903. Therefore, the optimum concentration of cysteamine was selected as 100 mM and it was used for biosensor fabrication in further studies.
In the second step of the optimization studies, the incubation period of cysteamine was optimized after determining the optimum cysteamine concentration required for the uniform formation of SAM. For this purpose, three different biosensors were fabricated by incubating with 100 mM cysteamine solution for 30, 60 and 90 min. EIS spectra were obtained for each biosensors. The responses of biosensors were shown in . Rct values were calculated as the average of 3 measurements.
Figure 3. Calibration graphs of biosensors prepared using different cysteamine incubation times; [-●-●-(blue): 30 min, -●-●- (green): 60 min, -●-●- (orange): 90 min].
![Figure 3. Calibration graphs of biosensors prepared using different cysteamine incubation times; [-●-●-(blue): 30 min, -●-●- (green): 60 min, -●-●- (orange): 90 min].](/cms/asset/42172ac4-24bc-477d-9286-74c59f4b9e64/ianb_a_1867153_f0003_c.jpg)
R2 values were calculated as 0.9162, 0.9903 and 0.8993 from the calibration graph plotted for biosensors fabricated using 100 mM cysteamine for 30 min, 60 min and 90 min incubation period, respectively. As shown in , a low R2 value and a relatively low biosensor response were obtained when the bare electrode was allowed to incubate for 30 min with cysteamine. This low R2 value showed that the short incubation time was not sufficient for the uniform SAM formation and this was an expected result. The lowest R2 value was obtained in the biosensor prepared with 90 min incubation period. This can be explained by the fact that the increasing incubation period adversely affects SAM formation. The optimum cysteamine incubation period was determined as 60 min due to the highest biosensor responses and best R2 value obtained after this incubation period. After this stage of the study, the cysteamine incubation period was used as 60 min for the fabrication of the biosensor.
The next step in the optimization studies was the determination of optimum PAMAM concentration to observe the effect of PAMAM concentration on biosensor responses. For this purpose, three different biosensors were fabricated by using PAMAM at 1, 1.5 and 2% (w/v) concentrations, respectively. EIS measurements for different TSH concentrations were performed 3 times and Rct values were calculated as the average of these measurements. Calibration curves were obtained from the EIS spectra for each biosensor. The results were shown in and R2 values were calculated as 0.9855, 0.9904, and 0.9653 from the calibration graph for biosensors fabricated using 1.0, 1.5 and 2.0% (w/v) PAMAM, respectively.
Figure 4. Calibration graphs of biosensors prepared using different concentrations of PAMAM (w/v); [-●-●-(blue): 1.0%, -●-●- (red): 1.5%, -●-●- (green): 2.0%].
![Figure 4. Calibration graphs of biosensors prepared using different concentrations of PAMAM (w/v); [-●-●-(blue): 1.0%, -●-●- (red): 1.5%, -●-●- (green): 2.0%].](/cms/asset/818b9ac6-d5c6-4437-84e7-d8dc24c9df49/ianb_a_1867153_f0004_c.jpg)
Increased PAMAM concentration yields more functional groups for antibody immobilization. Thus, more antibodies can be immobilized to the electrode surface. Therefore, as it is seen in , higher biosensor responses were obtained with measurements at low TSH concentrations with the biosensors prepared using high PAMAM concentration. However, decreases in biosensor responses were observed in measurements at increasing TSH concentrations. High PAMAM concentration on the electrode surface may increase the number of non-specific interactions and unwanted cross-links. And also diffusion problems may be observed. For these reasons, biosensor responses and R2 values can be adversely affected. Low biosensor responses were obtained with biosensors fabricated using low PAMAM concentration, due to an insufficient number of functional groups in which the antibody would bind to the electrode surface. As shown in , PAMAM concentration of 1.5% (w/v) was determined as the optimum PAMAM concentration with the best R2 value (0.9904) and the highest biosensor response.
The last step for the fabrication of the biosensor was the determination of the optimum concentration of ANTI-TSH on the electrode surface. For this purpose, three different biosensors were fabricated using 1, 2.5 and 5 ng/5 µL Anti-TSH concentrations. Calibration graphs between different TSH concentrations and Rct values calculated from Nyquist curves obtained from EIS spectra for each biosensor were shown in . Rct values were calculated as the average of 3 measurements. Also, R2 values obtained from these graphs and curve equations were shown in .
Figure 5. Calibration graphs of biosensors fabricated using different ANTI-TSH concentrations [-●-●-(green): 1 ng/5 µL, -●-●- (red): 1 ng/5 µL, -●-●- (blue): 1 ng/5 µL].
![Figure 5. Calibration graphs of biosensors fabricated using different ANTI-TSH concentrations [-●-●-(green): 1 ng/5 µL, -●-●- (red): 1 ng/5 µL, -●-●- (blue): 1 ng/5 µL].](/cms/asset/0553a9b1-b63f-4ab6-b357-766425daa357/ianb_a_1867153_f0005_c.jpg)
Table 1. R2 values and curve equations obtained from biosensors fabricated using different ANI-TSH concentrations.
An increase in the amount of ANTI-TSH immobilized on the electrode surface is expected to cause a higher rate of antigen-binding of the antibody and thus lead to an increase in Rct. As shown in , the highest biosensor responses were obtained from the biosensor fabricated using the highest ANTI-TSH concentration (5 ng/5 µL). However, the R2 value obtained with this biosensor was found to be relatively low (0.8252). A possible increase in the number of undesirable cross-links at high antibody concentrations may cause a decrease in the antigen specificity of the antibody. Similar biosensor responses were obtained with biosensors prepared using antibodies at anti-TSH concentrations of 1 and 2.5 ng/5 µL. Anti-TSH concentration of 2.5 ng/5 µL was determined as the optimum antibody concentration due to better R2 value.
The Laviron equation is a useful method for estimating the concentration of electroactive species on an electrode surface and it is used to prove the success of immobilisation [Citation49,Citation50]. The Laviron equation is as follows: Q = n × F × A × Г; where F is the constant of Faraday, n is the slope of the graphs plotted versus the peak currents (determined from CVs obtained at 10 different scan rate (10–100 mVs−1)), A is the surface area of the electrode, Г is the amount of electroactive molecule on the electrode surface and Q is the charge [Citation51]. The amount of the electroactive molecules on the bare electrode and biosensor (Au-BARE-CYS-PAMAM-ANTI_TSH) were calculated as 2.23 × 10⁻⁴ mol/cm2, and 2.46 × 10⁻⁴ mol/cm2, respectively. The Г value of the biosensor is higher than obtained with the bare electrode, indicating that the immobilization of Anti-TSH was successful.
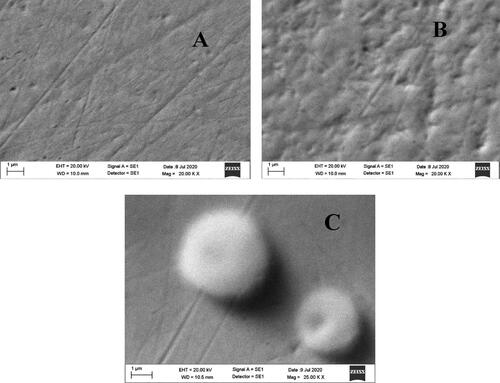
Also, we used SEM with EDX to identify the basic composition of the electrode and to monitor its structural morphology. The SEM images were given in . shows Au bare electrode (Au-BARE), shows the image after modification of SAM with PAMAM (Au-BARE-CYS-PAMAM) and shows the image anti-PTH immobilization (Au-BARE-CYS-PAMAM-ANTI_TSH). shows that the surface topography showed a good definition of a smooth gold surface. shows that the covering of the surface by cysteamine SAM resulted in a cloudlike appearance. shows that the immobilization of ANTI_TSH caused a sponge-like structure on the electrode surface.
Figure 6. SEM images of the designed biosensor; Au-BARE (A), Au-BARE-CYS-PAMAM (B), Au-BARE-CYS-PAMAM-ANTI_TSH (C).
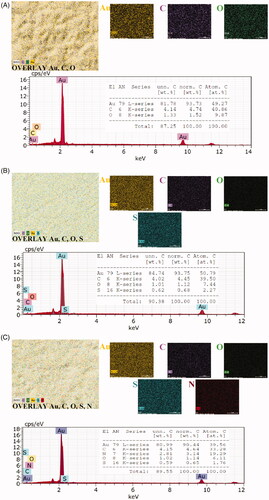
EDX is an X-ray technique used to identify the elemental composition of materials. In order to prove the SAM layer formation on the electrode surface and PAMAM modification of the surface, elemental mapping analyses with EDX were performed. EDX elemental mapping and spectra were shown in . Au bare electrode surface had gold (Au), oxygen (O), carbon (C) elements (). The sulphur (S, light green) element was observed differently from the Au bare electrode after SAM formation using cysteamine on the surface of the gold electrode (). This result showed that SAM was formed on the gold electrode surface. As seen in , after PAMAM modification of SAM, the electrode surface had Au, O, C, S and nitrogen (N, Red) elements. The observation of 3.14% N on the electrode surface as a result of the PAMAM modification indicates that the PAMAM modification has been successfully performed. In addition, the visual change in overlay elemental maps from clearly shows the change in the electrode surface.
Figure 7. EDX elemental mapping and spectra of Au-BARE (A), Au-BARE-CYS (B), Au-BARE-CYS-PAMAM (C).
Analytical characteristics of the biosensor
In order to determine the linear determination range of the proposed biosensor, six different biosensors were fabricated under optimum immobilization conditions [CYS (100 mM, 60 min), GLA (1%), PAMAM (1.5%), GLA (1%), ANTI-TSH (2.5 ng/5 µL)]. CV and EIS spectrums were obtained in the range of 0.1–0.6 mIUL−1 TSH concentration. Rct values as biosensor response were obtained within 3 min and biosensor responses for each TSH concentration were calculated using the averages of Rct values were obtained from six different biosensors. The relationship with increasing TSH concentrations and Rct values were shown in . In addition, this linear relationship between TSH concentrations and Rct values was confirmed by anodic and cathodic current changes in cyclic voltammograms at increasing TSH concentrations. Cyclic voltammograms were given in .
Figure 8. (A) Electrochemical impedance spectra obtained as Nyquist curves for different TSH concentrations. (B) Cyclic voltammograms obtained for different TSH concentrations.
As it is seen from , Rct values increased due to increasing TSH concentration. This was confirmed by the decrease in peak currents at increasing TSH concentrations, as shown in . The calibration graph plotted between Rct values obtained from Nyquist curves and TSH concentrations are given in . As shown in , the determination range of the proposed biosensor is in the range of 0.1–0.6 mIUL−1 and the R2 value is 0.9882.
Figure 9. Calibration graph of proposed biosensor.
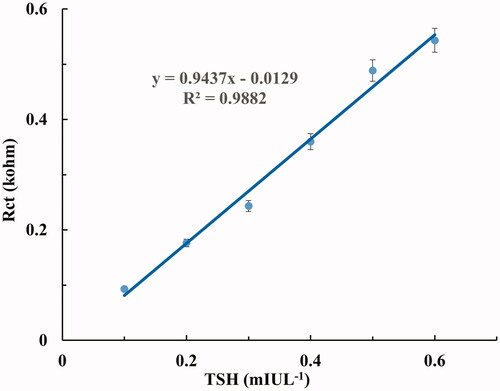
Also, according to the IUPAC recommendations, the limit of quantification (LOQ) and limit of detection (LOD) were calculated as 0.086 and 0.026 mIUL−1, respectively [Citation52],. These results showed that the proposed biosensor has a high sensitivity for the quantification and detection of TSH. Comparison between the proposed biosensor and other methods were shown in . Electrochemical biosensors based on Square-Wave Voltammetry (SWV), Linear Sweep Voltammetry (LSV) and EIS have been reported for detection of TSH [Citation38,Citation39,Citation44]. The detection limit of the proposed biosensor (0.026 mIUL−1) was close to SWV based biosensor (0.04 mIUL−1) and LSV based biosensor (0.012 mIUL−1). The EIS based biosensor had the lowest detection limit (0.001 mIUL−1). The detection limit of the proposed biosensor is lower than the detection limits of the other methods shown in [Citation33–37].
Table 2. Comparison between the proposed biosensor and other methods.
The average TSH concentration in serum has been reported as 1.82 ± 0.994 mIUL−1 for a healthy population. Since the normal serum TSH concentration lower limit is 0.35 mIUL−1, the proposed biosensor can be a useful tool for the diagnosis of hyperthyroidism and monitoring the treatment process [Citation53]. In addition, it is an important advantage that the proposed biosensor can be simply fabricated in a short time (200 min) using a few chemicals. As seen in the sensitivity of the proposed biosensor is better than those of other commercial immunoassay methods reported by different researchers.
In order to determine the reproducibility of the proposed biosensor, 7 different biosensors were prepared under optimal immobilization conditions and the EIS spectrums were obtained from the concentration range of 0.1–0.6 mIUL−1 TSH. The results obtained from the calibration graphs plotted between the TSH concentrations and Rct values calculated from the EIS spectra were shown in . The results showed that the proposed biosensor can be used reproducibly for TSH detection and measurement.
Table 3. Reproducibility of biosensor.
Furthermore, in order to determine the interference effect of glucose, proteins and salts in serum on the biosensor response, TSH levels were measured by using biosensors prepared under optimal immobilization conditions in artificial serum samples. The results were given in .
Table 4. The analysis results of TSH in artificial serum samples.
As shown in , the glucose, salts and proteins in the artificial serum do not affect the biosensor responses. This shows that the proposed biosensor has the potential to detect TSH with high precision.
Conclusions
As a result, an EIS-based PAMAM modified simple biosensor proposed in this study, which can determine the TSH concentration with high precision, inexpensively and quickly, was developed. The recommended biosensor fabrication time period is quite short and can determine TSH within 3 min without being affected by glucose salts and proteins. The proposed biosensor may be a good alternative to immunoassay methods used to determine TSH concentration. Also, the biosensor has a determination range (0.1–0.6 mIUL−1) which has lower limits than the reference values. In this context, it may come to the fore as an analytical tool with high potential for the diagnosis of hyperthyroidism and for monitoring the treatment process. It is also clear that using diluted samples can be a suitable tool for analyzing TSH levels above reference values.
Disclosure statement
No potential conflict of interest was reported by the author(s).
Additional information
Funding
References
- Szkudlinski MW, Fremont V, Ronin C, et al. Thyroid-stimulating hormone and thyroid-stimulating hormone receptor structure-function relationships. Physiol Rev. 2002;82(2):473–502.
- Papaleontiou M, Cappola AR. Thyroid-stimulating hormone in the evaluation of subclinical hypothyroidism. JAMA. 2016;316(15):1592–1593.
- Rugge JB, Bougatsos C, Chou R. Screening and treatment of thyroid dysfunction: an evidence review for the U.S. preventive services task force. Ann Intern Med. 2015;162(1):35–45.
- Biondi B. The normal TSH reference range: what has changed in the last decade? J Clin Endocrinol Metab. 2013;98(9):3584–3587.
- Kratzsch J, Fiedler GM, Leichtle A, et al. New reference intervals for thyrotropin and thyroid hormones based on National Academy of Clinical Biochemistry criteria and regular ultrasonography of the thyroid. Clin Chem. 2005;51(8):1480–1486.
- Moreno M, de Lange P, Lombardi A, et al. Metabolic effects of thyroid hormone derivatives. Thyroid. 2008;18(2):239–253.
- Iwen KA, Schröder E, Brabant G. Thyroid hormones and the metabolic syndrome. Eur Thyroid J. 2013;2(2):83–92.
- Tarım Ö. Thyroid hormones and growth in health and disease. J Clin Res Pediatr Endocrinol. 2011;3(2):51–55.
- Kochupillai N, Mehta M. Iodine deficiency disorders and their prevention in India. Rev Endocr Metab Disord. 2008;9(3):237–244.
- Tvito-Green R, Reich E, Robenshtok E, et al. Third-generation ELISA thyrotropin-receptor antibody levels as an adjuvant tool to guide management of patients with Graves orbitopathy. Endocr Pract. 2014;20(2):145–149.
- You DJ, Park TS, Yoon JY. Cell-phone-based measurement of TSH using Mie scatter optimized lateral flow assays. Biosens Bioelectron. 2013;40(1):180–185.
- Bernadette B, David SC. The clinical significance of subclinical thyroid dysfunction. Endoc Rev. 2008;1:76–131.
- Wu XY, Lun Y, Jiang H, et al. Coexistence of thyroglobulin antibodies and thyroid peroxidase antibodies correlates with elevated thyroid-stimulating hormone level and advanced tumor stage of papillary thyroid cancer. Endocrine. 2014;46(3):554–560.
- Duran AO, Anil C, Gursoy A, et al. The relationship between thyroid volume and malignant thyroid disease. Med Oncol. 2014;31:814.
- Christ-Crain M, Meier C, Roth CB, et al. Basal TSH levels compared with TRH-stimulated TSH levels to diagnose different degrees of TSH suppression: diagnostic and therapeutic impact of assay performance. Eur J Clin Invest. 2002;32(12):931–937.
- Glinoer D, Spencer CA. Serum TSH determinations in pregnancy: how, when and why? Nat Rev Endocrinol. 2010;6(9):526–529.
- Choi S, Hwang J, Lee S, et al. Quantitative analysis of thyroid-stimulating hormone (TSH) using SERS-based lateral flow immunoassay. Sensors Actuators: B. Chem. 2017;240:358–364.
- Wilson R, Semple CG, Reid AM, et al. Can thyroid stimulating hormone levels by TSH (IRMA) predict relapse of thyrotoxicosis following carbimazole treatment. Postgrad Med J. 1987;63(743):755–756.
- Ahn J, Shin YB, Lee J, et al. Human alpha-fetal protein immunoassay using fluorescence suppression with fluorescent-bead/antibody conjugate and enzymatic reaction. Biosens Bioelectron. 2015;71:115–120.
- Wang D, Skinner JP, Ruan QQ, et al. Affinity assisted selection of antibodies for Point of Care TSH immunoassay with limited wash. Clin Chim Acta. 2015;438:55–61.
- Liu Y, Zhang Q, Wang H, et al. An electrochemiluminescence immunosensor for thyroid stimulating hormone based on polyamidoamine-norfloxacin functionalized Pd-Au core-shell hexoctahedrons as signal enhancers. Biosens Bioelectron. 2015;71:164–170.
- Beitollahi H, Safaei M, Tajik S. Different electrochemical sensors for determination of dopamine as neurotransmitter in mixed and clinical samples: a review. Anal Bioanal Chem Res. 2019;6(1):81–96.
- Beitollahi H, Sheikhshoaie I. Novel nanostructure-based electrochemical sensor for simultaneous determination of dopamine and acetaminophen. Mater Sci Eng: C. 2012;32(2):375–380.
- Ganjali MR, Salimi H, Tajik S, et al. Application of Fe3O4@SiO2/MWCNT film on glassy carbon electrode for the sensitive electroanalysis of levodopa. Int J Electrochem Sci. 2017;12:5243–5253.
- Moghaddam HM, Beitollahi H, Tajik S, et al. Simultaneous determination of hydroxylamine and phenol using a nanostructure-based electrochemical sensor. Environ Monit Assess. 2014;186(11):7431–7441.
- Soltani H, Beitollahi H, Hatefi-Mehrjardi A, et al. Voltammetric determination of glutathione using a modified single walled carbon nanotubes paste electrode. Anal Bioanal Electrochem. 2014;6:67–79.
- Liang KZ, Qi JSG, Mu WJ, et al. Biomolecules/gold nanowires-doped sol–gel film for label-free electrochemical immunoassay of testosterone. J Biochem Biophys Meth. 2008;(70):156–1162.
- Tlili C, Myung NV, Shetty V, et al. Label-free, chemiresistor immunosensor for stress biomarker cortisol in saliva. Biosens Bioelectron. 2011;26(11):4382–4386.
- Wani TA, Zargar S, Majid S, et al. Analytical application of flow immunosensor in detection of thyroxine and triiodothyronine in serum. Assay Drug Dev Technol. 2016;14(9):535–542.
- Kaur A, Verma N. Electrochemical biosensor for monitoring insulin in normal individuals and diabetic mellitus patients. Eur J Exp Biol. 2012;2(2):389–395.
- Felix FS, Yamashita M, Angnes L. Epinephrine quantification in pharmaceutical formulations utilizing plant tissue biosensors. Biosens Bioelectron. 2006;21(12):2283–2289.
- He P, Oncescu V, Lee S, et al. Label-free electrochemical monitoring of vasopressin in aptamer-based microfluidic biosensors. Anal Chim Acta. 2013;759:74–80.
- Shamsi MH, Choi K, Ng AH, et al. A digital microfluidic electrochemical immunoassay. Lab Chip. 2014;14(3):547–554.
- Langén VL, Niiranen TJ, Puukka P, et al. Thyroid-stimulating hormone and risk of sudden cardiac death, total mortality and cardiovascular morbidity. Clin Endocrinol. 2018;88(1):105–113.
- Jung W, Han J, Kai J, et al. An innovative sample-to-answer polymer lab-on-a-chip with on-chip reservoirs for the POCT of thyroid stimulating hormone (TSH). Lab Chip. 2013;13(23):4653–4662.
- Salahvarzi A, Mahani M, Torkzadeh-Mahani M, et al. Localized surface plasmon resonance based gold nanobiosensor: determination of thyroid stimulating hormone. Anal Biochem. 2017;516:1–5.
- Wani TA, Zargar S, Wakil SM, et al. New analytical application of antibody-based biosensor in estimation of thyroid-stimulating hormone in serum. Bioanalysis. 2016;8(7):625–632.
- Smaniotto A, Mezalira DZ, Zapp E, et al. Electrochemical immunosensor based on an azo compound for thyroid-stimulating hormone detection. Microchem J. 2017;133:510–517.
- Wang H, Wu X, Dong P, et al. Electrochemical biosensor based on ınterdigitated electrodes for determination of thyroid stimulating hormone. Int J Electrochem Sci. 2014;9(1):12.
- Im J, Han J, Kim BK, et al. Electrochemical detection of oestrogen hormone by immobilized estrogen receptor on Au electrode. Surf Coat Technol. 2010;205:S275–S278.
- Ozcan HM, Sezgıntürk MK. Detection of parathyroid hormone using an electrochemical impedance biosensor based on PAMAM dendrimers. Biotech Progress. 2015;31:815–822.
- Rezaei B, Khayamian T, Majidi N, et al. Immobilization of specific monoclonal antibody on Au nanoparticles for hGH detection by electrochemical impedance spectroscopy. Biosens Bioelectron. 2009;25(2):395–399.
- Xu M, Luo X, Davis JJ. The label free picomolar detection of insulin in blood serum. Biosens Bioelectron. 2013;39(1):21–25.
- Saxena R, Srivastava S. A sensitive and one-step quantification of thyroid stimulating hormone using nanobiosensor. Mater Today: Proc. 2019;18(3):1351–1357.
- Bahadır EB, Sezgintürk MK. Electrochemical biosensors for hormone analyses. Biosens Bioelectron. 2015;68:62–71.
- Canbay E, Akyilmaz E. Design of a multiwalled carbon nanotube-Nafion-cysteamine modified tyrosinase biosensor and its adaptation of dopamine determination. Anal Biochem. 2014;444:8–15.
- Yang Y, Yang M, Wang H, et al. An amperometric horseradish peroxidase inhibition biosensor based on a cysteamine self-assembled monolayer for the determination of sulfides. Sensors Actuators: B. Chem. 2004;102(1):162–168.
- Sezgintürk MK, Uygun ZO. An impedimetric vascular endothelial growth factor biosensor-based PAMAM/cysteamine-modified gold electrode for monitoring of tumor growth. Anal Biochem. 2012;423(2):277–285.
- Lanzellotto C, Favero G, Antonelli ML, et al. Nanostructured enzymatic biosensor based on fullerene and gold nanoparticles: preparation, characterization and analytical applications. Biosens Bioelectron. 2014;55:430–437.
- Yagati AK, Lee T, Min J, et al. An enzymatic biosensor for hydrogen peroxide based on CeO2 nanostructure electrodeposited on ITO surface. Biosens Bioelectron. 2013;47:385–390.
- Laviron E. General expression of the linear potential sweep voltammogram in the case of diffusionless electrochemical systems. J Electro Chem. 1979;101(1):19–28.
- McNaught AD, Wilkinson A. Compendium of chemical terminology. Oxford (UK): Blackwell Science; 1997.
- Li H, Yuan X, Liu L, Et al. Clinical evaluation of various thyroid hormones on thyroid function. Int J Endoc. 2014;2014:1–5.