
 ?Mathematical formulae have been encoded as MathML and are displayed in this HTML version using MathJax in order to improve their display. Uncheck the box to turn MathJax off. This feature requires Javascript. Click on a formula to zoom.
Abstract
This study aimed to examine the pharmacological profiles of multiple chemo drug candidates in systematic circulation to enhance their specific interactions with five human cancer cell lines. ZnO nanoparticles were successfully bound with chemo drugs via physical adsorption. The drug loading capacity was confirmed by FTIR, whereas the loading efficiency was determined via UV–vis spectrometry. The mean hydrodynamic size increased to 69–82 nm after chemo-drug immobilization via non-covalent interaction with ZnO. Among the nine formulated chemo drugs, the carboplatin (CP)–doxorubicin (DOX)–ZnO complex under UV light irradiation exhibited high sensitivity towards human breast adenocarcinoma cells without affecting human keratinocyte immortal cells with an IC50 of 0.137 µg/mL, whereas the loading capacity and efficiency of CP–DOX–ZnO were 77.81% and 99.05%, respectively. Fluorescence images confirmed that CP–DOX–ZnO using DOX served as a fluorescence enhancer specifically bound onto the cell membranes, which became almost saturated after 24 h incubation. Carboplatin–DOX–ZnO was possibly endocytosed by cancer cells and was selectively internalized into the target cells; thus, free chemo drug was released in the cytoplasm, which induced acute apoptosis. This resulted in complete inhabitation of growth signal of target cancer cells.
Introduction
The development of effective chemotherapeutic agents remains a top priority for biomedical research worldwide because cancer still represents a significant threat to human health. Although currently, numerous treatment modalities are employed for tumour management, they have their own shares of drawbacks, such as toxicity due to non-specific action, side effects and chemoresistance that might develop during the treatment. Furthermore, the dosage of chemo drugs required to reach the targeted tumour site, which is associated with variations in individual patients, tumour microenvironments and complications in the molecular biology of cancer, is still under debate (). Sometimes, administering single chemo drugs for a long period of time is a challenging task because of the development of chemoresistance and severe side effects [Citation1–13]. A double-chemo drug regimen is sufficient for very small tumours [Citation14–18], whereas other chemo drugs might be used if these methodologies are not effective [Citation19,Citation20]. Meanwhile, some research progress has been made in nanoparticle-assisted drug delivery systems with different dosages for better treatment of cancer [Citation2–8]. To further improve the killing effect in the tumour microenvironment, a minimum dosage of multiple drug-loaded nanoparticles is a favoured modality for long-term anticancer therapy. It is hypothesized that their appropriate formulations can encapsulate or adsorb the antigen or DNA and thus increase the cellular uptake and immunogenicity so that drugs can be released into the cell and distribution into the target sites can be easily controlled.
Table 1. Reported studies on therapeutic agents used for cancer treatment in the past 5 years.
In this study, we classify double-drug loaded nanoparticles and address some pharmacological parameters influencing drug efficacy. A basic understanding of these relationships will enable a more rational design of drug-loaded nanoparticle formulations, including zinc oxide (ZnO), doxorubicin (DOX) and carboplatin (CP); furthermore, UV light irradiation could be used as a stimulus. The formulated drug–nanoparticle complexes were prepared through physical adsorption and were then tested on several cell lines and with an oxidative assay DPPH. In addition, the mechanisms of molecular pathways governing cell death via these complexes are explained.
This study is novel because a combination of ZnO nanoparticles, which can response to light, and two types of drugs, which can enhance the anticancer effect compared with one type of drug, is studied. We chose ZnO nanoparticles as the nanocarrier in this study because they exhibit good anti-angiogenesis and anti-inflammatory properties for sustained drug release [Citation21]. Furthermore, the cellular cytotoxicity of ZnO nanoparticles depends on the concentration and reaction time. DOX offers an excellent fluorescence signal [Citation4], whereas a combination of ZnO and CP with UV ray offers an enhanced response of oxidizers [Citation22].
Methods
Materials
ZnO, 1,1-diphenyl-2-picrylhydrazyl as the putative model of cancer cells (DPPH*), and DOX were purchased from Sigma-Aldrich (Singapore). CP was obtained from the Faculty of Medicine Ramathibodi Hospital (Bangkok, Thailand). Foetal bovine serum (FBS), Dulbecco’s modified Eagle’s medium (DMEM), dimethylsulphoxide (DMSO) and phosphate-buffered saline (PBS) were purchased from Sigma-Aldrich (Singapore). Absolute methanol was bought from Honeywell (London, UK). Physiological saline solution was purchased from GH Products (Bangkok, Thailand).
Cell culture
Human colon adenocarcinoma (HT-29), human oral cavity carcinoma (KB), human cervical adenocarcinoma (HeLa), human hepatocarcinoma (HepG-2) and human breast adenocarcinoma (MCF-7) cell lines were obtained from Scientific Instrument Center, Faculty of Science, King Mongkut’s Institute of Technology Ladkrabang (Bangkok, Thailand). Human keratinocyte immortal cells (HaCat) were used as the control cell line. All cells were cultured in flasks in DMEM containing 10% FBS in an incubator at 37 °C with 5% CO2 for 24 h, according to a previous protocol [Citation23]. After washing twice with PBS to remove non-adherent cells, the adhered cells were resuspended in the culture medium at the final density of 5 × 10⁴ cells/mL which were then ready for optical microscopic and spectroscopic measurements.
Chemo drug preparation
Combinations of chemo drugs against DPPH* and human cell lines were prepared as follows. Three stock solutions were used: first, a nanocarrier comprising 388.95 µM of ZnO nanoparticles dispersed in methanol; second, a chemo drug comprising 16.31 µM CP liquid dissolved in saline solution; and third, chemo drug comprising 5.39 µM DOX powder dissolved in saline solution. After homogenization of five different concentrations of chemo drug combinations as displayed in (5 min of vortex for 30 min at 27 °C), ZnO was blended in the mix of chemo drugs (5 min of vortex for 24 h at 27 °C). The weight ratio of ZnO:(CP + DOX) was preserved at 5:1, in accordance with a previous protocol [Citation4,Citation22]. The mix solution was centrifuged at 5000 rpm for 15 min to obtain the pellet-bound chemo drug compound. The clear supernatant liquid was analysed via UV–vis spectrometry (Avantes AvaSpec, Louisville, CO) to obtain absorbance and fluorescence data and determine the fluorescence quantum yield [Citation24]. The first set of residues was employed for the physical characterization. To the second set of residues, we added 1 mL methanol and sonicated the samples for 5 min to form the suspension chemo drug that was used for the cytotoxicity test.
Table 2. Detailed preparation of chemo drug under various binding conditions.
Physical characterization
Morphological changes caused by each chemo drug – DOX + ZnO, CP + ZnO and CP + DOX + ZnO – in a comparison to a blank ZnO sample were observed via transmission electron microscopy (JEOL-JEM-1400, Tokyo, Japan). The zeta potential and size distribution were observed via dynamic light scattering (Malvern Zetasizer ZSP, Worcestershire, UK). Infra-red spectra were examined via Fourier transform infra-red spectroscopy (PerkinElmer Inc., Buckinghamshire, UK).
Antiradical test against DPPH*
For comparison of antioxidant activity of each chemo drug on DPPH* by the DPPH protocol [Citation22,Citation23], 1 mL of individual chemo drug solution was dispensed in a sterile test tube and sonicated with 2 mL of 0.1 nM methanolic DPPH* for 90 min. Six chemo drugs were tested without UV exposure for 24 h at 37 °C, while other three were introduced into the 8 W, 400 nm UV chamber for 24 h at 37 °C (Spectroline: CX-21, Kleinblittersdorf, Germany). The treated solution was centrifuged, and the clear supernatant liquid was used to obtain absorbance and fluorescence data using the same UV-Vis spectrometer to determine the inhibitory concentration at 50% inhibition (IC50). The absorbance values of unloaded drug and released drug in the supernatants based on these UV–vis analyses were also used to determine the drug loading capacity, loading efficiency and drug release rate under pH 6.0 [Citation4].
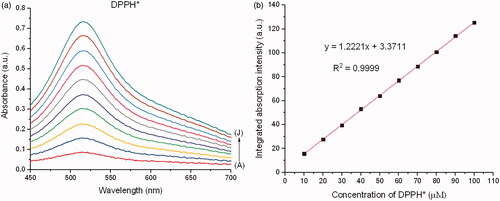
A calibration curve with a known amount of DPPH* was generated at a wavelength of 515 nm using the formula (). A reduction in the absorbance peak of DPPH* caused by each chemo drug was observed at 515 nm under 0–720 min reaction time till the reactant were completely utilized, after which no further reduction in the absorbance peak was observed. A decrease in the integrated absorption intensity corresponding to the reaction time was plotted for each chemo drug. The remaining DPPH* with respect to the reaction time was calculated using Residual DPPH*
where Abs is the absorbance value of DPPH*, COC is the concentration of DPPH* at the original condition and CEC is the concentration of DPPH* at the equilibrium condition. IC50 was finally determined using the remaining DPPH* at the state of equilibrium with respect to the molar proportion of the chemo drug to DPPH*.
Figure 1. (a) Absorbance and (b) calibration curve at the various concentrations of DPPH*. A, B, C, D, E, F, G, H, I and J represent 10, 20, 30, 40, 50, 60, 70, 80, 90 and 100 µM of DPPH*, respectively.
Antitumor test against human cell lines
For comparative proliferation and apoptosis of human cell lines by each chemo drug via the MTT protocol [Citation25], 0.1 mL of individual formulated chemo drug solution was exposed to 0.2 mL of the cell suspension in 96-well plates. The ranges of concentrations of free DOX and free CP were 0.34–5.39 and 8.42–16.31 µM, respectively. The concentrations of CP and DOX were maintained at 6.25 µg/mL. The six chemo drugs were tested without UV exposure for 24 h at 37 °C, while the other three were introduced into the 8 W, 400 nm UV chamber for 24 h at 37 °C (Spectroline: CX-21, Kleinblittersdorf, Germany). The UV lamp was placed at a distance of 20 cm from the cell line suspension in 96-well plates. Then, 10 µL MTT (5 mg/mL in PBS) was added to the cells in each well and was incubated for 4 h at 37 °C. After 4 h of incubation, the supernatant was aspirated and 100 µL of 100% DMSO was added to each well. The optical density was measured at a wavelength of 570 nm after 30 min incubation to ensure the organization of adsorption–desorption equilibrium between drug-loaded ZnO and human cell lines. The cytotoxicity was determined as where AbsC is the absorbance value of the control before chemo drug treatment and AbsS is the average absorbance value of the sample after chemo drug treatment. IC50 was determined using the GraphPad Prism Software (La Jolla, CA).
As UV-light penetration is weak in vivo, UV-induced cell inhibition was analysed as a control in this study. After the incubation period for the internalization of chemo drugs into human cell lines, optical microscopy was performed to obtain phase contrast images of the treated cells for quantification, and fluorescence microscopy was employed to analyse the position and integrity of the internalized chemo drugs into the same group of cells. As DOX is a fluorescent probe with a bright red colour when visualized with a red filter, images of cellular uptake of the live cells were obtained without adding any staining solution. The fluorescent intensity was quantified by flow cytometry (FCM model: BD FACSCanto, Piscataway, NJ). R-phycoerythrin (R-PE) was used as the fluorescence signal.
Statistical analysis
All experimental data generated and presented in tables and figures as the mean value were obtained from triplicate experiments using ANOVA followed by the Bonferroni post hoc test (p<.05).
Results
TEM and DLS data
ZnO has a mean diameter of approximately 50 nm (). Due to the high ratio of surface active sites of the nanoadsorbent to adsorbate, the numbers of active adsorption sites were sufficient to accommodate adsorbates (chemo drugs), making them more superior in the targeted chemo drug delivery purposes. ZnO (zeta potential = 40 mV) surrounded by the layers of chemo drugs is affected by the viscosity and concentration of chemo drug solutions; thus, this affects the binding strength of drug-loaded ZnO (zeta potential = 17–24 mV). The aggregated particle size of drug-loaded ZnO had a mean value of 69–82 nm ().
Figure 2. TEM images of the formulated chemo drugs: (a) ZnO, (b) DOX + ZnO, (c) CP + ZnO and (d) CP + DOX + ZnO. CP: carboplatin; DOX: doxorubicin; ZnO: zinc oxide nanoparticles.
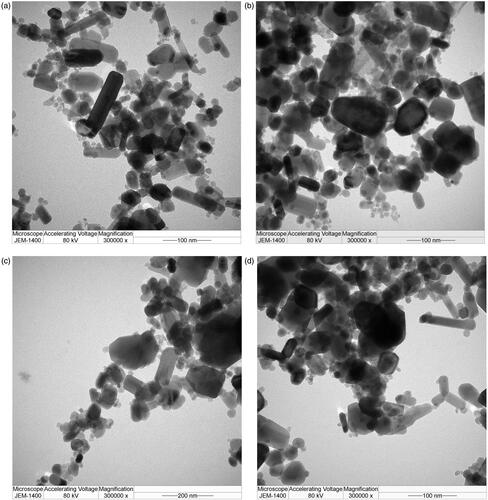
Table 3. Quantities of chemo drug in DPPH*.
FTIR data
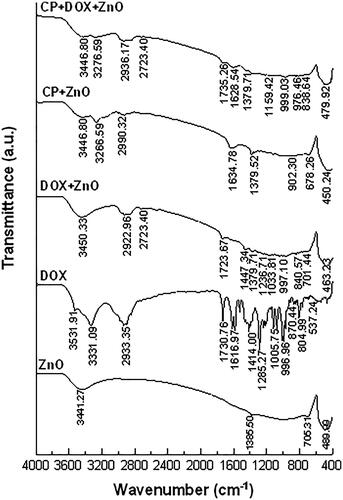
FTIR spectra of ZnO nanoparticles () showed an intense peak at 400–500 cm−1 (Zn–O) and a broad peak at 3331–3441 cm−1 (O–H) [Citation26,Citation27]. FTIR spectra of DOX exhibited multiple peaks at 1285 cm−1(C–O), 1414 cm−1 (C–C), 1617 cm−1 (N–H), 1730 cm−1 (C–O), 2933 cm−1 (C–H) and 3331–3441 cm−1 (O–H) [Citation28]. FTIR spectra of CP showed multiple peaks at 1379 cm−1 (Pt-NH2), 1634 cm−1 (C–O), 2990 cm−1 (C–H) and 3266 cm−1 (N–H) [Citation29]. The peaks of the FTIR spectra of CP–DOX–ZnO complexes were slightly shifted to 1159 cm−1 (C–O), 1379 cm−1 (C–C), 1628 cm−1 (N–H), 1735 cm−1 (C–O) and 2936 cm−1 (C–H).
Figure 3. FTIR spectra of the formulated chemo drugs before UV-irradiation on DPPH*.
Fluorescence quantum yield
presents the absorbance, fluorescence and calculated fluorescence quantum yield of DOX and CP + DOX before and after ZnO adsorption. The absorbance and fluorescence peaks of drug-loaded ZnO nanoparticles were centred around 485 and 594 nm, respectively. Similar to CP + DOX, the absorbance of DOX was reduced after ZnO adsorption because of the poor absorption of incident photon energy by DOX–ZnO complexes present in the ground state getting excited to the excited state. The integrated absorption and fluorescence intensities obtained by absorbance and fluorescence spectra at a reaction time of 0 min were used to understand the fluorescence quantum yield and are summarized in . The fluorescence quantum yield of native CP was undetectable because it is a non-fluorescent substance. The fluorescence quantum yield of DOX was quenched and was further quenched after ZnO adsorption, whereas the fluorescence quantum yield of DOX + CP was observed and was further enhanced after ZnO adsorption. The fluorescence quantum yield of CP + DOX + ZnO (0.860) was the highest.
Figure 4. (a) Absorbance, (b) fluorescence and (c) fluorescence quantum yield of DOX, before and after ZnO adsorption at a reaction time of 0 min. A, B, C, D and E represent 5.39, 2.69, 1.35, 0.67 and 0.34 µM of DOX, respectively. (d) Absorbance, (e) fluorescence and (f) fluorescence quantum yield of CP + DOX, before and after ZnO adsorption at a reaction time of 0 min. Notably, DOX or CP + DOX remained in the supernatant after facilitating adsorption to the drug-loaded nanoparticle complexes. Absorbance and fluorescence peaks are centred at 485 and 594 nm, respectively. See Ref. [Citation24] for detailed equations of fluorescence quantum yield.
![Figure 4. (a) Absorbance, (b) fluorescence and (c) fluorescence quantum yield of DOX, before and after ZnO adsorption at a reaction time of 0 min. A, B, C, D and E represent 5.39, 2.69, 1.35, 0.67 and 0.34 µM of DOX, respectively. (d) Absorbance, (e) fluorescence and (f) fluorescence quantum yield of CP + DOX, before and after ZnO adsorption at a reaction time of 0 min. Notably, DOX or CP + DOX remained in the supernatant after facilitating adsorption to the drug-loaded nanoparticle complexes. Absorbance and fluorescence peaks are centred at 485 and 594 nm, respectively. See Ref. [Citation24] for detailed equations of fluorescence quantum yield.](/cms/asset/c71f6782-a492-4f76-9282-75001cefe956/ianb_a_1876718_f0004_c.jpg)
Cytotoxicity data
Based on the reaction kinetics shown in , the nine formulated chemo drugs were classified into two groups. Group 1 belongs to intermediate reaction kinetics, indicating that the equilibrium of adsorption efficiency is considerably fast (CP, CP + ZnO, DOX, DOX + ZnO and CP + DOX). Group 2 belongs to slow reaction kinetics, showing that the equilibrium of adsorption efficiency is longer than that of group 1 (CP + DOX + ZnO, CP + ZnO + UV, DOX + ZnO + UV and CP + DOX + ZnO + UV). Among group 2, CP + DOX + ZnO + UV was found to be suitable for targeted chemo drug delivery purposes because the number of reduced DPPH* was the highest (135.135).
Although the loading capacity of CP + DOX + ZnO + UV of 77.81% indicates the saturation of immobilized drugs in cancer cells, the high loading efficiency of 99.05% confirms that the required drug dosage needed to reach the targeted tumour site is successfully achieved (). In addition, the drug release rate of this formulated chemo drug under different binding ratios under the acidic intracellular environment (pH = 6.0) is approximately 80% (). Thus, ZnO is possibly directed to the tumour site and can selectively release the chemo drugs under the acidic microenvironment of the tumour tissue.
Table 4. Representative drug release rate of CP + DOX + ZnO + UV under different binding ratios (pH = 6.0).
Integrated absorption intensities and disappearance of DPPH* from each chemo drug with respect to the reaction times are shown in . The reaction times were 0–720 min, and the molar ratio of ZnO to the chemo drug was 5:1. Disappearance of the DPPH* peak with respect to the peak of the drug–DPPH* interaction was therefore used to determine the inhibitory concentration (IC50) of each chemo drug, as shown in . IC50 of DPPH* from each chemo drug conforms to IC50 of human cancer cell lines from each chemo drug as shown in . Although CP + DOX + ZnO + UV is not sensitive to the human normal cell line (HaCat), it showed a significant decrease in cellular antitumor levels, which increased its synergistic cytotoxicity for all human cancer cell lines, especially for MCF-7. The IC50 value of released CP + DOX + ZnO was 0.208 µg/mL, which was improved to 0.137 µg/mL after UV exposure in the MCF-7 cell lines. The IC50 value of free DOX as a control group was 1.528 µg/mL. The IC50 value of CP + DOX + ZnO + UV decreased by approximately 1.5 and 11.1 folds in comparison to those of CP + DOX + ZnO and free DOX, respectively. These data indicate that CP + DOX + ZnO + UV is efficiently released and internalized more than CP + DOX + ZnO, conforming to the high reduction in DPPH* shown in .
Figure 5. Integrated absorption intensities of DPPH* caused by (a) DOX, (b) DOX + ZnO and (c) DOX + ZnO + UV as a function of reaction time from 0 to 720 min at different concentrations of DOX. Disappearance of DPPH* caused by (d) DOX, (e) DOX + ZnO and (f) DOX + ZnO + UV as a function of reaction time from 0 to 720 min at different concentrations of DOX. Molar ratio of ZnO to DOX is 5:1. A, B, C, D and E represent 5.39, 2.69, 1.35, 0.67 and 0.34 µM of DOX, respectively.
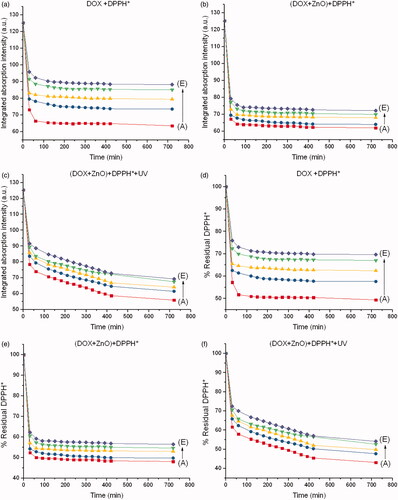
Figure 6. Integrated absorption intensities of DPPH* caused by (a) CP, (b) CP + ZnO and (c) CP + ZnO + UV as a function of reaction time from 0 to 720 min at different concentrations of CP. Disappearance of DPPH* caused by (d) CP, (e) CP + ZnO and (f) CP + ZnO + UV as a function of reaction time from 0 to 720 min at different concentrations of CP. Molar ratio of ZnO to CP is 5:1. A, B, C, D and E represent 16.31, 15.78, 14.73, 12.63 and 8.42 µM of CP, respectively.
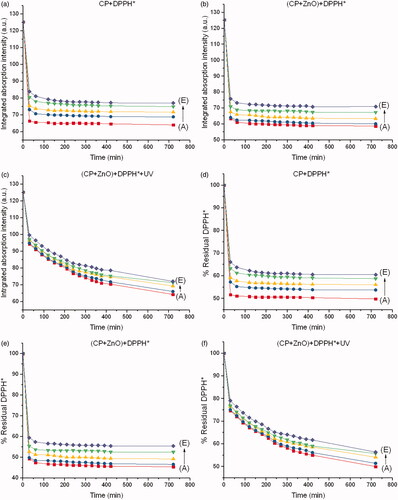
Figure 7. Integrated absorption intensities of DPPH* caused by (a) CP + DOX, (b) CP + DOX + ZnO and (c) CP + DOX + ZnO + UV as a function of reaction time from 0 to 720 min at different ratios of CP and DOX. Disappearance of DPPH* caused by (d) CP + DOX, (e) CP + DOX + ZnO and (f) CP + DOX + ZnO + UV as a function of reaction time from 0 to 720 min at different ratios of DOX and CP. Molar ratio of ZnO to (CP + DOX) is 5:1. A, B, C, D and E represent CP:DOX = 1:1, 3:1, 7:1, 15:1 and 31:1, respectively.
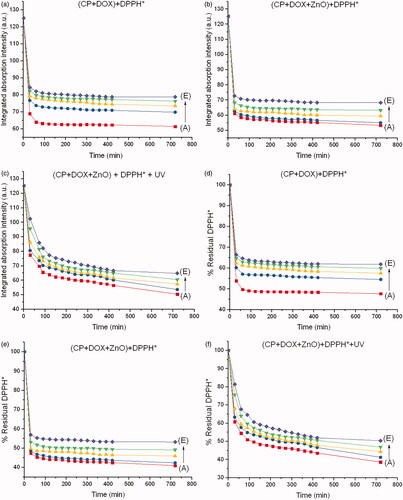
Figure 8. Disappearance of DPPH* at a steady state with respect to drug-DPPH*. (a) Molar ratio of ZnO to DOX is 5:1. (b) Molar ratio of ZnO to CP is 5:1. (c) Molar ratio of ZnO to (CP + DOX) is 5:1. IC50 value of each formulated chemo drug is also presented.
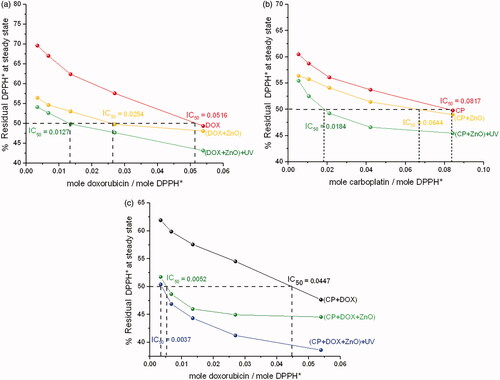
Table 5. Comparative cytotoxicity of chemo drug in DPPH* in comparison to human cancer cell lines from triplicate experiments, p<.05 using ANOVA followed by the Bonferroni post hoc test.
Different human cell lines have different sensitivities to each formulated chemo drug depending on the differentiation level and structural differences of cell lines. Phase contrast and fluorescence images of human cell lines cultured in the absence and presence of CP + DOX + ZnO + UV after 24 h incubation are displayed in and . confirms the mean fluorescent intensity (MFI) with corresponding cellular apoptosis, which was obtained using flow cytometry analysis. A significant number of ZnO transported into the cells [Citation21] emits intense intrinsic fluorescence caused by DOX to track the live cells [Citation4], whereas CP enhances the response of oxidizers under UV exposition [Citation22]. The cytoplasm of the live cells was therefore visualized in red. Human normal cell lines (HaCat) mostly remain viable after 24 h incubation because no specific cancer-cell targeting motifs are functionalized with ZnO and cell viability is possibly caused by the excessive production of reactive oxygen species (). The cell viability of HaCat treated by CP + DOX + ZnO + UV was 88.11% (), indicating that the formulated chemo drug could be used for targeted chemo drug delivery. As UV-light penetration is weak in vivo, UV-induced cell inhibition was analysed as a control; although 400 nm UV light does not easily cause DNA/RNA damage because of the low photon energy, long UV exposure times may cause slight DNA/RNA damage. Thus, the cytotoxicity of all cell lines under UV irradiation was approximately 8.20%. Therefore, the photochemical destruction of drugs under UV light in CP + DOX + ZnO was approximately 3.69%.
Figure 9. (a) Phase contrast images of human normal cell lines (HaCat) after incubation for 24 h under UV light. (b) Fluorescence image of human normal cell lines (HaCat) after incubation for 24 h in the presence of CP + DOX + ZnO + UV. Cytoplasm of live cells is shown in red. Scale bar indicates 50 µm.
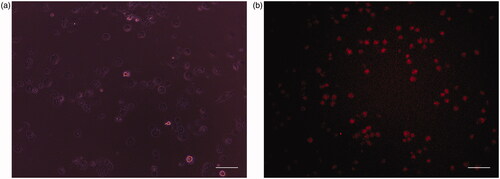
Figure 10. (a1) Phase contrast image of human breast adenocarcinoma (MCF-7) cells after incubation for 24 h under UV light. (a2) Fluorescence images of human breast adenocarcinoma (MCF-7) cells after incubation for 24 h in the presence of CP + DOX + ZnO + UV. (b1) Phase contrast images of human hepatocarcinoma (HepG-2) cells after incubation at 24 h under UV light. (b2) Fluorescence images of human hepatocarcinoma (HepG-2) after incubation at 24 h in the presence of CP + DOX + ZnO + UV. (c1) Phase contrast images of human cervical adenocarcinoma (HeLa) cells after incubation for 24 h under UV light. (c2) Fluorescence images of human cervical adenocarcinoma (HeLa) after incubation for 24 h in the presence of CP + DOX + ZnO + UV. (d1) Phase contrast images of human oral cavity carcinoma (KB) cells after incubation for 24 h under UV light. (d2) Fluorescence images of human oral cavity carcinoma (KB) after incubation for 24 h in the presence of CP + DOX + ZnO + UV. (e1) Phase contrast images of human colon adenocarcinoma (HT-29) cells after incubation for 24 h under UV light. (e2) Fluorescence images of human colon adenocarcinoma (HT-29) cells after incubation for 24 h in the presence of CP + DOX + ZnO + UV. Cytoplasm of the live cells is visualized in red. Scale bar indicates 50 µm.
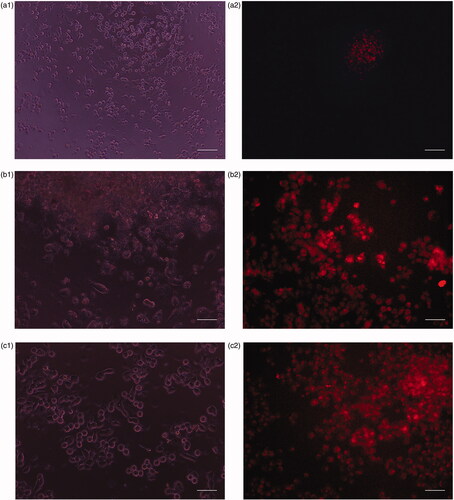
Figure 11. Representative median fluorescence intensity (MFI) and the percentages of cellular apoptosis treated by CP + DOX + ZnO + UV from three independent experiments analysed by flow cytometry, p<.05 using ANOVA followed by the Bonferroni post hoc test.
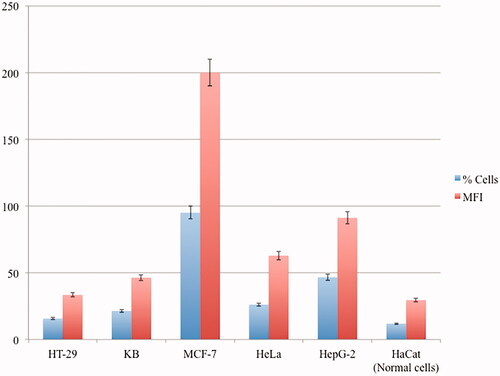
Among human cancer cell lines, MCF-7 is remarkably sensitive to CP + DOX + ZnO + UV after 24 h incubation; the fluorescence image showed few live cells, indicating the highest cytotoxicity using MFI data along with the smallest dosage (IC50 CP–DOX–ZnO = 0.137 µg/mL). The chemo drugs released from CP + DOX + ZnO + UV through slow kinetics gradually kill the cells (). As the intercalating antitumor agent, it has to be in the target cells effectively. The red fluorescence in images derived from DOX was strong after 24 h incubation, which allowing the tracking of live cells. Furthermore, the IC50 value of CP–DOX–ZnO was 0.137 µg/mL in the MCF-7 cell line, which is lower than that numbers reported in previous studies, especially when two chemo drugs are loaded with the help of nanocarriers. Galam et al. showed that CP-loaded silk fibroin particles had an IC50 of 10–200 μg/mL in MCF-7 cells [Citation2]. Ouyang et al. reported that DOX-loaded pectin nanoparticles had an IC50 of 1–5 μg/mL in MCF-7 cells [Citation3]. Locharoenrat showed that DOX-loaded nanodiamond exhibited an IC50 of 0.4 mg/mL in MCF-7 cells [Citation4].
Discussion
Surface characterization
CP tends to enhance the binding ratio of CP:DOX because of the large amount of surface area available and the large number of free adsorption sites provided by DOX molecules and ZnO nanoparticles. The stronger binding sites are occupied first, and the binding strength decreases as more sites are occupied. With further increase in CP dosage, the adsorption efficiency including loading capacity would not increase significantly because both the surface of ZnO and chemo drug concentration settle to equilibrium. Drug-loaded ZnO with a mean diameter of 69–82 nm is finally obtained, and this value cannot be further increased. Spherical and cylindrical particles exhibit the highest cellular uptake in terms of weight and quantity, respectively. These particles are acceptable for systematic circulation of intravenous chemotherapy (50–300 nm) [Citation30].
FTIR spectra of the formulated chemo drugs were divided into three major fractions in terms of the compositions of drugs: ZnO structure (400–500 cm−1) [Citation26,Citation27], CP structure (1379 cm−1) and DOX structure (1730 cm−1). The FTIR spectra of CP–DOX–ZnO complexes were slightly shifted because of effect of ester linkage between chemo drugs and ZnO nanoparticles. These unique spectral peaks confirm that the hydrophilic molecules of chemo drugs are successfully adsorbed onto the ZnO surface. FTIR analyses further confirmed that the loading capacity of chemo drug does not cause any alterations in the crystalline nature of the ZnO nanocarrier with respect to vibration frequencies. The broad peak at 3331–3441 (O–H) can be attributed to the migration of the chemo drug to the periphery of ZnO along with water molecules and atmospheric moisture [Citation26].
Intracellular uptake
The in vitro cellular uptake of CP + DOX + ZnO + UV by human breast adenocarcinoma cell line MCF-7 was significantly enhanced, which effectively triggered the apoptotic activity in comparison to loading a single drug. The strongest efficiency of suppressing tumour growth through the abundant accumulation of this antitumor agent was caused because of the following reasons. One, the cell killing effect by native ZnO nanoparticles is not caused by the toxicity of ZnO, which conforms with the results reported in previous studies [Citation21,Citation22]. Two, DOX, as a cell proliferation and apoptotic marker, provides specific recognition fluorescence signals. The phenomenon is attributed to the fact that DOX emits a strong red fluorescence signal, even at low concentrations, and reduces the usage of staining solution required for in vitro and in vivo applications. Furthermore, a DOX dosage of 0.1953 µg/mL in this study is safe for treatment of cardiomyopathy. The incidence rate of cardiomyopathy is no later than 4% when patients are treated with a DOX dosage of 49.11–307.70 mg/m2 [Citation31]. Three, because of the particle size of the formulated chemo drug (69–82 nm), ZnO nanoparticles carrying chemo drugs are taken up by cell membrane surface of the target cells via endocytosis, followed by release of the free chemo drug molecules into the cell cytoplasm under a low pH environment and under UV irradiation, as confirmed by the research group of Meshkini [Citation32,Citation33], who claimed that methotrexate-loaded ZnO–Fe2O3 complexes under UV light irradiation improved MCF-7 cellular apoptosis as compared to free methotrexate and UV alone without affecting normal cells. DOX-loaded ZnO-hydroxyapatite complexes enhanced the MCF-7 cellular death as compared to free DOX and UV alone. Four, a band gap containing the semiconductor (ZnO) could create electron–hole pairs under UV irradiation, as confirmed by numerous research groups previously [Citation34–37]. The electrons are generated in the conduction band, whereas holes are generated in the valence band. Some of these charge carriers spread to the crystal surfaces of ZnO and react with the adsorbed water molecules to generate reactive oxygen species, which act as toxic-peroxidative substances and are responsible for inducing ss radical damage and subsequently destructing the N–H bonds in the nuclei. Five, the growth signal of target cancer cells is eventually inhibited by the passive diffusion of the chemo drug into the nucleus. Thus, this combination chemotherapy depresses the proliferation level of cancer cells, resulting in cell death. Due to the excellent antioxidant and cytotoxic properties of CP + DOX + ZnO against human tumours under UV light, this nanoparticle-mediated delivery regime of chemo drugs is a good candidate for effective treatment of human breast adenocarcinoma (MCF-7).
Conclusions
In this study, we reported the preparation of drug-loaded ZnO nanoparticles and its enhanced anticancer activity by UV light irradiation in five human cancer cell lines – human colon adenocarcinoma (HT-29), human oral cavity carcinoma (KB), human cervical adenocarcinoma (HeLa), human breast adenocarcinoma (MCF-7) and human hepatocarcinoma (HepG-2). The size of drug-loaded ZnO increased significantly because of physical adsorption through non-covalent interaction between the chemo drugs and ZnO. TEM images indicated the mean size of the blank ZnO increased from 48 to 69–82 nm after two-drug adsorption onto ZnO. For detection of cell membrane potential and quantification of cell proliferation and apoptosis incidences, nine formulated chemo drugs on the human cancer cell lines were performed after the cell lines were treated for 24 h incubation determined by MTT assay. Among the nine formulated chemo drugs, CP–DOX–ZnO complexes under UV light showed a remarkably enhanced accumulation in human breast adenocarcinoma (MCF-7) and had a superior cancer inhibitory activity (IC50 of CP–DOX–ZnO = 0.137 µg/mL). Based on UV–vis studies, CP–DOX–ZnO loading capacity was 77.81%, which was confirmed by FTIR spectra. The loading efficiency of CP–DOX–ZnO was 99.05%, thereby confirming that the required drug dosage needed to reach the targeted tumour site was successfully achieved. Cellular uptake of chemo drugs from ZnO nanoparticles was confirmed by fluorescence measurements. This finding suggested that CP–DOX–ZnO complexes under UV light irradiation exhibited excellent chemo drug delivery efficiency to the target sites to attenuate oxidative stress activity in human breast adenocarcinoma (MCF-7).
Disclosure statement
The authors declare that they have no conflicts of interest.
Data availability statement
All data and material used to support the findings of this study are included within the article.
Additional information
Funding
References
- Smith SJ, Pulido JS, Salomão DR, et al. Combined intravitreal and subconjunctival carboplatin for retinoblastoma with vitreous seeds. Br J Ophthalmol. 2012;96(8):1073–1077.
- Galam N, Tulay P, Adali T. In vitro MCF-7 cells apoptosis analysis of carboplatin loaded silk fibroin particles. Molecules. 2020;25(5):1110.
- Ouyang J, Yang M, Gong T, et al. Doxorubicin-loading core–shell pectin nanocell: a novel nanovehicle for anticancer agent delivery with multidrug resistance reversal. PLoS One. 2020;15(6):e0535090.
- Locharoenrat K. Efficacy of nanodiamond–doxorubicin complexes on human breast adenocarcinoma cell lines. Artif Cells Nanomed Biotechnol. 2019;47(1):4053–4058.
- Xia Y, Tang G, Wang C, et al. Functionalized selenium nanoparticles for targeted siRNA delivery silence Derlin1 and promote antitumor efficacy against cervical cancer. Drug Deliv. 2020;27(1):15–25.
- Xia Y, Tang G, Guo M, et al. Silencing KLK12 expression via RGDfC-decorated selenium nanoparticles for the treatment of colorectal cancer in vitro and in vivo. Mater Sci Eng C Mater Biol Appl. 2020;110:110594.
- Xia Y, Zhong J, Zhao M, et al. Galactose-modified selenium nanoparticles for targeted delivery of doxorubicin to hepatocellular carcinoma. Drug Deliv. 2019;26(1):1–11.
- Xia Y, Xiao M, Zhao M, et al. Doxorubicin-loaded functionalized selenium nanoparticles for enhanced antitumor efficacy in cervical carcinoma therapy. Mater Sci Eng C Mater Biol Appl. 2020;106:110100.
- Vu M, Kassouf N, Ofili R, et al. Doxorubicin selectively induce apoptosis through the inhibition of a novel isoform of Bcl-2 in acute myeloid leukaemia MOLM-13 cells with reduced Beclin 1 expression. Int J Oncol. 2020;57(1):113–121.
- Malky HS, Damanhouri ZA, Al-Aama JY, et al. Cytotoxicity and cellular uptake in human breast cancer cells. Breast Cancer Manag. 2019;8(4):BMT31.
- Christowitz C, Davis T, Isaacs A, et al. Mechanisms of doxorubicin-induced drug resistance and drug resistant tumour growth in a murine breast tumour model. BMC Cancer. 2019;19(1):757.
- Al-Harthy SE, Al-Motairi MS, Al-Kreathy HM, et al. Enhancement of doxorubicin cytotoxicity by verapamil in human breast cancer cells. J Pharm Res Int. 2019;27(6):1–10.
- Matcovschii V, Lisii D, Gudumac V, et al. Selective interstitial doxorubicin for recurrent glioblastoma. Clin Case Rep. 2019;7(12):2520–2525.
- Allen CM, Lopes F, Mitchell RT, et al. Comparative gonadotoxicity of the chemotherapy drugs cisplatin and carboplatin on prepubertal mouse gonads. Mol Hum Reprod. 2020;26(3):129–140.
- Kuittinen T, Rovio P, Luukkaala T, et al. Paclitaxel, carboplatin and 1,25-D3 inhibit proliferation of ovarian cancer cells in vitro. Anticancer Res. 2020;40(6):3129–3138.
- Corn PG, Heath EI, Zurita A, et al. Cabazitaxel plus carboplatin for the treatment of men with metastatic castration-resistant prostate cancers: a randomised, open-label, phase 1–2 trial. Lancet Oncol. 2019;20(10):1432–1433.
- Lopes F, Liu J, Morgan S, et al. Single and combined effects of cisplatin and doxorubicin on the human and mouse ovary in vitro. Reproduction. 2020;159(2):193–204.
- Yu DS, Yan HY, Wu CL, et al. Comparison of therapeutic efficacy of lipo-doxorubicin and doxorubicin in treating bladder cancer. Urol Sci. 2017;28(4):200–205.
- Eroglu O, Kaya H, Celik EG, et al. Triple effect of doxorubicin, 5-fluorouracil, propranolol on cell survival on MCF-7 breast cancer cell line. J Biosci Med. 2019;7(2):74–85.
- Escobar-Resendiz R, Reyes-Esparza J, Blake IO, et al. Evaluation of antitumoral effect of the combination of l-histidine methyl ester hydrochloride of amphotericin B with antineoplastics on A549 cells. FASEB J. 2020;34(S1):1.
- Mohammad GRKS, Tabrizi MH, Ardalan T, et al. Green synthesis of zinc oxide nanoparticles and evaluation of anti-angiogenesis, anti-inflammatory and cytotoxicity properties. J Biosci. 2019;44(2):30.
- Pairoj S, Damrongsak P, Damrongsak B, et al. Antiradical properties of chemo drug, carboplatin, in cooperation with ZnO nanoparticles under UV irradiation in putative model of cancer cells. Biocyber Biomed Eng. 2019;39(3):893–901.
- Locharoenrat K, Srivatcharakul S. Optical studies of zinc oxide nanoparticles and their biomedical application. Chin J Phys. 2015;53(4):80901.
- Locharoenrat K. Linear and nonlinear optics: materials, properties, and applications. Singapore: Jenny Stanford; 2020.
- Asadpour S, Kargozar S, Moradi L, et al. Natural biomacromolecule based composite scaffolds from silk fibroin, gelatin and chitosan toward tissue engineering applications. Int J Biol Macromol. 2020;154:1285–1294.
- Ganganagappa N, Udayabhanua , Patil S, et al. Electrochemical heavy metal detection, photocatalytic, photoluminescence, biodiesel production and antibacterial activities of Ag–ZnO nanomaterial. Mater Res Bull. 2017;94:54–63.
- Nosrati H, Khodaei M, Dehkordi MB, et al. Preparation and characterization of poly(ethylene oxide)/zinc oxide nanofibrous scaffold for chronic wound healing applications. Polim Med. 2020;50(1):41–51.
- Danmaigoro A, Selvarajah GT, Noor MHM, et al. Development of cockleshell (Anadara granosa) derived CaCO3 nanoparticle for doxorubicin delivery. J Comput Theor Nanosci. 2017;14(10):5074–5086.
- Iliescu RI, Andronescu E, Ghitulica CD, et al. Montmorillonite–alginate nanocomposite beads as drug carrier for oral administration of carboplatin – preparation and characterization. UPB Sci Bull B. 2011;73(3):3–16.
- Hoshyar N, Gray S, Han H, et al. The effect of nanoparticle size on in vivo pharmacokinetics and cellular interaction. Nanomedicine. 2016;11(6):673–692.
- Harahap Y, Amalia SN, Anarta A. Analysis of doxorubicin and doxorubicinol in dried blood spot of breast cancer patients for monitoring the cardiotoxicity of doxorubicin. Int J Pharmacy Pharm Sci. 2020;12(4):36707.
- Alavi AS, Meshkini A. Fabrication of poly(ethylene glycol)-coated mesoporous nanocomposite ZnO@Fe2O3 for methotrexate delivery: an integrated nanoplatform for dual-mode cancer therapy. Eur J Pharm Sci. 2018;115:144–157.
- Behnamsani A, Meshkini A. Synthesis and engineering of mesoporous ZnO@HAP heterostructure as a pH-sensitive nano-photosensitizer for chemo-photodynamic therapy of malignant tumor cells. J Drug Deliv Sci Technol. 2019;53:101200.
- Jefri SNS, Abdullah AH, Mohammad EN. Response surface methodology: photodegradation of methyl orange by CuO/ZnO under UV light irradiation. Asian J Green Chem. 2019;3(2):271–287.
- Mehr ES, Sorbiun M, Ramazani A, et al. Plant-mediated synthesis of zinc oxide and copper oxide nanoparticles by using Ferulago angulata (Schlecht) Boiss extract and comparison of their photocatalytic degradation of rhodamine B (RhB) under visible light irradiation. J Mater Sci Mater Electron. 2018;29(2):1333–1340.
- Sorbiun M, Mehr ES, Ramazani A, et al. Green synthesis of zinc oxide and copper oxide nanoparticles using aqueous extract of oak fruit hull (Jaft) and comparing their photocatalytic degradation of basic violet 3. Int J Environ Res. 2018;12(1):29–37.
- Fardood ST, Ramazani A, Moradi A, et al. Green synthesis of zinc oxide nanoparticles using arabic gum and photocatalytic degradation of direct blue 129 dye under visible light. J Mater Sci Mater Electron. 2017;28(18):13596–13601.