
 ?Mathematical formulae have been encoded as MathML and are displayed in this HTML version using MathJax in order to improve their display. Uncheck the box to turn MathJax off. This feature requires Javascript. Click on a formula to zoom.
Abstract
Background
Machine learning (ML) algorithms have been widely used in the classification of white blood cells (WBCs). However, the performance of ML algorithms still needs to be addressed for being short of gold standard data sets, and even the implementation of the proposed algorithms.
Methods
In this study, the method of two-module weighted optimized deformable convolutional neural networks (TWO-DCNN) was proposed for WBC classification. Our algorithm is characterized as two-module transfer learning and deformable convolutional (DC) layers for the betterment of robustness. To validate the performance, our method was compared with classical MLs of VGG16, VGG19, Inception-V3, ResNet-50, support vector machine (SVM), multilayer perceptron (MLP), decision tree (DT) and random forest (RF) on our undisclosed WBC data set and public BCCD data set.
Results
TWO-DCNN achieved the best performance with the precisions (PREs) of 95.7%, 94.5% and 91.6%, recalls (RECs) of 95.7%, 94.5% and 91.6%, F1-scores (F1s) of 95.7%, 94.5% and 91.6%, area under curves (AUCs) of 0.98, 0.97 and 0.95 for low-resolution and noisy undisclosed data sets, BCCD data set, respectively.
Conclusions
With accurate feature extraction and optimized network weights, the proposed TWO-DCNN showed the best performance in WBC classification for low-resolution and noisy data sets. It could be used as an alternative method for clinical applications.
Introduction
White blood cells (WBCs) are widely distributed in human blood, lymph and other tissues and play an important role in the immune function of the human body. Nowadays, the incidence of blood diseases related to WBCs, such as leukaemia and malignant lymphoma, shows an increased trend. It was reported that the incidence of leukaemia ranked 11th among cancers worldwide in 2012, and even caused 53,400 cancer deaths in China in 2015 [Citation1,Citation2]. And there are more than 250,000 new cases of malignant lymphoma each year, accounting for 3% of all cancer deaths worldwide [Citation3].
Human blood consists of red blood cells (RBCs), WBCs, and platelets. Of these, WBCs, or leukocytes, are generally classified into two types: granulocytes and non-granulocytes. The granulocyte contains three subtypes of eosinophils (EOSs), basophils (BASs) and neutrophils (NEUs), and the non-granulocyte includes two subtypes of monocytes (MONs) and lymphocytes (LYMs) [Citation4,Citation5].
Abnormal concentrations of WBCs may indicate certain diseases or symptoms, for example, the increase of NEUs standing for acute infection and poisoning, increased MONs and EOSs representing bacterial infection, and proliferated LYMs probably demonstrating a sign of acquired immune deficiency syndrome (AIDS) [Citation6], etc. The accurate WBC count provides useful information for the diagnoses of blood diseases and it has become a popular field of research in clinical applications [Citation7].
The WBC classification could be summarized as comprising three kinds of techniques, microscopy, flow cytometry, and machine learning (ML). The approach of microscopy preserves the advantage of high accuracy; however, it had the problems including low efficiency and long period of cell culture cycle [Citation8]. Presently, flow cytometry has been resorted to a prevalent technique for quantitative analysis of blood samples, yet it is impossible to perform a retrospective study of WBCs due to the inevitable destroy of blood samples [Citation9]. Since ML showed the capacity of simplicity, reliability and robustness for WBC classification, it has become the most popular approach in practice [Citation2,Citation10]. In the literature, there are three kinds of methods of ML algorithms for WBC classification: traditional ML algorithms [Citation11–16], deep learning (DL) [Citation17–23], and hybrid methods of ML and DL [Citation24–28].
According to traditional ML algorithms, morphological features of WBCs played a great role in the accuracy of WBC classification [Citation11]. The mixed features of shape, intensity and texture were combined with the classifier of support vector machine (SVM) and the classification accuracy of 140 digital blood smear images of five types of WBCs could reach 84% [Citation12]. Moreover, another WBC classification algorithm based on the synthetic features and random forest (RF) was proposed for the classification of 800 WBC images of five types of WBCs and obtained an accuracy of 95.4% [Citation13]. In addition, more features of cell energy and colour were applied in the classifier of K-means to classify 98 full cancer images of acute lymphoblastic leukaemia image database for image processing (ALL-IDB) with an accuracy of 94% [Citation14]. Moreover, bi-spectral invariant features integrated with the SVM and classification tree were used to classify 10 types of WBCs on three data sets of Cellavision database, ALL-IDB and Wadsworth centre and ultimately achieved an averaged accuracy of 96.13% [Citation15]. Furthermore, multiple features, such as texture, space and spectrum for the classifier of SVM were applied for the classification of five types of WBCs from hyperspectral images and obtained a classification accuracy of 98.3% [Citation16].
Recently, DL has been widely used in the WBC classification. Convolutional neural networks (CNNs) were used to classify two types of WBCs from the ALL-IDB data set and obtained an accuracy of 96.6% [Citation17]. The combined model of CNN and recurrent neural network (RNN) was implemented to classify four types of WBCs and obtained an accuracy of 90.79% for the BCCD data set [Citation18]. Also, the classification of five types of WBCs using CNN could reach an accuracy of 96.63% for the ALL-IDB data set [Citation19]. While the CNN classification of seven types of WBCs reached an accuracy of 88.5% on an undisclosed data set [Citation20]. It is worth noting that the CNN classification of 40 types of WBCs could reach 83% with the data set of 92,800 WBC images [Citation21]. Another dual attention CellNet (DACellNet) classification of 40 types of WBCs achieved the competitive performance of fine-grained leukocyte recognition without the need for huge human intervention, with the leukocyte data set (84.21%), ALL-IDB of (98.78%), Cellavision database (94.7%) [Citation22]. One lately proposed CNN and RNN merging model with canonical correlation analysis demonstrated a higher performance of 95.89% for four types of WBCs with public data from Shenggan/BCCD data and kaggle.com/paultimothymooney/blood-cells/data [Citation23].
To obtain better performance, hybrid methods were also used in the classification of WBCs. Multiple features of granularity and CNN were combined with the classifiers of SVM and RF to classify five types of WBCs on mixed databases of Cellavison, ALL-IDB and Jiashan databases, and finally obtained an accuracy of 92.8% [Citation24]. The hybrid-classifier of SVM and neural network (NN) was once proposed for the five classifications of WBCs with an average accuracy of 96% [Citation25]. In particular, shape and deep features were implemented in order to characterize the WBCs, and a long-short term memory (LSTM) network was employed for four types of WBC classification and eventually obtained an accuracy of 85.7% [Citation26]. An efficient classification of WBC leukaemia with improved swarm optimization of deep features were applied on two data sets with 96.11% and 83.3% accuracies, respectively [Citation27].
Compared to two other MLs, DL had the advantages of pipeline automation, translation in-variance, weight sharing and end-to-end training with the betterment of parameter optimization [Citation28–30]. However, the algorithms of DL showed changed performances for different data sets in scale and image quality [Citation31–34]. The performance of DL algorithms has still not been clearly addressed due to there being a shortage of gold standard data sets and even the implementation of the proposed algorithms. At present, the robustness of DL for the classification of WBCs still has not been reached a consensus and it had aroused great attention in the field of WBC classification [Citation35].
In our study, two-module weighted optimized deformable convolutional neural network (TWO-DCNN) was proposed for robust WBC classification. The novelty of our algorithm is characterized as two-module transfer learning and deformable convolutional (DC) layers to improve robustness. The pipeline of our method is summarized as follows: (1) With the initialization of ImageNet characteristic weights at the first module, one known high-quality WBC data set was inputted to the first module for per-training with the output of optimized weights, (2) and then the next module was optimized by the transferred weights for the classification of low-quality WBC data set. To validate the robustness and generalization, we compared our method with classical MLs of VGG19, VGG16, Inception-V3, ResNet-50, SVM, multilayer perceptron (MLP), decision tree (DT) and RF on our undisclosed and BCCD data sets. The precision (PRE), recall (REC) and F1-score (F1) and area under curves (AUCs) of receiver operating characteristic curves (ROCs) were measured for the evaluation of performance.
Materials and methods
Data sets
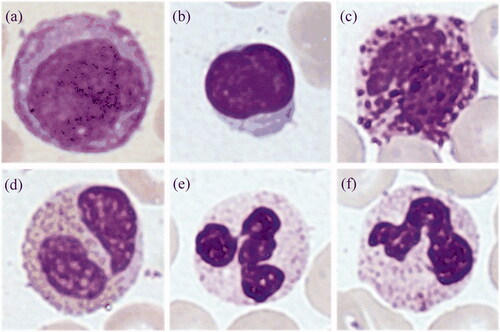
One undisclosed data set was kindly provided by a collaborated corporation. It consisted of 11,865 digital microscopic images: 2144 MON, 2000 LYM, 1741 BAS, 1854 EOS, 2126 segmented NEU (SEG) and 2000 band NEU (BAN), as shown in . The image resolution is 224 × 224 and each image data was labelled by experienced doctors.
Figure 1. White blood cells of undisclosed data set. (a) MON, (b) LYM, (c) BAS, (d) EOS, (e) SEG, (f) BAN.
Another BCCD data set was downloaded from website https://github.com/Shenggan/BCCD_Dataset, containing 375 labelled images: 94 cases of EOS, 37 cases of LYM, 23 cases of MON, and 217 cases of NEU, 5 cases of BAS. The image resolution is 640 × 480. Generally, BAS images were excluded and only four other types of WBC images were included for WBC classification [Citation19,Citation36,Citation37].
Methods
In our study, our novel method is summarized as follows: prepossessing and TWO-DCNN. Here, the DL of TWO-DCNN was proposed to improve the accuracy of WBC classification for low-resolution and noisy data sets. It had two characteristics of two-module transfer learning and DC layers.
Prepossessing
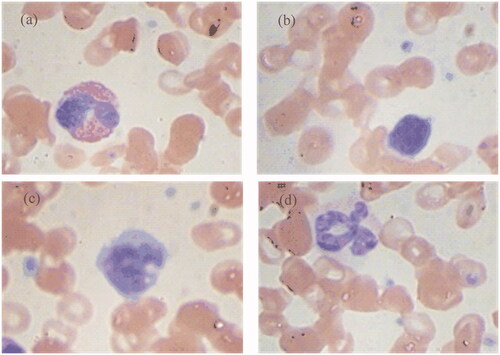
For DLs, it mainly consists of four steps: intensity normalization, bicubic interpolation, rigid registration and triple augmentation. The undisclosed data set was enlarged to 40,505 images. Here, low resolution and noisy data sets were generated from undisclosed data set. By bicubic interpolation, the low-resolution data set was sampled to 112 × 112. While the noisy data set was produced by adding Gaussian noise (mean ± variance: 0 ± 0.02) to the origin undisclosed data set. Meanwhile, the BCCD data set was augmented to 14,468 images and interpolated to 512 × 256 ().
Figure 2. White blood cells of BCCD data set. (a) EOS, (b) LYM, (c) MON, (d) NEU.
In addition to the above steps, the prepossessing of traditional MLs also includes two subsequent steps of segmentation and feature extraction. During segmentation, the region of interests (ROIs) of WBCs were firstly chosen in order to avoid the disturbance, and Ostu segmentation was then used to roughly extract the contour of WBCs. Finally, region-growing segmentation was used to refine the segmentation results. Here, 65 types of WBC features of geometry, wavelet and texture were calculated (). For accurate feature extraction, 13 types of WBC features (Variance, IDM, Contrast, Entropy, ASM, Correlation, Difference Entropy, Difference Variance, InfoMeas1, InfoMeas2, Sum Average, Sum Entropy, Sum Variance) were deduced from four angles of 0, 45, 90 and 135 degrees, respectively.
Table 1. Calculation of WBC features of geometry, wavelet and texture.
TWO-DCNN
The network architecture of TWO-DCNN contains two modules, as shown in . Firstly, Image characteristic weights of ImageNet was used to initiate the first module, and then one known high-quality WBC data set was inputted to train the first module and transfer the optimized weights to the next module; then, the second module was implemented to classify low-quality WBC data sets (low resolution, noisy and small samples/unbalanced data sets).
Figure 3. Network architecture of TWO-DCNN.
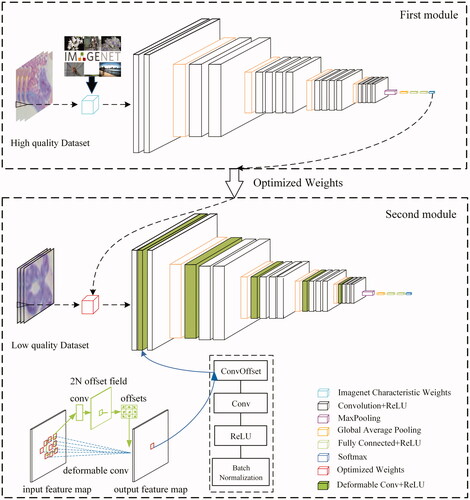
The first module had 26 layers: 16 convolutional layers, 5 maximum pooling layers, 1 averaged pooling layer, 3 fully connected layer and 1 softmax output layer. It contains 20,419,910 parameters. Accordingly, the second module had 29 layers: 5 DC layers, 13 convolutional layers, 5 maximum pooling layer, 1 averaged pooling layer, 4 fully connected 1ayer and 1 softmax output layer. The second module has 39,234,630 parameters. The Radam optimizer was implemented to provide the capacity of fast converge and fitted learning rate [Citation38].
DC Layer
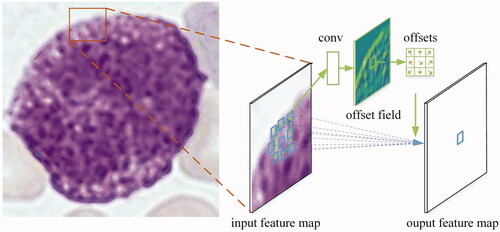
In our approach, each DC layer had four layers of DC kernel, convolutional kernel, rectified linear unit (ReLU) activation function and batch normalization (BN). With the computation of convolutional and DC kernels, more accurate morphological features of WBCs were kept by adaptively adjusting the size of sampling area [Citation39,Citation40]. The feature maps of the input image were outputted by the ReLU activation function. BN was used to improve the training speed for increased parameters of offset fields in the traditional convolutional kernel.
The computation of 2D DC kernel had two steps: (1) to sample input feature map x by traditional convolutional network G; (2) is to process sampling value w by weighting sum, as shown in . The normal convolution grid G (3 × 3) can be formulated as:
(1)
(1)
Figure 4. Computation of deformable convolutional layer.
Thus, each location m0 from output feature map y can be presented as:
(2)
(2)
Here, x denotes the input feature map, w represents the weights of sampled value and means the locations in G. For DC, normal grid G is enhanced by the offset of Δmi, that is:
(3)
(3)
where Δmi was got by an additional convolution layer and was estimated by the shift values of sampled points.
Pooling layer
The maximum pooling layers were used to choose the most significant features by reducing feature dimensions. The size of the pooling window is 3 × 3 and the step size is 2. After that, the averaged pooling layer was used to average maps and the spatial information of the image was kept and reduce the possibility of over fitting [Citation41]. The calculated parameters were obviously decreased from the size of 7 × 7 × 512 to 1 × 1 × 512.
Fully connected layer and output layer
The fully connected layer was implemented to calculate the weighted sum of different features by connecting the neurons of the two layers for subsequent classification. At the first layer, three fully connected layers were individually set as the neurons of 512, 256 and 6. For the second layer, four fully connected layers were chosen as the neurons of 1024, 512, 256 and 6, respectively. With the ReLU activation function, the softmax layer was taken as the output layer.
Experimental setup
In our experiment, the performance of our methods was quantitatively compared with other MLs of VGG19, VGG16, Inception-V3, ResNet-50, SVM, MLP, DT and RF on our undisclosed and BCCD datasets. Ten-fold cross-validation was used for model training and model verification (80% for training, 10% for validating and 10% for testing).
Standard parameters were chosen for the regularization of the proposed ML algorithms. For the ML algorithms VGG19, VGG16, Inception-V3, ResNet-50, and TWOD-CNN, the parameters of the Radam optimizer and the categorical cross-entropy loss function were implemented. At the optimized loss function of 0.03, the batch size of 80 and the epoch of 200 times were obtained and used for comparison.
Accordingly, the radial basis function (RBF) was taken as the kernel function of SVM; during the implementation of MLP, the hyperbolic tangent function was used as the activation function in the hidden layer, softmax was used as the activation function, and the cross-entropy loss function was taken as the output layer. While in the model training of DT, Chi-squared automatic interaction detector (CHAID) was implemented; the algorithm of CHAID was also used for multiple DTs in RF.
The indices of precision (PRE), recall (REC) and F1-score (F1) and area under curves (AUCs) of receiver operating characteristic curves (ROCs) were used for performance evaluation [Citation42–44]. Three indices of PRE, REC and F1 were defined as follows:
PRE:
(4)
REC:
F1:
Results
Results of low resolution and noisy data sets
The PREs, RECs, F1s of low resolution and noisy data sets for the MLs of TWO-DCNN, VGG19, VGG16, Inception-V3, ResNet-50, SVM, MLP, DT and RF are individually listed in . It is evident that each averaged PRE, REC, F1 of low-resolution data set were higher than those of noisy data set except for DT. Among the nine MLs, TWO-DCNN showed the best performance with the same averaged PREs, RECs, F1s of 95.7% and 94.5%, while Inception-V3 presented the worst performance with the averaged PREs, RECs, F1s of 22.1%, 18.9% for low resolution and noisy data sets, respectively. TWOD-CNN, VGG19, VGG16, SVM, MLP, and RF performed better than Inception-V3, ResNet-50, and DT.
Table 2. Comparison of PRE (%) of low resolution and noisy data sets.
Table 3. Comparison of REC (%) on low resolution and noisy data sets.
Table 4. Comparison of F1(%) on low resolution and noisy data sets.
For DLs, TWO-DCNN, VGG19, VGG16 showed better performance than those of Inception-V3, ResNet-50. The classification accuracies of BAS and SEG were lower than those of EOS, LYM, MON, BAN for the three top DLs; accordingly, the traditional MLs of SVM, MLP and RF showed better performance than that of DT. The classification accuracies of BAN and SEG were lower than those of EOS, LYM, MON, BAN for the three top traditional MLs.
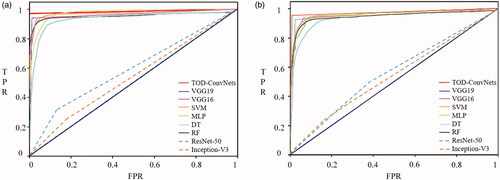
In addition, the ROCs of low-resolution and noisy data sets for the MLs of TWO-DCNN, VGG19, VGG16, Inception-V3, ResNet-50, SVM, MLP, DT and RF are shown in . It was clear that the TWO-DCNN did have the largest AUCs of 0.98 and 0.97, while Inception-V3 had the smallest AUCs of 0.52 and 0.50 for low resolution and noisy data sets, respectively.
Figure 5. Comparison of ROCs of low resolution and noisy data sets. (a) low resolution, (b) noisy.
Results of BCCD data sets
Accordingly, the PREs, RECs, F1s of BCCD data sets for MLs of TWO-DCNN, VGG19, VGG16, Inception-V3, ResNet-50, SVM, MLP, DT and RF are listed in . Similar to the undisclosed data set, TWO-DCNN showed the best performance with the same averaged PREs, RECs, F1s of 91.6%, while Inception-V3 presented the worst performance with the same averaged PREs, RECs, F1s of 40.1% for the BCCD data set. Similarly, DLs of TWO-DCNN, VGG19, VGG16 showed better performance than those of Inception-V3, ResNet-50. The classification accuracies of NEU were lower than those of EOS, LYM, MON for the three top DLs; accordingly, the traditional MLs of SVM, MLP and RF showed better performance than that of DT. The classification accuracies of LYM and MON were lower than those of EOS and NEU for the three top traditional MLs.
Table 5. Comparison of PRE (%) on BCCD data set.
Table 6. Comparison of REC (%) on BCCD data set.
Table 7. Comparison of F1 (%) on BCCD data set.
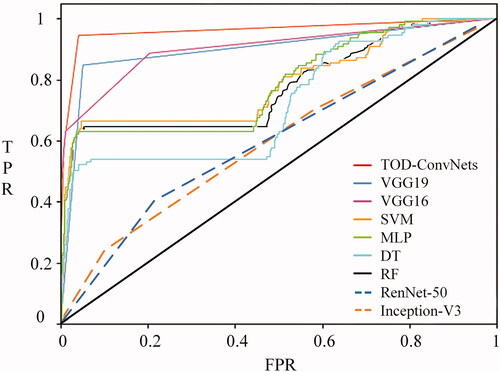
In addition, the ROCs of BCCD data sets for MLs of TWO-DCNN, VGG19, VGG16, SVM, MLP and DT are shown in . It was clear that the TWO-DCNN did have the largest AUCs of 0.95, while Inception-V3 had the smallest AUCs of 0.55 for the BCCD data set.
Figure 6. Comparison of ROCs of BCCD data set.
Discussion
The proposed TWO-DCNN demonstrated robust performance in WBC classification. The experiments proved that the TWO-DCNN was able to effectively classify WBCs in cases of low resolution and noisy data sets. It was due to that the network architecture of TWO-DCNN characterized as two aspects of transfer learning and DC layers. The improved CNN could be effectively used to classify WBCs for robustness capabilities [Citation45–47].
The pipeline of our algorithm demonstrated the best performance among the proposed ML algorithms. The computation of WBC features for traditional ML algorithms was so complicated that the ultimate features would be easily affected by the object segmentation. Compared with other ML algorithms, our method can avoid the process of segmentation and automate the steps of feature extraction and classification.
In terms of VGG networks, it would be easily lead to wrong labelling for single definitions and insufficient feature learning of WBCs. Moreover, the used VGG networks couldn’t solve the problem of over-fitting, which is caused by data augmentation. In our proposed method, the reformed network accelerated the period of parameter tuning. The two layers of CNNs helped to quickly obtain the optimal weights for a fast convergence speed. Through the layer of the DC CNN, the reliable feature extraction for WBC classification was obtained. With the optimized Radam optimizer, the classification performance would be greatly increased by 0.3% averaged precision. In particular, the Inception-V3 and ResNet-50 networks showed the worst performances in WBC classifications. This was due to the network architectures of Inception-V3 and ResNet-50 inevitably reusing the features from the lower layers during the feedforward process, and this would exaggerate the deviation of feature extraction of WBCs [Citation48,Citation49]. The results proved that our methods showed better generalization and robustness in WBC classification of low resolution and noisy data sets.
For low resolution and noisy undisclosed data sets, the MLs showed different capabilities in the classification of six types of WBCs. Clearly, the BAS and SEG for the top three DLs, and the BAN and SEG for the top three traditional MLs showed worse accuracies, respectively. It was because that the BAS and BAN belonged to the same type of granulocyte, and the BAN and SEG were categorized as the same type of NEU. Those subtypes of WBCs had similar morphological features of cytoplasm and were easily misclassified during WBC classification. Similarly, since the MON and LYM of BCCD had similar cell nucleus and poor background discrimination, the MON and LYM showed poorer performance than two other subtypes of WBCs.
However, our study has some limitations. Firstly, the network model still needed to be optimized in order to improve the classification accuracy; secondly, WBC data sets should be enlarged in WBC samples and WBC types for more reliable performance evaluation; thirdly, besides Radam optimizer, more kinds of optimizers should be investigated regarding the problem of over fitting in future work.
Conclusion
In our study, the proposed TWO-DCNN showed the best performance in WBC classification for low-quality data sets. With two-module transfer learning and DC layers, our automatic approach could effectively optimize network weights and accurately extract WBC features for WBC classification. It could be used as an alternative method for clinical applications.
Ethical approval
This article does not contain any studies with human participants or animals performed by any of the authors.
Author contributions
Xufeng Yao and Kai Sun designed the study and wrote the paper. Xufeng Yao and Kai Sun managed the literature searches and analyses. Xixi Bu, Congyi Zhao and Yu Jin revised the figures, references and even conducted a series of additional experiments for the manuscript. All authors contributed to and approved the final manuscript.
Acknowledgements
The authors would like to thank Shanghai Beiang Medical Technology Co., Ltd, Shanghai, China for providing with undisclosed data set. The authors also thank Prof. Gang Huang for the valuable suggestions for the revision of our paper.
Disclosure statement
No potential conflict of interest was reported by the author(s).
Data availability statement
The data sets generated during and analyzed during the current study are available by E-mail.
Additional information
Funding
References
- Ferlay J, Soerjomataram I, Dikshit R, et al. Cancer incidence and mortality worldwide: sources, methods and major patterns in GLOBOCAN 2012. Int J Cancer. 2015;136(5):359–386.
- Chen W, Zhang R, Baade PD, et al. Cancer statistics in China. CA Cancer J Clin. 2016;66(2):115–132.
- Hude I, Sasse S, Engert A, et al. The emerging role of immune checkpoint inhibition in malignant lymphoma. Haematologica. 2017;102(1):30–42.
- Bain BJ. Structure and function of red and white blood cells. Medicine. 2017;45(4):187–193.
- Schmiegelow K, Nersting J, Nielsen SN, et al. Maintenance therapy of childhood acute lymphoblastic leukemia revisited—should drug doses be adjusted by white blood cell, neutrophil, or lymphocyte counts? Pediatr Blood Cancer. 2016;63(12):2104–2111.
- Thomas N, Sreejith V. A review on white blood cells segmentation. IOP Conf Ser Mater Sci Eng. 2018;396(1):012038.
- Qin F, Gao N, Peng Y, et al. Fine-grained leukocyte classification with deep residual learning for microscopic images. Comput Methods Programs Biomed. 2018;162(5):243–252.
- Nazlibilek S, Karacor D, Ercan T, et al. Automatic segmentation, counting, size determination and classification of white blood cells. Measurement. 2014;55(2):58–65.
- Othman MZ, Mohammed TS, Ali AB. Neural network classification of white blood cell using microscopic images. Int J Adv Comput Sci Appl. 2017;8(5):99–104.
- Ravikumar S. Image segmentation and classification of white blood cells with the extreme learning machine and the fast relevance vector machine. Artif Cell Nanomed B. 2016;44(3):985–989.
- Nassar M, Doan M, Filby A, et al. Label-free identification of white blood cells using machine learning. Cytometry A. 2019;95(8):836–842.
- Habibzadeh M, Krzyżak A, Fevens T. Comparative study of shape, intensity and texture features and support vector machine for white blood cell classification. J Theor Appl Comput Sci. 2013;7(1):20–35.
- Tingting H, Jianwei Z, Feilong C, et al. A classification algorithm for white blood cells based on the synthetic feature and random forest. J China Univ Metro. 2015;26(4):474–479.
- Agaian S, Madhukar M, Chronopoulos AT. A new acute leukaemia-automated classification system. Comput Methods Biomech Biomed Eng Imaging Vis. 2018;6(3):303–314.
- Al-Dulaimi K, Chandran V, Banks J, et al. Classification of white blood cells using bispectral invariant features of nuclei shape. Int Conf Digit Image Comput Tech Appl. Canberra, Australia. 2018;1–8.
- Duan Y, Wang J, Hu M, et al. Leukocyte classification based on spatial and spectral features of microscopic hyperspectral images. Opt Laser Technol. 2019;112(2):530–538.
- Thanh TTP, Vununu C, Atoev S, et al. Leukemia blood cell image classification using convolutional neural network. IJCTE. 2018;10(2):54–58.
- Liang G, Hong H, Xie W, et al. Combining convolutional neural network with recursive neural network for blood cell image classification. IEEE Access. 2018;6:36188–36197.
- Macawile MJ, Qui Ones VV, Ballado A, et al. White blood cell classification and counting using convolutional neural network. Int Conf Control Robot Eng. Nagoya, Japan. 2018;259–263.
- Yu W, Chang J, Yang C, et al. Automatic classification of leukocytes using deep neural network. Proc Int Conf ASIC. Guiyang, China. 2017:1041–1044.
- Jiang M, Cheng L, Qin F, et al. White blood cells classification with deep convolutional neural networks. Int J Patt Recogn Artif Intell. 2018;32(09):1857006.
- Ye Q, Tu D, Qin F, et al. Dual attention based fine-grained leukocyte recognition for imbalanced microscopic images. IFS. 2019;37(5):6971–6982.
- Patil AM, Patil MD, Birajdar GK. White blood cells image classification using deep learning with canonical correlation analysis. IRBM. 2020;. DOI: https://doi.org/https://doi.org/10.1016/j.irbm.2020.08.005.
- Zhao J, Zhang M, Zhou Z, et al. Automatic detection and classification of leukocytes using convolutional neural networks. Med Biol Eng Comput. 2017;55(8):1287–1301.
- Hegde RB, Prasad K, Hebbar H, et al. Development of a robust algorithm for detection of nuclei and classification of white blood cells in peripheral blood smear images. J Med Syst. 2018;42(6):110.
- Şengür A, Akbulut Y, Budak Ü, et al. White blood cell classification based on shape and deep features. Int Conf Artif Intell Data Process Symp, IDAP. Malatya, Turkey. 2019;:1–4.
- Sahlol AT, Kollmannsberger P, Ewees AA. Efficient classification of white blood cell leukemia with improved Swarm optimization of deep features. Sci Rep. 2020;10(1):11.
- Litjens G, Kooi T, Bejnordi BE, et al. A survey on deep learning in medical image analysis. Med Image Anal. 2017;42(4):60–88.
- Baydilli YY, Atila Ü. Classification of white blood cells using capsule networks. Comput Med Imaging Graph. 2020;80(2):101699.
- Özyurt F. A fused CNN model for WBC detection with MRMR feature selection and extreme learning machine. Soft Comput. 2020;24(11):8163–8172.
- Habibzadeh M, Jannesari M, Rezaei Z, et al. Automatic white blood cell classification using pre-trained deep learning models: Resnet and inception. Proc SPIE Int Soc Opt Eng. 2018;10696:1069612.
- Choi JW, Ku Y, Yoo BW, et al. White blood cell differential count of maturation stages in bone marrow smear using dual-stage convolutional neural networks. PLOS One. 2017;12(12):e0189259.
- Kurniadi FI, Putri VK. A comparison of human crafted features and machine crafted features on white blood cells classification. J Phys Conf Ser. 2019;1201(1):012045.
- Hegde RB, Prasad K, Hebbar H, et al. Comparison of traditional image processing and deep learning approaches for classification of white blood cells in peripheral blood smear images. Biocybern Biomed Eng. 2019;39(2):382–392.
- Lv M, Zhao X, Chen F, et al. A rapid white blood cell classification system based on multimode imaging technology. J Biophotonics. 2020;13(11):e202000197.
- Wang Q, Chang L, Zhou M, et al. A spectral and morphologic method for white blood cell classification. Opt Laser Technol. 2016;84(5):144–148.
- Yildirim M, Çinar A. Classification of white blood cells by deep learning methods for diagnosing disease. RIA. 2019;33(5):335–340.
- Liu L, Jiang H, He P, et al. On the variance of the adaptive learning rate and beyond. Proc Int Conf Learn Representat. Addis Ababa, Ethiopia. 2019;:1–13.
- Liu Z, Shen C, Fan X, et al. Scale-aware limited deformable convolutional neural networks for traffic sign detection and classification. IET Intell Transp Syst. 2020;14(12):1712–1722.
- Jin Q, Meng Z, Pham TD, et al. DUNet: a deformable network for retinal vessel segmentation. Knowl Based Syst. 2019;178(4):149–162.
- Lin M, Chen Q, Yan S. Network in network. Proc Int Conf Learn Representat. Banff, Canada. 2014;:1–10.
- Banik PP, Saha R, Kim KD. An automatic nucleus segmentation and CNN model based classification method of white blood cell. Expert Syst Appl. 2020;149(13):113211.
- Toğaçar M, Ergen B, Cömert Z. Classification of white blood cells using deep features obtained from Convolutional Neural Network models based on the combination of feature selection methods. Appl Soft Comput. 2020;97(10):106810.
- Kermany DS, Goldbaum M, Cai W, et al. Identifying medical diagnoses and treatable diseases by image-based deep learning. Cell. 2018;172(5):1122–1131.
- Perez L, Wang J. The effectiveness of data augmentation in image classification using deep learning. arXiv preprint arXiv:1712.04621. 2017.
- Kutlu H, Avci E, Özyurt F. White blood cells detection and classification based on regional convolutional neural networks. Med Hypotheses. 2020;135(11):109472.
- Jung C, Abuhamad M, Alikhanov J, et al. W-Net: A CNN-based Architecture for White Blood Cells Image Classification. arXiv preprint arXiv:1910.01091. 2019.
- Szegedy C, Vanhoucke V, Ioffe S, et al. Rethinking the inception architecture for computer vision. Proc IEEE Comput Soc Conf Comput Vision Pattern Recognit. Las Vegas, USA. 2016;:2818–2826.
- Targ S, Almeida D, Lyman K. Resnet in resnet: Generalizing residual architectures. Proc Int Conf Learn Representat. San Juan, Puerto Rico. 2016;:1–7.