
 ?Mathematical formulae have been encoded as MathML and are displayed in this HTML version using MathJax in order to improve their display. Uncheck the box to turn MathJax off. This feature requires Javascript. Click on a formula to zoom.
Abstract
Potential roles of RNA N6-methyladenosine (m6A) modification in tumour microenvironment (TME) cell infiltration has been demonstrated in recent studies. Nonetheless, the mechanism of its regulation remains unknown and immunotherapy has been marginal in prostate cancer. We demonstrated the expression of different m6A regulators within prostate cancer related to genetic variation, alternative splicing (AS), tumour mutational burden (TMB) and TME. Unsupervised clustering and risk prediction model constructed by 24 m6A regulators could predict scores of TME and prostate cancer patients prognosis. T cells CD8 was the intersection of immune cells which are related to multiple biological processes, and the fraction of T cells CD8 strongly correlates with immune associated gene sets. m6A methylation modification and immune cells infiltration played a nonnegligible role in prostate cancer. Our study represents a step towards personalized immunotherapy for prostate cancer patients.
Introduction
Prostate cancer is one of the most common malignancies worldwide and the first common cancer of the genitourinary tract in old man [Citation1–4]. Immunotherapeutic agents offer new therapy options for patients with many cancers [Citation5,Citation6]. To date, responses to immune checkpoint inhibitor monotherapy have been marginal in prostate cancer and the majority of patients without clinical benefit. Tumour microenvironment (TME) plays a crucial role in the tumour progression, and numerous studies have shown that TME not only contained cancer cells but also stromal cells [Citation7–10]. Therapeutic response of many tumours, including prostate cancer, correlates with tumour mutational burden (TMB). The higher score of TMB, the more tumour-related oncogenic mutations and the less normal-like cells, which made it easier to be detected by immune cells and became the target of tumour immunity, and more likely to be effective for immunotherapy [Citation11,Citation12].
N6-methyladenosine (m6A) is the most abundant modification among more than 100 patterns in mRNA [Citation13,Citation14]. m6A modification at different levels regulates mRNA (including structure, maturation, stability, splicing, export, translation and decay). The modification process of m6A is dynamic and reversible, which is mainly regulated by three kinds of enzymes: methyltransferases (“writers”), demethylases (“erasers”) as well as m6A-binding proteins (“readers”). Under the joint efforts of these enzymes, the level of m6A maintains a dynamic equilibrium. The finding would help improve the abilities of predicting immunotherapeutic responsiveness, and reveal the role and mechanism of m6A modification [Citation15].
Nowadays, more and more researches have revealed the special correlation between m6A methylation and TME immune infiltration, which cannot be explained via RNA degradation mechanism [Citation16]. Therefore, comprehensive recognizing of the TME cell infiltration characterizations mediated by multiple m6A regulators will contribute to enhancing our understanding of TME immune regulation. In our study, we integrated the genomic information of prostate cancer and normal samples to comprehensively evaluate the roles of m6A regulators, and correlated the m6A regulators with the TME cell-infiltrating characteristics. We aimed to prove that m6A modification played a nonnegligible role in shaping individual TME characterizations.
Materials and methods
Data selection and processing
The RNA-Seq gene expression profiles of patients with prostate cancer were downloaded from the cancer genome atlas (TCGA) portal (https://cancergenome.nih.gov/), International Cancer Genome Consortium (ICGC) portal (https://dcc.icgc.org/) and Gene-Expression Omnibus (GEO, GSE79021) portal (https://www.ncbi.nlm.nih.gov/geo/). Clinical data of tumours were also downloaded from the TCGA database and ICGC database. The splicing event data for prostate cancer were downloaded from the TCGA SpliceSeq database. Regarding the copy number variations (CNVs) and single nucleotide polymorphism (SNP) analyses, we used TCGA data. R software (3.6.2) (Vienna, Austria) was used for data extraction and sorting to obtain the gene expression matrices and clinical data. Circos plots were performed by the R package “Rciorcos” in the catalogue of somatic mutations in cancer (COSMIC) database (https://cancer.sanger.ac.uk/cosmic), we get the m6A related genes mutation information of prostate cancer.
Prognostic analysis of alternative splicing for 24 m6A regulators
The splicing factor (SF) is an important regulator in the alternative splicing (AS) process. SF data of prostate cancer patients were downloaded from http://hapmap.ncbi.nlm.nih.gov/downloads/genotypes. The percent spliced in (PSI) value was used in quantifying AS events and calculating for seven types of AS events: exon skip (ES), mutually exclusive (ME) exons, retained intron (RI), alternate promoter (AP), alternate terminator (AT), alternate donor (AD) site and alternate acceptor (AA) site. The correlation between the expression of SF and the PSI value of the most significant survival-associated AS events was analysed by Pearson’s test.
Differential expression analysis and functional enrichment analysis
To identify differentially expressed genes (DEGs) between normal and tumour groups, we used the R language “limma” package to screen the DEGs from GEO and TCGA transcriptome data. Mann–Whitney’s test was performed to determine differential expression levels of genes. Adjusted p value <.05 was considered to be statistically significant. Gene ontology (GO) and Kyoto Encyclopedia of Genes and Genomes (KEGG) pathway enrichment analysis were conducted with R language “clusterProfiler” and “enrichplot” package, false discovery rate (FDR)<0.05 was set as the threshold. Bar chart was used to visualize the biological process (BP), cellular component (CC) and molecular function (MF) of GO enrichment. The bar chart was also used to visualize the pathways of KEGG.
Estimation of TME, TMB and immune cell infiltration
We analysed 29 immune-associated gene sets which represented diverse immune cell types, functions and pathways. The immune infiltration levels were quantified using enrichment scores calculated by single-sample gene set enrichment analysis (ssGSEA) [Citation17]. We used the ssGSEA score to classify patients into two (GEO: high, low) or three (ICGC and TCGA: high, medium, low) different groups. ESTIMATE was used to evaluate the immune cell infiltration level (immune score), tumour purity and stromal content (stromal score) for each prostate sample. CIBERSORT was used to calculate the proportions of 22 human immune cell subsets. To quantify the proportions of immune cells, the CIBERSORT algorithm was used in our study. We used the R package “CIBERSORT” to estimate the fraction of immune cells in prostate cancer samples. TMB is calculated by the total number of somatic mutations/total covered bases [Citation18]. We constructed a model based on the TMB status and classified prostate cancer patients into high TMB and low TMB groups by the mean of population TMB. We tried to analyse whether there are differentially expressed m6A regulators between the high and low TMB subtypes.
Construction of risk prediction model
In order to build a prostate cancer prognostic model use m6A regulators, all 24 genes were used to conduct a univariate Cox survival regression, and p value <.1 was used to create a least absolute shrinkage and selection operator (LASSO) regression model. This method was applied to reduce potential over-fit and implemented through the “glmnet” R package. Univariate and multivariate Cox analyses were conducted with R language “forest” and “survival” package. The risk scores of each patient were calculated through the prediction formula of the risk prediction model. We calculated the cut-off value used to determine whether the patient is at high or low risk. The formula used for this model was: .
Verification of the validity of the risk prediction model
Overall survival (OS) was calculated from the date of diagnosis to the date of death or last follow-up. Survival curves were estimated using the Kaplan–Meier method, and the log-rank test was used to test for differences between groups. The time-dependent receiver operating characteristic (tdROC) curve analysis was first applied to evaluate the predictive accuracy of the model for cancer-specific death or biochemical recurrence based on the risk scores, with the help of the “survivalROC” R package. Chi-squared test or Fisher’s exact test was used to investigate the correlation between risk model and clinicopathologic variables, and draw the heatmap through the “pheatmap” R package, p < .05 was considered statistically significant for all tests.
Identification of molecular subtypes by using consensus clustering
Unsupervised clustering was performed using the "ConsensusClusterPlus" package in R to identify subgroups based on the m6A regulators. This algorithm determined consensus clustering by measuring the stability of clustering results from the application of a given clustering method to random subsets of data. After executing ConsensusClusterPlus, we obtained the cluster consensus and item-consensus results. Graphical output results included heatmaps of the consensus matrices, which displayed the clustering results, consensus cumulative distribution function (CDF) plots and delta area plots, and which allowed us to determine an approximate number of clusters. Numbers of clusters were determined according to the following criteria: relatively high consistency within the cluster, relatively low coefficient of variation, and no appreciable increase in the area under the CDF curve. Associations between both clinicopathologic characteristics and clustering were analysed using the χ2 test or Fisher’s exact test, and draw the heatmap through the “pheatmap” R package, p < .05 was considered statistically significant for all tests.
Results
Landscape of variation of m6A regulators in prostate cancer
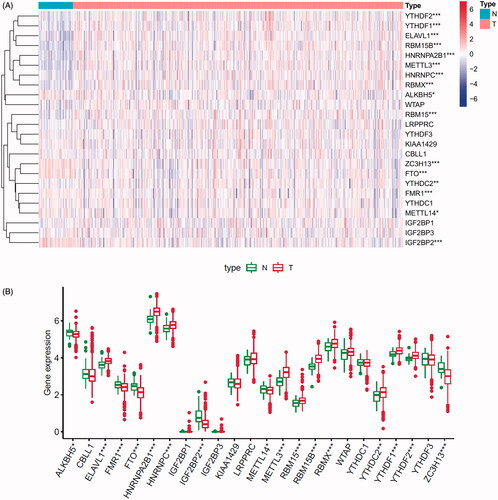
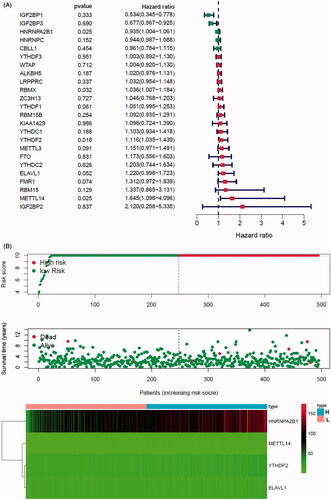
A total of 24 m6A regulated genes including nine writers, two erasers and 13 readers were identified in our research. We obtained the expression levels of 24 m6A regulators from TCGA and GEO databases (652 prostate tumour samples and 101 normal samples). The genes that met the adjusted p value <.05 were considered DEGs. DEGs were shown in heatmap and boxplot to intuitively illustrate the differences between tumour and normal samples of TCGA () and GEO databases (Figure S1A,B). The investigation of CNV alteration frequency showed a prevalent CNV alteration in 10 regulators and the location of CNV alteration of m6A regulators on chromosomes is shown in (Table S1). Among 24 m6A regulators, 17 of them were experienced mutations. It was found that the ZC3H13 exhibited the highest mutation frequency, with frequency 16.67%. Further analyses revealed a significant mutation co-occurrence relationship between IGF2BP1, YTHDF2, along with RBM15B and YTHDC2 (). The COSMIC database contains 1404 prostate cancer samples and 392 metastasis samples, and the chromosomal mutation sites with differences in primary and metastasis of prostate cancer are shown in . We identified differential somatic mutations between cancer and metastasis samples using the COSMIC, and found that the m6A regulators (KIAA1429, YTHDF2, RBM15, RBM15B, ELAVL1, IGF2BP1, LRPPRC) which experienced mutations could be the prominent factors resulting in tumour metastasis (Table S2).
Figure 1. Landscape of genetic and expression variation of m6A regulators in prostate cancer. (A) Heatmap analysis of differential expression profiles between normal tissues and cancer tissues in TCGA-PRAD. (B) Boxplot to intuitively illustrate the differences between tumour and normal tissues in TCGA-PRAD. (C) The location of CNV alteration of m6A regulators on 23 chromosomes using TCGA-PRAD. (D) The mutation frequency of 24 m6A regulators in patients with prostate cancer from TCGA-PRAD cohort. Each column represented individual patients. The upper bar-plot showed TMB, and the left bar-plot showed the proportion of each variant type. (E) Significant single-nucleotide variants in COSMIC database was plotted as Manhattan. The points above the red line indicate a statistically significant difference.
m6A methylation modification regulatory network and enrichment analysis
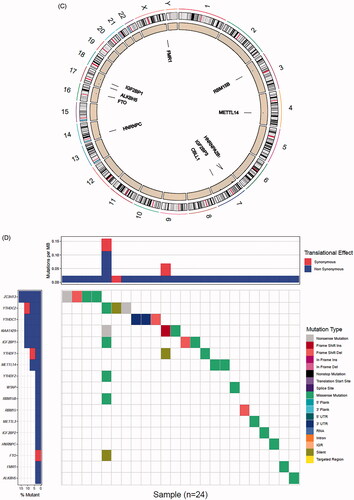
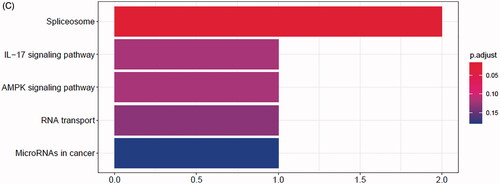
The comprehensive landscape of m6A regulators interactions, regulator connection for prostate cancer patients was depicted with the m6A regulators network, and their correlations were also analysed using “corrplot” package in R software (). In this network, the relationship between m6A regulators was shown in pink lines, and seven nodes have higher degrees. In TCGA and GEO databases, the top three groups with the highest correlation were KIAA1429/YTHDF3, KIAA1429/LRPPRC and ZC3H13/FTO (Figure S2A,B). They also have the higher correlation in ICGC database (p < .05, r > 0.4, Figure S2C). To explore the biological functions of m6A regulators, they were categorized into BP, CC and MF. Under stringent threshold conditions (p-adjust <.05), we identified 150 specific BP, 13 CC and 26 MF of GO terms that were enriched in these genes, and top 10 terms of each part are in . Additionally, analysis using “clusterProfiler” indicated that these genes were significantly enriched in spliceosome KEGG pathway as shown in .
Figure 2. Regulatory networks construction and enrichment analysis of m6A regulators. (A) Network of the interactions among the m6A regulators. Top genes were shown in yellow. (B) Bar-plot of GO enrichment in cellular component terms, biological process terms and molecular function terms. (C) Bar-plot of KEGG enriched terms.
We demonstrated that whether tumours with a high writer gene expression exhibit a low eraser gene expression actually depending on the different writer and eraser genes (Figure S3A,B). It was found that tumours with a low expression of FTO showed a high expression of writer genes (KIAA1429, METTL14, RBM15, RBM15B, ZC3H13, RBMX, CBLL1), while it did not affect the expression of WTAP. Tumours with a high expression of eraser gene FTO showed a high expression of writer gene METTL14. In addition, it was also found that tumours with a low expression of ALKBH5 showed a high expression of writer genes (METTL14, RBM15B and ZC3H13). The above results indicated that cross-talk among the regulators of writers, readers and erasers may play critical roles in the formation of different m6A modification patterns.
Survival associated as events mediated by 24 m6A regulators
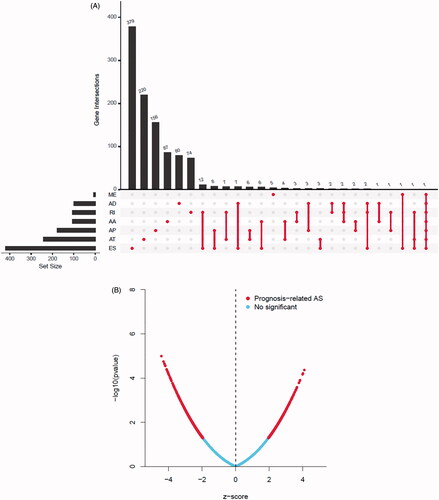
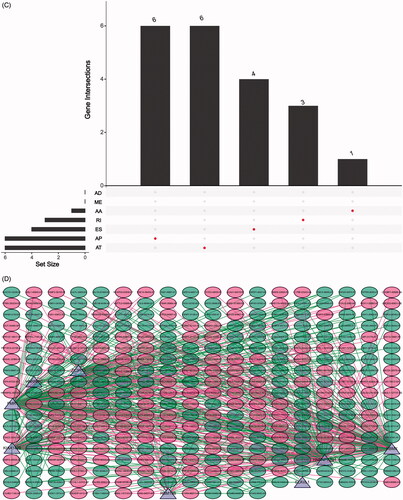
Forty-four thousand and nineteen AS events of 56,755 genes were identified in 499 prostate cancer patients, and ES was the most frequent splice signatures among the seven AS types (Figure S4A). Notably, one gene could have multiple survival associated AS events in prostate cancer. Thus, a subset of overlapping AS events among the seven types of AS in prostate cancer were illustrated by UpSet plot diagram (). Prognosis-related AS were shown in Volcano plot (), and the top 20 significant survival associated AS events of the seven types were presented in Figure S4B. We then screened the m6A genes as SFs, and the relationship between m6A SFs and the prognosis-related AS events is shown in . The results of showed that eight m6A regulators (KIAA1429, RBM15B, ZC3H13, RBMX, FMR1, ELAVL1, HNRNPC, HNRNPA2B1) were related to 328 prognosis-related AS in network under stringent threshold conditions (r > 0.3 and p < .05).
Figure 3. Summarize and gene network of survival associated alternative splicing (AS) events mediated by 24 m6A regulators in TCGA-PRAD cohort. (A) The UpSet intersection diagram shows seven types of survival associated AS events in TCGA-PRAD cohort. (B) Volcano plot of prognosis-related AS events. Red plots represent AS related to prognosis with p value <.05. (C) The UpSet intersection diagram shows seven types of survival associated AS events of m6A regulators in TCGA-PRAD cohort. (D) The interaction network of survival associated AS events mediated by m6A regulators created by Cytoscape. Pink dots represent positively survival associated AS events. Green dots represent negatively survival associated AS events. Triangles represent m6A regulators as splicing factors (SFs).
TME cell infiltration characteristics identified by ssGSEA
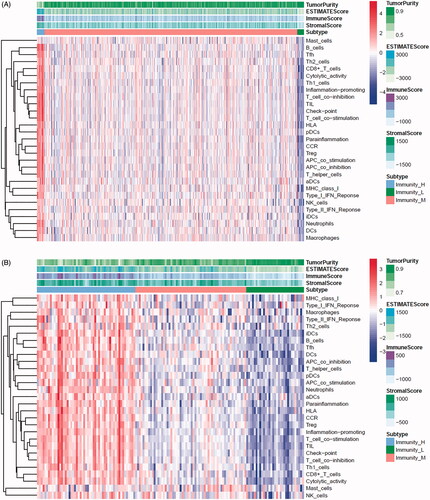
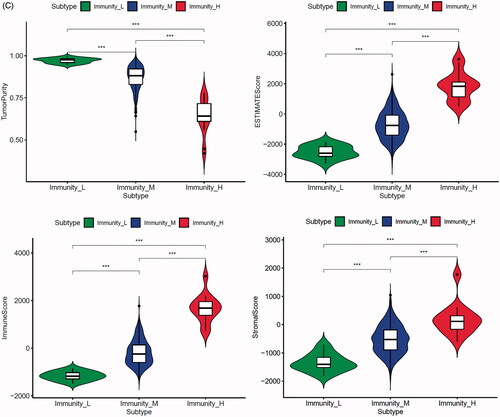
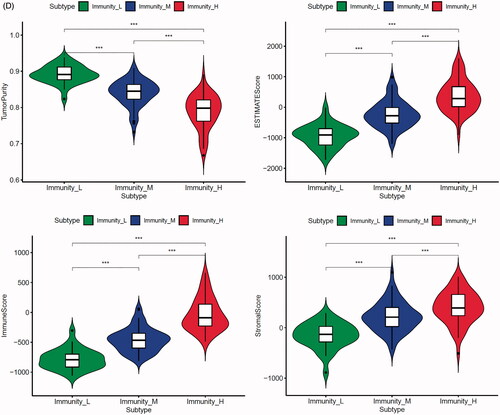
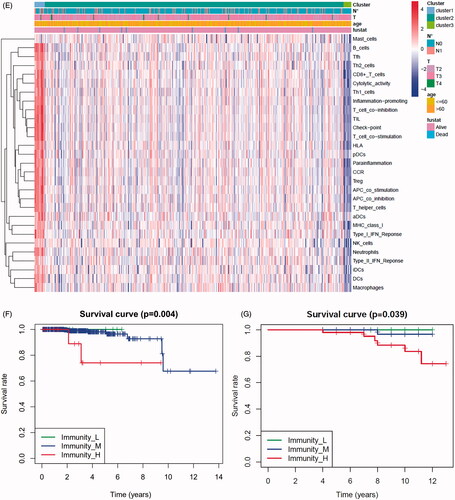
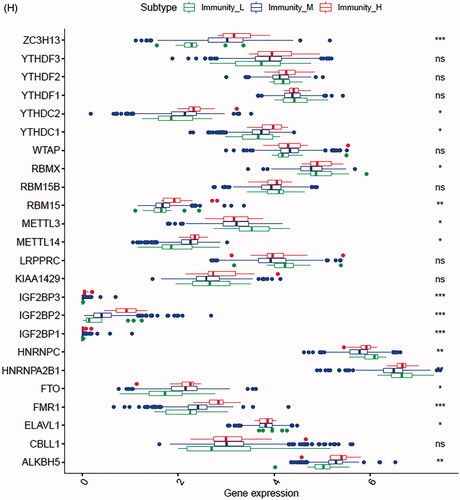
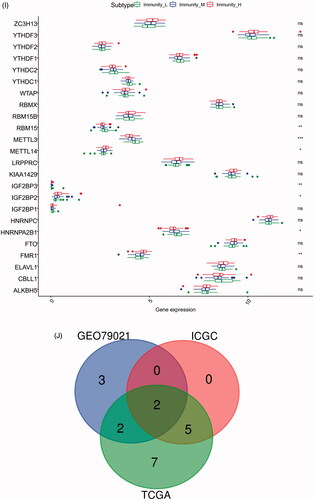
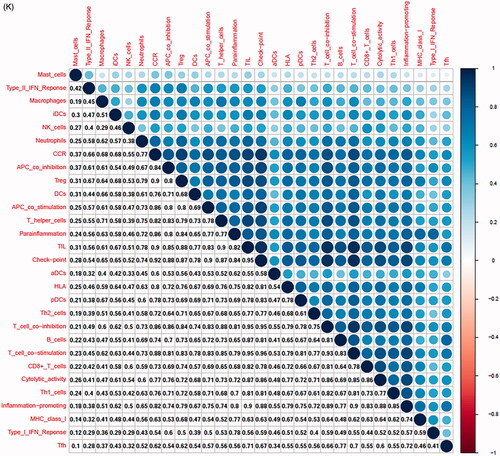
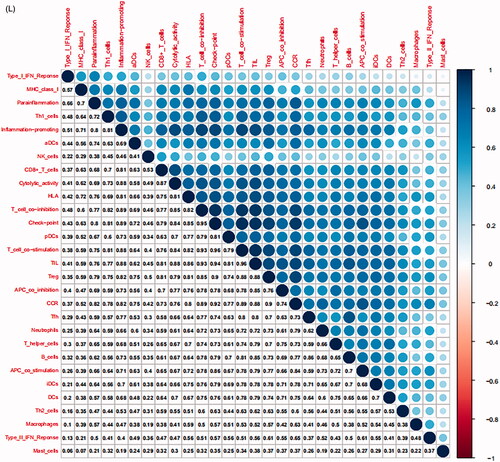
In the TCGA-PRAD (prostate adenocarcinoma) cohort as well as GEO and ICGC cohorts, patients were divided into two or three immune groups based on ssGSEA method (Figure S5A–C). ssGSEA analysis was used to assess the immune infiltration level of every gene set. The patients in high immune infiltration cluster had a higher significant immune scores, estimate scores, stromal scores and a lower tumour purity (, Figure S5D). The difference of TME scores (immune scores, estimate scores, stromal scores, tumour purity) between high and low immune infiltration groups was statistically significant in TCGA database (). A similar stratification of cases was confirmed in GEO and ICGC independent validation cohorts, all p < .05 (, Figure S5E). In addition, we assessed the association between immune infiltration clusters and the clinical prognosis features. This analysis clearly revealed immune infiltration clusters were related to stage N (p= .021) and OS. However, there was no relationship between other clinical characteristics and immune infiltration clusters (). Prognostic analysis also revealed low immune infiltration cluster to be markedly related to prolonged survival, while high immune infiltration cluster was characterized by poorer survival, all p < .05 (). One-way ANOVA test also confirmed the remarkable differences on m6A regulators expression between immune infiltration clusters in all databases (, Figure S5F). Venn diagram summarizes the common differentially expressed m6A regulators of immune infiltration clusters for TCGA, ICGC and GEO cohorts (). Eventually, HNRNPA2B1 and METTL3 as the representative m6A genes played a non-negligible role in the immune regulation in TME. The expression levels of HNRNPA2B1 and METTL3 in the high immunity group were significantly lower than those in the low immunity group (Figure S6A–C). To better illustrate the characteristics of 29 immune-associated gene sets, we also tested the correlation between the gene sets for TCGA and ICGC cohorts (). The above results strongly suggested that the expression of m6A regulators was significantly correlated with immune infiltration levels.
Figure 4. m6A gene regulation in immune landscape of prostate cancer. (A) The heatmap shows the unsupervised clustering of the 29 immune cell types from TCGA cohort in high, medium and low infiltration clusters. The distribution of tumour microenvironment (TME) was compared among clusters. (B) The heatmap shows the unsupervised clustering of the 29 immune cell types from ICGC cohort in high, medium and low infiltration clusters. The distribution of TME was compared among clusters. (C) The TME scores (immune scores, estimate scores, stromal scores, tumour purity) were compared between immune infiltration clusters in TCGA cohort. (D) The TME scores (immune scores, estimate scores, stromal scores, tumour purity) were compared between immune infiltration clusters in ICGC cohort. (E) The heatmap shows the unsupervised clustering of the 29 immune cell types from TCGA cohort in high, medium and low infiltration clusters. The distribution of clinic-pathological characteristics was compared between clusters. (F) The survival was compared between immune infiltration clusters in TCGA cohort. (G) The survival was compared between immune infiltration clusters in ICGC cohort. (H) Difference in the expression of m6A regulators among three immune infiltration clusters in TCGA cohort. (I) Difference in the expression of m6A regulators among three immune infiltration clusters in ICGC cohort. (J) Venn diagram summarizes the common differentially expressed m6A regulators among three immune infiltration clusters in three cohorts. (K) The correlation among 29 immune cell types in TCGA cohort. (L) The correlation among 29 immune cell types in ICGC cohort. The asterisks in Figure 4(C-E) and Figure 4(H,I) were represented the statistical p value (*p < .05, **p < .01 and ***p < .001).
Mutational genomic landscape and m6A genes expression in prostate cancer
The summary of mutational genomic landscape of prostate cancer is shown in Figure S7A. Missense mutation was the highest mutation in the nine variant classifications and SNP had the highest frequency in the total mutation frequency compared to INS and DEL. The results of single nucleotide variants (SNVs) indicated C > T had the highest incidence in six base substitutions (C > A, C > G, C > T, T > A, T > C and T > G). The waterfall map summarized the high mutated genes and their mutation classification of prostate cancer (Figure S7B). In addition, the proportion of more mutated genes was visualized using the genecloud (Figure S7C). The co-occurrence and exclusive relationships between these mutant genes are shown in Figure S7D. The co-occurrence correlation between RYR1 and KMT2D was the most significant (p < .001). Kaplan–Meier’s analysis indicated that there was significant difference of OS between the high group and low TMB group (p= .033, Figure S7E). Patients with less TMB had a better prognosis, suggesting that TMB as a risk-independent prognostic factor. The differences of m6A genes expression between the high TMB and low TMB groups were calculated and visualized by “limma” package. The result of heatmap showed that these m6A regulators (HNRNPA2B1, HNRNPC, KIAA1429, YTHDF2, YTHDF1, METTL3, ZC3H13, ELAVL1, RBMX, RBM15, FTO, RBM15B) presented differential expression profiles between high group and low TMB groups (Figure S7F, Table S3).
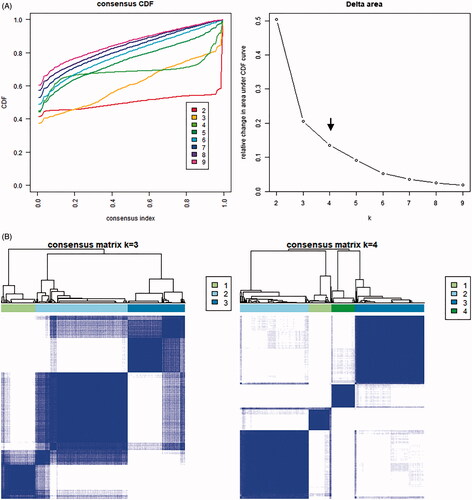
Unsupervised clustering of 24 m6A regulators in the prostate cancer cohort
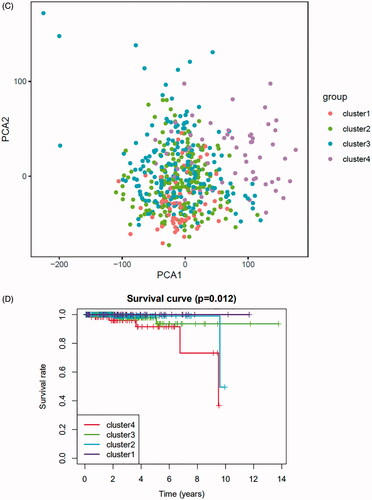
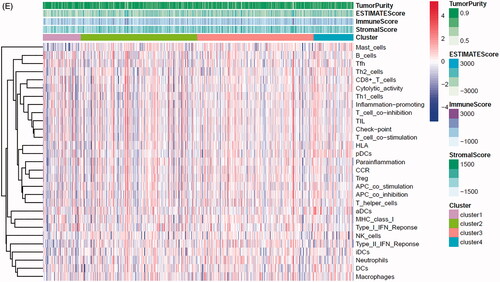
To further explore the characteristics of these m6A modification phenotypes in the different clinical traits and biological behaviours, we fixed attention on the TCGA-PRAD cohort. We selected the m6A regulators to identify subgroups of prostate cancer. Numbers of clusters were determined according to the following criteria: relatively high consistency within the cluster, relatively low coefficient of variation, and no appreciable increase in the area under the CDF curve. We calculated average cluster consensus and the coefficient of variation among clusters depending on category number (). Hence, when k = 4 () in prostate cancer could be the optimal choice with clustering increasing from k = 2–9, and we named these three clusters as m6A gene cluster 1–4, respectively. Principal component analysis (PCA) could better distinguish cluster 4 and other clusters (), indicating a good predictive value. Kaplan–Meier’s survival analysis of revealed significant differences in prognosis among the four clusters (p= .012), cluster 1 had the best survival, while cluster 4 had the worst survival. However, there was no relationship between clinicopathologic characteristics and clusters (Figure S8A). The 29 immune-related gene signature in different clusters was presented in the heatmap with TME scores as the annotations (). The result of revealed unsupervised clusters were related to TME, patients in cluster 4 had a highest significant immune scores, estimate scores, stromal scores and a lowest tumour purity. There were significant differences between group 1 and group 4 in comparison between immune scores, estimate scores, stromal scores and tumour purity. The differences of m6A genes expression between the four clusters were calculated and visualized by “limma” package. The results showed that 21 m6A regulators presented differential expression profiles (). The above results strongly suggested that the unsupervised clustering of 24 m6A regulators was significantly correlated with TME.
Figure 5. Unsupervised clustering of 24 m6A regulators in the TCGA prostate cancer cohort. (A) Criteria for selecting number of categories. (B) Colour-coded heatmap corresponding to the consensus matrix for k = 3–4 obtained by applying consensus clustering. Colour gradients represent consensus values from 0 to 1; white corresponds to 0 and dark blue to 1. (C) Principal component analysis for the transcriptome profiles of four m6A gene clusters, showing a remarkable difference on transcriptome between different clusters. (D) Kaplan–Meier’s plot showing the OS for the four clusters. (E) The heatmap shows the unsupervised clustering of the 29 immune cell types from TCGA cohort among four m6A gene clusters. The distribution of tumour microenvironment (TME) was compared among four clusters. (F) The TME scores (immune scores, estimate scores, stromal scores, tumour purity) were compared among four clusters. (G) Difference in the expression of m6A regulators among four clusters. The asterisks represented the statistical p value (*p < .05, **p < .01 and ***p < .001).
Constructing and evaluating the risk prediction model by 24 m6A regulators
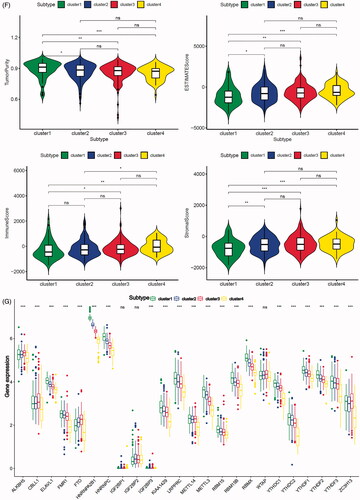
In order to investigate the prognostic value of these 24 m6A genes in prostate cancer, univariate cox survival regression analysis was performed based on the expression levels of the m6A regulators from TCGA-PRAD cohort (). We selected the survival associated eight m6A regulators (p < .1) as candidates to create a lasso regression model. The lasso analysis results showed that four genes (HNRNPA2B1, ELVAL1, METTL14 and YTHDF2) were the powerful composed factors of prostate cancer risk prediction model (Figure S8B). All samples in TCGA-PRAD cohort were divided into two groups according to the median value of risk score in our model. In the m6A risk prediction model, the risk scores and the number of deaths were significantly higher in the high risk group compared to the low risk group, and the heatmap of composed genes expression is shown in . The expression levels of the m6A regulators in high-risk and low-risk group were presented in the heatmap with clinicopathologic variables as the annotations (). In this risk prediction model, the results showed that there were significant differences between the high-risk and low-risk groups in term of stage T (p < .05), and stage N (p < .01). Univariate and multivariate Cox regression analyses were performed to test whether the risk model was an independent prognostic factor. As a result, only the risk score was significantly related to OS of prostate cancer patients in both univariate (p= .022, Figure S8C) and multivariate Cox regression analyses (p = .044, Figure S7D). The ROC curve was used to assess the sensitivity and specificity of the risk model and the result showed that AUC values were 0.78, suggesting well-prediction performances (). Kaplan–Meier’s survival analysis revealed that the high-risk group had significantly shorter survival time compared to low-risk group (). Among the four m6A regulators that was built of the risk prediction model, the expression levels of risk score were related to stage T (p < .001) and stage N (p= .002, ), HNRNPA2B1 expression levels were related to stage T (p < .001) and stage N (p < .001, Figure S9A), ELVAL1 expression levels were related to stage T (p < .001) and stage N (p= .011, Figure S9B), YTHDF2 expression levels were only related to stage N (p= .011, Figure S9C).
Figure 6. Constructing and evaluating the risk prediction model by 24 m6A regulators use TCGA cohort. (A) The prognostic analyses for 24 m6A regulators using a univariate Cox regression model. Hazard ratio >1 represented risk factors for survival and hazard ratio <1 represented protective factors for survival. (B) The horizontal axis represents the samples, and the vertical axis represents risk scores (top), overall survival (middle) and target genes (bottom). (C) The heatmap shows the expression of the four m6A genes in high-risk and low-risk groups. The distribution of clinic-pathological characteristics was compared between the high-risk and low-risk groups. (D) ROC curve showed the predictive efficiency of the risk score. (E) Kaplan–Meier’s overall survival curve for patients with high-risk group and low-risk group. (F) The risk scores of lasso regression related to clinic-pathological factors. (G) The heatmap shows the unsupervised clustering of the 29 immune cell types from TCGA cohort among four m6A gene clusters. The distribution of tumour microenvironment (TME) was compared between the high-risk and low-risk groups. (H) The TME scores (immune scores, estimate scores, stromal scores, tumour purity) were compared between the high-risk and low-risk groups. The asterisks represented the statistical p value (*p < .05, **p < .01 and ***p < .001).
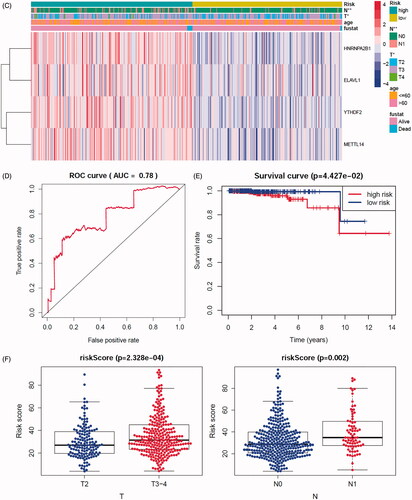
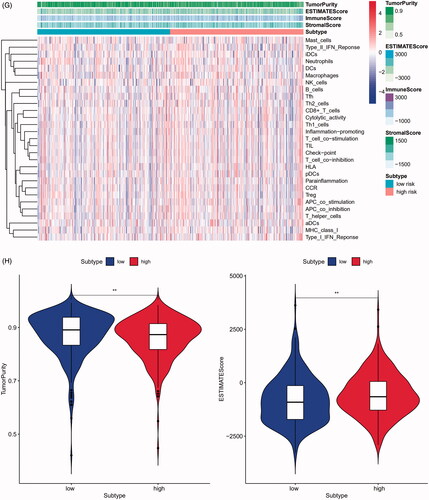
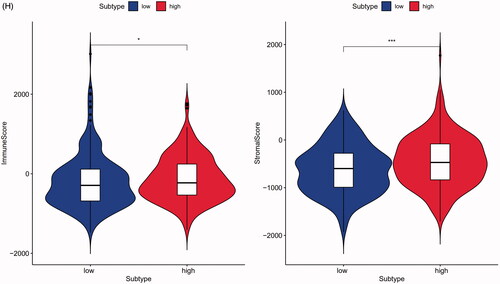
The 29 immune-related gene signature in risk prediction model was presented in the heatmap with TME scores as the annotations (). The results of revealed risk prediction model was related to TME, patients in high-risk group had a higher immune scores (p < .05), estimate scores (p < .01), stromal scores (p < .001) and a lower tumour purity (p < .01) compared to low-risk group. There were significant differences between high- and low-risk group in comparison between immune scores, estimate scores, stromal scores and tumour purity. The above results strongly suggested that the risk prediction model made by 24 m6A regulators was significantly correlated with TME.
Immune cell infiltration analysis in multiple types
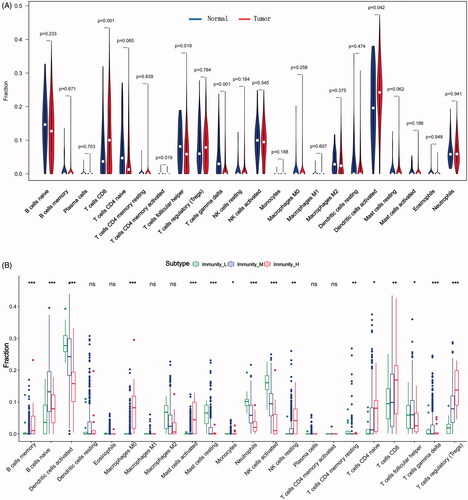
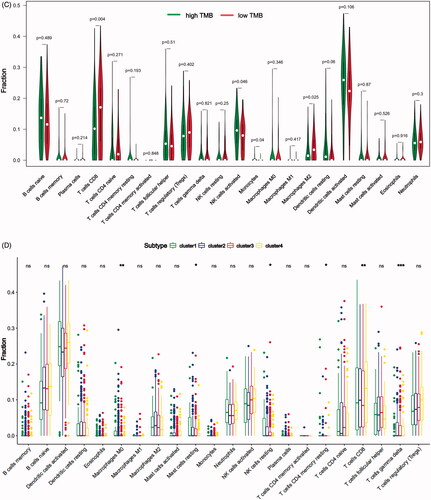
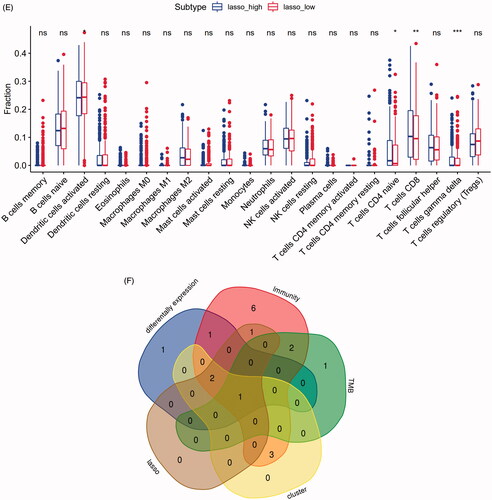
In our study, we investigated the difference of immune infiltration in prostate cancer and normal tissues in 22 subpopulations of immune cells by CIBERSORT algorithm, and the result is shown by violin plot (). The differences of 22 immune cell phenotypes in three immune infiltration clusters (high, medium, low) were calculated and visualized by “limma” package. The result of boxplot showed that 16 immune cells presented differential expression profiles between three clusters (). We then used the CIBERSORT method to compare the component differences of immune cells among the two TMB groups (). T cells CD8, NK cells activated, monocytes, macrophages M2 were considered to be related to the TMB grouping. To better depict the function of immune cell phenotypes, we examined the immune infiltration signatures in unsupervised clustering and lasso risk prediction model of m6A regulators with prostate cancer patients. The result of boxplot showed that six immune cells (T cells CD8, T cells CD4 memory resting, T cells gamma delta, NK cells resting, macrophages M0, mast cells resting) presented differential expression profiles between four unsupervised clusters (), and four immune cells (T cells CD8, T cells CD4 naive, T cells gamma delta, dendritic cells activated) were considered to be related to risk prediction grouping (). We were interested in common immune cells which are related to multiple BPs, so we focussed on the T cells CD8 in the result of the Venn diagram analysis ().
Figure 7. The landscape of immune cells infiltration in different researches. (A) The difference of 22 immune cells between prostate cancer and normal controls. (B) The difference of 22 immune cells among three immune infiltration clusters. (C) The difference of 22 immune cells between high-TMB and low-TMB groups. (D) The difference of 22 immune cells among four m6A gene clusters. (E) The difference of 22 immune cells between high-risk group and low-risk group. (F) Venn diagram shows the intersection of immune cells obtained by the above five parts. The asterisks represented the statistical p value (*p < .05, **p < .01 and ***p < .001).
Difference in the immune-associated gene sets among two T cell CD8 groups
To better illustrate the fractions of 29 immune-associated gene sets in low and high T cell CD8 groups, we tested the differences between the two T cells CD8 groups. The results showed that there was a significant difference in the level of T cells CD8 in five immune-associated gene sets (iDCs, inflammation-promoting, Th2 cells, B cells, T cell co-stimulation) (Figure S10A). We then studied the genes expression in above five immune-associated gene sets, and screening the DEGs between high and low T cells CD8 groups. The results confirmed that T cells CD8 was significantly related to the genes expression in inflammation-promoting, Th2 cells, B cells and T cell co-stimulation sets, and not related to the genes expression in iDCs set (Figure S10B–F).
Discussion
m6A plays a key role in the fate of mRNAs, including their nuclear export, translation, decay and AS [Citation19,Citation20]. Recent evidence suggests that m6A modification is closely connected to prostate cancer. VIRMA and YTHDF3 are increased in stages III/IV than in stage II in prostate cancer. Li et al. [Citation21] found that YTHDF2 is highly expressed in prostate cancer and the downregulation of YTHDF2 considerably increases the level of m6A and inhibits the proliferation and migration of prostate cancer cell lines. Cai et al. [Citation22] reported that the silencing of METTL3 by shRNA inhibits cell proliferation, colony formation and invasion of cells and inhibits the growth of tumours in vivo. However, little is known about the role of different m6A regulators in the development and progression of prostate cancer. To the best of our knowledge, this study constitutes the first systemic analysis the genetic variations (including SNP, CNV and somatic mutations) of m6A regulators in prostate cancer. We found that different genetic variations could be the prominent factors related to the different m6A regulators expression. The investigation of genetic alteration frequency showed a prevalent CNV alteration in 10 m6A regulators, and m6A regulators which experienced somatic mutations could be the prominent factors resulting in prostate cancer metastasis.
Several studies in the exploration of AS signature have previously revealed that the aberrant expression of m6A is also associated with AS [Citation23,Citation24]. We identified m6A genes and AS events which are related to OS in prostate cancer through the analysis of TCGA program to gain comprehensive insight into differential m6A regulators splicing patterns. Observations in this study provided solid evidence that one m6A gene could yield several mRNAs via AS, resulting in multiple transcripts and various proteins, some exert antagonistic functions and some exert coordinating functions. However, more m6A genes play antagonistic role in survival in our research. This finding did not align with the previous study that reported most survival associated AS events in ovarian cancer were favourable prognostic factors [Citation25]. Conversely, prostate cancer exhibits higher levels of adverse prognostic factors, but lower levels of favourable prognostic factors. Therefore, AS primarily regulates disease progression through the antagonizing functions of splice variants. One variant from AS might affect the regular function of another variant.
ssGSEA was implemented to calculate the immune cell infiltration levels for each sample in order to determine the immune infiltration groups. Prognostic analysis revealed low immune infiltration cluster to be markedly related to prolonged survival, while high immune infiltration cluster was characterized by poorer survival. The patients in high immune infiltration group had a higher significant immune scores, estimate scores, stromal scores and a lower tumour purity. The lower the tumour purity, the higher the degree of heterogeneity and malignancy. This result may be the main reason for the poor survival to the patients in high immune infiltration group. As most studies focus on single TME cell type or single regulator, the overall TME infiltration characterizations mediated by integrated roles of multiple m6A regulators are not comprehensively recognized. Identifying the role of distinct m6A modification patterns in the immune infiltration will contribute to enhancing our understanding of TME antitumor immune response, and guiding more effective immunotherapy strategies. From the three databases, we analysed the differential m6A regulators in the high and low groups. At the same time, HNRNPA2B1 and METTL3 of the above three clusters were identified as the immune strongly related genes associated with prostate cancer. These results may illustrate that HNRNPA2B1 and METTL3 expression may affect the immune microenvironment of prostate cancer to a certain extent, this is consistent with the conclusion of the recent study [Citation26,Citation27], and thus supports the reliability of our conclusions to a large extent.
TMB is associated with the abundance of neoantigens and increased immunogenicity. In this study, T cells CD8 and macrophages M2 cell infiltration in the high TMB group was significantly higher than that in the low TMB group for prostate cancer patients. However, it should be noted that the correlation between the infiltration of different immune cells and the level of TMB was not consistent in our research. NK cells activated and monocytes infiltration in the high TMB group was significantly lower than that in the low TMB group for prostate cancer. Patients in the low TMB group had a better prognosis in our study. However, higher TMB was associated with better prognosis for the patients likely with immunotherapy such as melanoma. The reason behind the discrepancy to our results could be that most of the TCGA patients were not treated with immunotherapy [Citation28]. Further, the differences between expression of m6A regulators have been proved to be significantly associated with TMB and immune related biological pathways. These DEGs were considered as m6A-related signature genes. The above results strongly suggested that m6A regulators was significantly correlated with immune infiltration, TMB, SNP, CNV and AS. Our study not only focuses on immune-related m6A genes, and uses strict standard layer screening to obtain genes which may be potential prognosis targets of prostate cancer.
Further, in this study, four m6A gene clusters were identified based on m6A regulators, which were significantly correlated with survival. The mRNA transcriptome differences between distinct m6A gene clusters have been proved to be also significantly associated with m6A and TME. This demonstrated again that the m6A clusters were of great significance in shaping different TME landscapes. Therefore, a comprehensive assessment of the m6A clusters will enhance our understanding of TME cell-infiltrating characterization. Murphy et al. [Citation29] used multiple omics platforms to integrate biomarkers to improve the stratification of patients with aggressive and indolent prostate cancer. Univariate Cox regression followed by lasso regression was used to validate m6A regulators and construct a risk prediction model for prostate cancer patients in our study. The low-risk group had significantly better prognosis than the high-risk group in risk model. The results of ROC also showed that the model we constructed exhibited good classifier performance. Although the well predictive value of model was available, the significance of these m6A regulators in relation to tumour classification, survival time and prognosis need to be confirmed in more groups of patients. These findings emphasize the important role of m6A regulators in constructing tumour risk models and evaluating prognosis.
Therapeutic response of many tumours, correlates with amounts of tumour-infiltrating lymphocytes (TILs), tertiary lymphoid structures (TLSs), the number of neoantigens, and TMB [Citation30]. The distribution of T cells within the TME can be suggestive of an efficacious anti-tumour T cell response, with several groups showing enrichment for T cells at the periphery or centre related to improved outcome [Citation31]. Simoni et al. [Citation32] found that human lung and colorectal cancer CD8+ TILs can not only be specific for tumour antigens, but also found that these bystander CD8+ TILs have diverse phenotypes that overlap with tumour-specific cells. In this study, the differences of T cells CD8 fraction were related to immune infiltration, m6A gene clusters, TMB and risk scores in prostate cancer. Our data also revealed the importance of T cells CD8 in the research of prostate cancer, which is a new discovery and also consistent with the results of other tumour before. However, a large number of experiments are still needed for further study.
Our study had some limitations. First, although we found that m6A regulators play different roles in the multiple BP, such as mutational landscape, epigenome, TMB and TME. However, the potential molecular mechanisms were not evaluated, and the detailed mechanism of m6A regulators in prostate cancer warrants further investigation. Second, m6A gene clusters and risk model might improve prognosis of prostate cancer patients at a higher risk group for immunotherapy. Hence, further research is necessary to explore whether m6A regulators could be used as diagnostic markers or therapeutic targets in prostate cancer and guiding more effective immunotherapy strategies.
Conclusions
In summary, our data provide strong evidence that m6A methylation modification in the mutational landscape, epigenome, TMB and TME. m6A gene clusters and risk model might improve prognosis of prostate cancer patients at a higher risk group for immunotherapy. The difference of m6A regulators plays different roles in multiple BP. The comprehensive evaluation of individual tumour m6A modification pattern will contribute to enhancing our understanding of tumour characterization and guiding more effective immunotherapy strategies.
Author contributions
Chen Shao designed this study, Huimin Sun and Jianzhong Zheng collected data, Yue Zhao and Huimin Sun analysised data, Yue Zhao wrote this manuscript. Chen Shao revised the manuscript. All authors read and approved the final manuscript.
Supplemental Material
Download MS Word (7.1 MB)Acknowledgements
We would like to extend our sincere gratitude to our departmental chair for all their support.
Consent for publication: Consent to publish has been obtained from the participants.
Disclosure statement
The authors declare that they have no conflicts of interest.
Data availability statement
The dataset supporting the conclusions of this article is included within the article.
Additional information
Funding
References
- Siegel RL, Miller KD, Jemal A. Cancer statistics, 2018. CA Cancer J Clin. 2018;68(1):7–30.
- Damodaran S, Kyriakopoulos CE, Jarrard DF. Newly diagnosed metastatic prostate cancer: has the paradigm changed? Urol Clin North Am. 2017;44(4):611–621.
- Lo UG, Lee CF, Lee MS, et al. The role and mechanism of epithelial-to-mesenchymal transition in prostate cancer progression. Int J Mol Sci. 2017;18(10):2079.
- Hayes JH, Barry MJ. Screening for prostate cancer with the prostate-specific antigen test: a review of current evidence. JAMA. 2014;311(11):1143–1149.
- Emens LA. Breast cancer immunotherapy: facts and hopes. Clin Cancer Res. 2018;24(3):511–520.
- Schmid P, Adams S, Rugo HS, et al. Atezolizumab and Nab-paclitaxel in advanced triple-negative breast cancer. N Engl J Med. 2018;379(22):2108–2121.
- Liu Q, Liao Q, Zhao Y. Chemotherapy and tumor microenvironment of pancreatic cancer. Cancer Cell Int. 2017;17:68.
- Newman AM, Liu CL, Green MR, et al. Robust enumeration of cell subsets from tissue expression profiles. Nat Methods. 2015;12(5):453–457.
- Becht E, Giraldo NA, Lacroix L, et al. Estimating the population abundance of tissue-infiltrating immune and stromal cell populations using gene expression. Genome Biol. 2016;17(1):218.
- Safonov A, Jiang T, Bianchini G, et al. Immune gene expression is associated with genomic aberrations in breast cancer. Cancer Res. 2017;77(12):3317–3324.
- Binnewies M, Roberts EW, Kersten K, et al. Understanding the tumor immune microenvironment (TIME) for effective therapy. Nat Med. 2018;24(5):541–550.
- Quail DF, Joyce JA. Microenvironmental regulation of tumor progression and metastasis. Nat Med. 2013;19(11):1423–1437.
- Perry JK, Kelley DE. Existence of methylated messenger RNA in mouse L cells. Cell. 1974;1(1):37–42.
- Dominissini D, Moshitch-Moshkovitz S, Schwartz S, et al. Topology of the human and mouse m6A RNA methylomes revealed by m6A-seq. Nature. 2012;485(7397):201–206.
- Tong J, Flavell RA, Li HB. RNA m6A modification and its function in diseases. Front Med. 2018;12(4):481–489.
- Han D, Liu J, Chen C, et al. Anti-tumour immunity controlled through mRNA m6A methylation and YTHDF1 in dendritic cells. Nature. 2019;566(7743):270–274.
- Hanzelmann S, Castelo R, Guinney J. GSVA: gene set variation analysis for microarray and RNA-seq data. BMC Bioinformatics. 2013;14:7.
- Chen DS, Mellman I. Elements of cancer immunity and the cancer-immune set point. Nature. 2017;541(7637):321–330.
- He L, Li H, Wu A, et al. Functions of N6-methyladenosine and its role in cancer. Mol Cancer. 2019;18(1):176.
- Dai D, Wang H, Zhu L, et al. N6-methyladenosine links RNA metabolism to cancer progression. Cell Death Dis. 2018;9(2):124.
- Li J, Meng S, Xu M, et al. Downregulation of N6-methyladenosine binding YTHDF2 protein mediated by miR-493-3p suppresses prostate cancer by elevating N6-methyladenosine levels. Oncotarget. 2018;9(3):3752–3764.
- Cai J, Yang F, Zhan H, et al. RNA m6A methyltransferase METTL3 promotes the growth of prostate cancer by regulating Hedgehog pathway. Onco Targets Ther. 2019;12:9143–9152.
- Patil DP, Chen C-K, Pickering BF, et al. m(6)A RNA methylation promotes XIST-mediated transcriptional repression. Nature. 2016;537(7620):369–373.
- Xiong W, Gao D, Li Y, et al. Genome-wide profiling of chemoradiation-induced changes in alternative splicing in colon cancer cells. Oncol Rep. 2016;36(4):2142–2150.
- Zhu J, Chen Z, Yong L. Systematic profiling of alternative splicing signature reveals prognostic predictor for ovarian cancer. Gynecol Oncol. 2018;148(2):368–374.
- Luo Y, Sun Y, Li L, et al. METTL3 may regulate testicular germ cell tumors through EMT and immune pathways. Cell Transplant. 2020;29:963689720946653.
- Zhang X, Flavell RA, Li HB. hnRNPA2B1: a nuclear DNA sensor in antiviral immunity. Cell Res. 2019;29(11):879–880.
- Rizvi NA, Hellmann MD, Snyder A, et al. Cancer immunology. Mutational landscape determines sensitivity to PD-1 blockade in non-small cell lung cancer. Science. 2015;348(6230):124–128.
- Murphy K, Murphy BT, Boyce S, et al. Integrating biomarkers across omic platforms: an approach to improve stratification of patients with indolent and aggressive prostate cancer. Mol Oncol. 2018;12(9):1513–1525.
- Topalian SL, Drake CG, Pardoll DM. Immune checkpoint blockade: a common denominator approach to cancer therapy. Cancer Cell. 2015;27(4):450–461.
- Spranger S. Mechanisms of tumor escape in the context of the T-cell-inflamed and the non-T-cell-inflamed tumor microenvironment. Int Immunol. 2016;28(8):383–391.
- Simoni Y, Bech E, Fehlings M, et al. Bystander CD8+ T cells are abundant and phenotypically distinct in human tumour infiltrates. Nature. 2018;557(7706):575–579.