
Abstract
Viral infection seriously affects the survival and life quality of transplanted patients without an accurate diagnosis during the early stage. Herein, we aimed to develop a novel diagnostic method based on non-coding RNAs expression in peripheral blood. An immunosuppressive mouse model of viral infection after transplantation was established. Differentially expressed non-coding RNAs were distinguished by microarray analyses in the virus-infected group. After homology analysis, 46 miRNAs and 24 lncRNAs were further verified by qRT-PCR in the peripheral blood samples of transplanted patients. Compared with normal transplanted patients, miR-29b, miR-185, and NR_073415.2 were significantly downregulated in the PBMC of post-transplant patients with viral infection. Based on the expression of the above three RNAs, principal component analysis (PCA) identified a slight overlap between the two groups. A 3-non-coding-RNA detection panel was constructed by the support vector machine analysis (SVM), whose loss rate was 14.71%. The area under the curve of it was 0.909. With the optimal cut-off value (Y = 0.328), the sensitivity was 0.929 and the specificity was 0.781. Therefore, based on non-coding RNAs expressions, a detection panel for viral infection after organ transplantation was formed with high diagnostic specificity and sensitivity.
Introduction
Organ transplantation has been a life saviour for many patients suffering from end-stage diseases such as liver and renal failure [Citation1]. Improvements in surgical techniques and developments of effective immunosuppressive drugs have also contributed to the favourable survival of these patients [Citation2]. However, immunosuppressants keep the recipient in an immunosuppressed state, leading to an increased risk of infections [Citation3]. In addition, the occurrence of infections may also lead to the activation of the immune system, thereby increasing the risk of transplant rejection [Citation4]. Hence, to further improve the long-term survival and life quality of transplanted patients, more research should be conducted to decrease the risk of infection in these patients.
Viruses are a common pathogen in post-transplant patients and are associated with increased morbidity and mortality [Citation5]. The cytomegalovirus (CMV) impairs T cell and phagocytic function, as well as cytokine dysregulation, leading to opportunistic infections, rejection, graft loss, and reduced patients’ survival [Citation6]. BK polyomavirus (BKV) is a significant risk factor for renal transplant dysfunction and allograft loss [Citation7]. The human parvovirus B19 (B19V) infection is closely related to persistent anaemia [Citation8]. Besides, Epstein–Barr virus (EBV), an oncogenic γ-herpesvirus, may cause post-transplantation lymphoproliferative disorder (PTLD) and even malignancies [Citation9]. Therefore, the early diagnosis and treatment of viral infections are crucial for organ transplant recipients.
At present, the diagnosis of viral infection after organ transplantation mainly depends on the patients' clinical signs and symptoms such as fever and cough, or general laboratory and imaging tests, such as white blood cell counting and chest X-ray. Due to the application of immunosuppressants, most of the signs and symptoms may turn atypical, and the results of laboratory and imaging tests may also become non-specific [Citation10]. Pathogenic tests, such as virus DNA or RNA, or its specific antibodies, are the gold standard for diagnosing viral infections [Citation11]. However, during the early stage of infection, these tests are prone to false-negative results, increasing the difficulty of prompt clinical diagnosis. In addition, when rejection occurs at the same time, the diagnosis of viral infection may become more difficult because both may have similar symptoms such as fever. Thus, it is imperative to develop novel methods for quick and accurate diagnosis of viral infection in transplanted patients.
MicroRNAs (miRNAs) and long non-coding RNAs (lncRNAs) are two well-known kinds of non-coding RNAs that play critical roles in various pathophysiological processes [Citation12–15]. They change rapidly during the occurrence and development of human diseases, sensitively reflect dynamic changes of the human microenvironment and may potentially act as new biomarkers for the diagnosis of diseases. It was reported that non-coding RNAs were involved in the pathogenesis of viral infection and contributed to prognosis prediction [Citation16–22]. Nevertheless, the diagnostic value of miRNA and lncRNA in patients’ viral infection remains unclear, especially in those after organ transplantation and their role needs to be further clarified. Here, we aimed to explore the differentially expressed profiles of miRNA and lncRNA in the peripheral blood of infected and non-infected organ transplant recipients. Moreover, based on quantitative reverse transcription-polymerase chain reaction (qRT-PCR) verification and clustering methods, new biomarkers were discovered to establish a mathematical model for the accurate diagnosis of post-transplant virus infection.
Method and materials
Study design
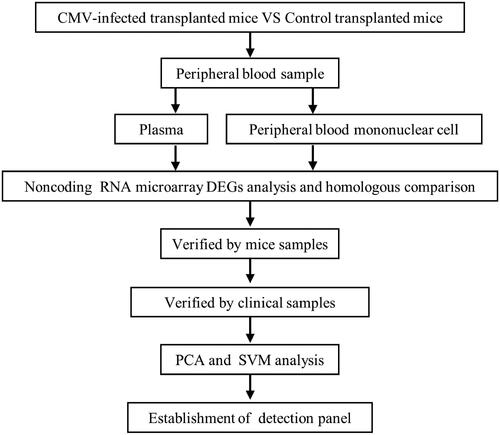
First, a mouse model of CMV infection after skin transplantation was constructed. Then, we collected the peripheral blood samples and extracted RNA for miRNA and lncRNA microarrays. After analysing the microarray data, we identified the differentially expressed miRNA and lncRNA as well as the homologous ones. Furthermore, mouse model samples and peripheral blood samples from clinical post-transplant patients were used to verify significantly differentially expressed miRNAs and lncRNAs. Finally, clustering methods were adopted to model miRNA and lncRNA and to test the efficiency of the non-coding RNA detection panel for viral infection after organ transplantation ().
Figure 1. Flow diagram of the study design.
Animal model
Male C57BL/6J mice, aged 6–8 weeks, were adopted as donors, while male Balb/c mice of the same age were selected as recipients. Skin transplantation was performed on the back of mice, and cyclosporine A (CsA; Novartis Pharma Ltd, Germany; 30 mg/kg/day) was administrated to establish a mouse skin transplantation model [Citation23]. On the 7th day after skin transplantation, 200 µL CMV (ATCC ®VR-1399 virus, USA) suspension with a concentration of 5 × 10⁶ PFU/mL was injected into those mice through their tail vein to create a CMV-infected post-transplant mice model. The peripheral blood of the virus-infected group was collected five days after infection and that of the control group was also collected at the same time.
Sample collection
There were 1008 peripheral blood samples prospectively collected from febrile patients after organ transplantation at the First affiliated Hospital of Sun Yat-sen University (Guangzhou, China) from June 2014 to December 2015. The infection spectrum included common bacteria, fungi, and viruses (CMV, BKV, EBV, and B19V). Recipients who had undergone liver, kidney, heart, or hepatopancreaticoduodenal cluster transplantation were included. Besides, 70 early and long-term infection-free peripheral blood samples from post-transplanted patients were collected as normal controls. The inclusion criteria for patients with fever were as follows. (1) Clinically confirmed or highly suspected infection. (2) Body temperature was higher than 38.5 °C. (3) Anti-infective regimen was not yet started, or the fever remained sustainable after the anti-infective regimen was used, indicating that the infection was not well controlled. (4) Fully understand the research plan and sign the informed consent form. Exclusion criteria were as follows. (1) Fever caused by acute rejection or drug allergy. (2) Severe coagulation dysfunction, blood system disease, or critical conditions which were not suitable for blood sampling. None of them showed signs of tumour occurrence or recurrence at the time of sampling.
Viral detection
The samples from patients with fever were further tested for pathogen identification. The viruses’ DNA was detected with a real-time quantitative PCR diagnostic kit (Da an Gene Co., Ltd. of Sun Yat-sen University, China) using an ABI 7500 PCR instrument (ThermoFisher, USA). The detection limit was 102–107 copies/mL. Serum immunoglobulin M (IgM) antibodies of CMV and EBV were detected quantitatively with a chemiluminescence immunoassay using an ARCHITECT i2000 (Abbott, USA) Automated immunoassay analyser. If the virus-specific IgM is significantly elevated, or its DNA is positive, it indicated that the patient had a virus infection. Such samples were used for miRNA or lncRNA detection. The demographic and clinical features of these patients are shown in Table S1.
Separation and preservation of peripheral blood
The peripheral blood of mice or organ transplant patients was anticoagulated with EDTA and separated at 4 °C with a 200 g centrifuge. After 15 min, the upper plasma was removed and frozen in the refrigerator at −80 °C. Resuscitation of the lower layer cells with the same volume of PBS was performed and was added to another centrifuge tube containing the same volume of peripheral blood lymphocyte separation solution (GE, USA, 17144003) and centrifuged at 450 g at 4 °C. After 20 min, the second layer of annular milky white lymphocytes was transferred to another centrifuge tube and 10 ml PBS was added to wash the cells, centrifuged at 450 g at 4 °C for 10 min and then add 10 ml PBS buffer to wash the cells. The above centrifugal operation was repeated, the upper liquid was discarded, 1 ml of TRIzol solution (ThermoFisher, USA, 15596026) was added to dissolve the lower precipitate, and blow repeatedly. Finally, the TRIzol sample was stored in the refrigerator at −80 °C for further use.
Total RNA extraction and reverse-transcription PCR
Total RNA was isolated by using TRIzol reagent according to the manufacturer’s instructions (ThermoFisher, USA, 15596026). cDNA was synthesised from 1 μg of total RNA in 20 µL reaction volumes. In the miRNA reverse-transcribed (RT) reaction experiment, we used All-in-One™ miRNA First-Strand cDNA Synthesis Kit (Genecopoeia, USA, QP007). In lncRNA RT reaction, PrimeScriptTM RT Master Mix (TAKARA, Japan, RR036A) was used. Real-time PCR was performed with Power SYBR PCR Master Mix (Genecopoeia, USA, 4367659) using 2 µL of the cDNA as a template. The amplification reactions were run with 45 thermocycles of 30 s at 94 °C, 30 s at 55 °C, and 30 s at 72 °C in an ABI PRISM 7500 Real-time PCR System (ThermoFisher, USA). The primer sequences are listed in Tables S2 and S3. To calculate the relative expression of different genes, the threshold cycle (Ct) values of target genes were normalized to those of GAPDH or U6 by the 2−ΔΔCt method.
Microarray
For miRNA microarray, according to the instructions of the miRCURYTM Hy3TM/Hy5TM fluorescence labelling kit (Exiqon, Denmark, 208031-A), RNA was prepared and hybridized on the miRCURYTM LNA Array chips (Exiqon, Denmark, v.18.0) and then detected by Axon GenePix 4000B chip scanner (Molecular Devices, USA). For lncRNA microarray, according to the protocols of mRNA-ONLY gel Eukaryotic mRNA Isolation Kit (Epicentre, USA, MOE51010) and RNeasy Mini Kit (Qiagen, Germany, 74104), RNA was prepared, reverse-transcribed, hybridized on Mouse LncRNA Array chips (Arraystar, USA, v2.0) and scanned by Agilent DNA microarray chip scanner (Agilent, USA, G2505C). Agilent Feature Extraction software (Agilent, USA, 11.0.1.1) and GeneSpring GX software (Agilent, USA, v12.0) were used to calculate and normalize the gene expression. All the microarray data were deposited in the supplementary material.
Ethical approval
The study protocol was approved by the Ethical Committee of The First Affiliated Hospital of Sun Yat-sen University (No. 2013102) and was conducted according to the Declaration of Helsinki principles. Informed consent was obtained from all participants.
Data analysis and statistics
We selected differentially expressed miRNA and lncRNA from the volcanic diagram. The MEV software (TIGR, USA, v4.6) was used for cluster analysis. Humanization of miRNA and lncRNA was based on miRBase and blast database. The SPSS 13.0 software was used for statistical analysis, and the experimental data were expressed as mean ± standard deviation. The difference was statistically significant when p < .05. Pearson correlation analysis was performed among the features, and the principal component analysis (PCA) was used to identify the main effective indicators. Support vector machine analysis (SVM) from R package “e1071” was used to establish the mathematical model of infection diagnosis.
Result
Identification of differentially expressed miRNAs and lncRNAs in the murine model
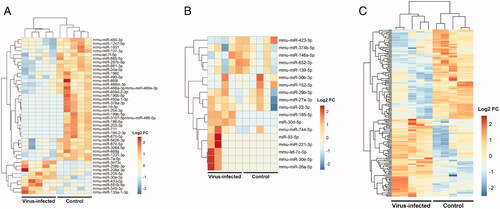
The murine model of virus infection after skin transplantation was stable and all the transplanted skin was alive with fur on it at the time of peripheral blood collection. Gene microarrays were performed to detect the differentially expressed miRNAs and lncRNAs. Compared with the plasma of the normal group, there were 21 miRNAs up-regulated and 21 miRNAs downregulated in the virus-infected group. In peripheral blood mononuclear cells (PBMC) of the virus-infected group, there were 10 miRNAs and 167 lncRNAs upregulated. While 22 miRNAs and 195 lncRNAs downregulated at the same time ().
Figure 2. Identification of differentially expressed miRNAs and lncRNAs in a murine model of CMV infection after skin transplantation. (A) Heatmap of differentially expressed miRNAs in the plasma. (B) Heatmap of differentially expressed miRNAs in PBMC. (C) Heatmap of differentially expressed lncRNAs in PBMC.
Verification of novel non-coding RNA biomarkers for viral infection after organ transplantation
Through human-mouse homology analysis based on miRBase and blast, we acquired 20 miRNAs upregulated and eight miRNAs downregulated in the plasma of the virus-infected group. In the PBMC of the virus-infected group, there were eight miRNAs and 14 lncRNAs upregulated. While 10 miRNAs and 10 lncRNAs downregulated at the same time.
After qRT-PCR verification in peripheral blood samples from the murine model and those from patients with a viral infection, we found that miR-29b, miR-185, and NR_073415.2 in the PBMC of virus-infected patients were significantly lower than those in the normal post-transplanted patient (). Compared with healthy patients after transplantation, miR-29b decreased to 29.6% in CMV-infected patients, 18.1% in BKV-infected patients, 13.4% in B19V-infected patients, and 12.0% in EBV-infected patients. Among all virus-infected patients, miR-29b dropped to an average of 21.9% of the control group (). Similarly, compared with healthy patients in the control group, miR-185 decreased to 29.5% in CMV-infected patients, 20.2% in BKV-infected patients, 19.3% in B19V-infected patients, and 11.4% in EBV-infected patients. In all patients with virus infection, miR-185 decreased to an average of 23.2% of the control group (). In contrast to the control group, NR_073415.2 decreased to 44.5% in CMV-infected patients, 69.3% in BKV-infected patients, and 10.8% in B19V-infected patients, but there was no significant change in EBV-infected patients. In all patients with viral infection, NR_073415.2 decreased to an average of 61.2% of the control group ().
Figure 3. Verification of novel biomarkers for viral infection after organ transplantation. (A) Real-time quantitative PCR validation of differentially expressed miRNAs and lncRNAs in the peripheral blood sample from a murine model of virus infection. (B) Real-time quantitative PCR validation of miR-29b, miR-185, and NR_073415.2 in PBMC from patients with viral infection after organ transplantation. (C) Expression of miR-29b in PBMC from patients with CMV, BKV, B19V, and EBV infection. (D) Expression of miR-185 in PBMC from patients with CMV, BKV, B19V, and EBV infection. (E) Expression of NR_073415.2 in PBMC from patients with CMV, BKV, B19V, and EBV infection. (F) Dynamic monitoring of the expression of miR-29b, miR-185, and NR_073415.2 in PBMC of virus-infected patients after organ transplantation. *p < .05, **p < .01, ***p < .001.
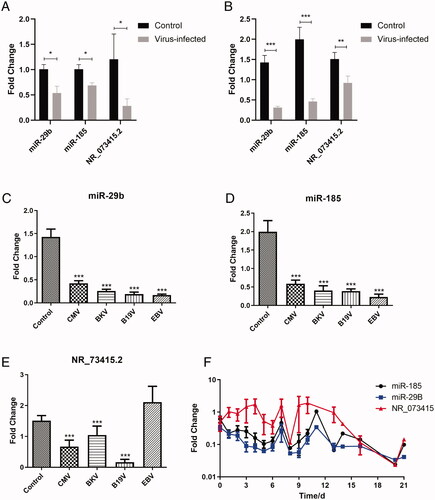
To preliminarily explore the temporal specificity of the above-mentioned biomarkers, we dynamically monitored the expression of miR-29b, miR-185, and NR_073415.2 in the PBMC of 21 virus-infected patients after organ transplantation. The expression of miR-29b and miR-185 was down-regulated in the early stage of infection (1–3 days) and lasted for more than 21 days, while NR_073415.2 decreased slowly in the middle and late stage of infection ().
Correlations among novel non-coding RNA markers and the proportion of immune cells
To tentatively explore the relationship between the above biomarkers and immune cells, Pearson correlation analysis was performed. As shown in and Citation2, in normal transplanted patients, miR-29b was positively correlated with neutrophil proportion and negatively correlated with lymphocyte proportion, which was similar to those in CMV-infected recipients, while miR-185 was positively correlated with white cell counts and neutrophil proportion, and negatively correlated with monocyte proportion in post-transplanted patients suffering CMV infection (). Besides, NR_73415.2 was negatively correlated with the proportion of monocytes in transplanted patients infected with BKV ().
Table 1. Correlations among white blood cell classification, miRNAs, and lncRNAs in normal transplanted patients.
Table 2. Correlations among white blood cell classification, miRNAs, and lncRNAs in CMV infected transplanted patients.
Table 3. Correlations among white blood cell classification, miRNAs, and lncRNAs in BKV infected transplanted patients.
Biomarker’s expression pattern analysis and establishment of the classification model
There was a mild overlap in the expression pattern of miRNAs and lncRNAs between normal post-transplanted patients and virus-infected ones (). The dCT value of three biomarkers of normal post-transplanted patients (n = 70) and CMV or BKV infected patients (n = 32) were entered into computer. The fitting equation was Y = Beta1 * miR-185 + Beta2 * miR-29B + Beta3 * miR-73415.2 + Bias, where Beta = [−0.223; −0.973; −0.444], Bias = 5.55. The equation Y cut-off point of virus-infected patients was no less than 1.09, and the lowest critical value of normal patients was no more than −2.31.
Figure 4. Analysis of biomarker expression patterns and establishment of the classification model between normal and virus-infected patients after organ transplantation. (A) PCA analysis between normal and virus-infected patients after organ transplantation. (B) SVM analysis between normal and virus-infected patients after organ transplantation.
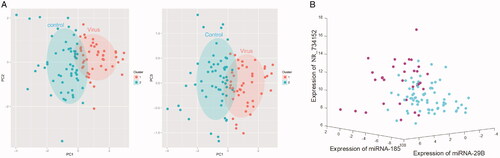
A total of 38 support vectors were identified in this process. After support vector machine training, the cross-function was used for 10 times of cross-validation, in which the category loss rate was 14.71% (). The best cut-off value was found by drawing the receiver operating characteristic (ROC) curve and using the Youden index, equal to sensitivity + specificity−1. When the Youden index reaches the maximum, the corresponding value is the best cut-off value. The area under the curve of our panel was 0.909, the optimal cut-off value Y for viral infection was 0.328, the sensitivity was 0.929 and the specificity was 0.781.
Discussion
In this study, using microarray screening, homology analysis, and qRT-PCR verification, we found that miR-29b, miR-185, and NR_073415.2 in PBMC of post-transplanted patients with viral infection were significantly lower than those in normal patients. Furthermore, based on clustering methods, we established a 3-noncoding-RNA detection panel for diagnosing viral infection in post-transplant patients, whose diagnostic specificity and sensitivity were relatively high.
With 20–25 nucleotides in length, miRNA recognizes target mRNA by base complementary pairing, forming a silencing complex to degrade target mRNA or suppress target mRNA translation [Citation24]. It is involved in a variety of biological regulatory pathways, including cell proliferation and apoptosis, fat metabolism, growth, and development, organ formation, virus defence, and more [Citation25,Citation26]. Bruni R et al. found that the levels of miR-29a and miR-29b in the pathological tissues of patients with hepatitis C viral (HCV) infection were significantly lower than those of patients with B-cell non-Hodgkin's lymphoma without viral infection through paraffin tissue specimens [Citation27]. Besides, Binghui Xia et al. confirmed that miR-29b was significantly downregulated in influenza A virus-infected A549 cells [Citation28], which is consistent with our research results.
It was found that macrophages and dendritic cells secreted oxysterol 25 hydroxycholesterol (25-HC) during HCV infection, which can further stimulate the liver to produce miR-185, significantly limiting the host metabolic pathway which is critical to the HCV life cycle. Viral infection reduces miR-185 and miR-130b levels to promote lipid accumulation and counteract the antiviral effect of 25-HC [Citation29]. It is consistent with our findings that effective immune regulatory response was limited and miR-185 decreased when affected by the viral invasion. Other studies have shown that miR-185 could inhibit the activation of human immature B cells by downregulating EphB2 to attenuate the src-p65 and Notch1 signalling pathways [Citation30]. In addition, the increased level of miR-185 weakened the development of T cells and led to peripheral T lymphopenia. Endoplasmic reticulum calcium regulator mzb1 is one of its targets [Citation31]. In other words, the decrease of miR-185 level during virus infection could be due to spontaneous regulation of the immune system. Downregulation of miR-185 can regulate EphB2 and mzb1, then promote the development of B cells and T cells, and jointly resist viral invasion.
LncRNA, with more than 200 nucleotides in length, regulates gene expression at the epigenetic, transcriptional, and post-transcriptional levels [Citation32]. Recent studies have shown that lncRNA is involved in X-chromosome silencing, genomic imprinting, chromatin modification, transcriptional activation, transcriptional interference, and intranuclear transport [Citation33]. In this study, one long noncoding RNA, NR_073415.2 (also called HSP90AB4P, heat shock protein 90 α family B4, pseudogene), was found to assist in diagnosing viral infection after organ transplantation. NR_073415.2 is also called NR_033595 in mice, which is related to immune infiltration in tumours [Citation34–36]. However, its function in viral infection, especially in post-transplanted recipients, is yet to be elucidated. As far as we know, our study is the first to report the relationship between NR_073415.2 and viral infection.
In this study, we adopted several clustering methods to further mine and process the data. The PCA is a statistical method for dimensionality reduction and is used to identify the main effective indicators. It can reduce the indicators needed to be analysed and avoid the loss of original information as much as possible, to achieve a comprehensive analysis of the target data [Citation37]. Each sample was represented by a vector based on miRNA and lncRNA expression patterns. Then, the K-mean method was used to cluster all samples according to the first three main components. The graph displays the first and second major components (PC1 and PC2) or the first and third major components (PC1 and PC3) in two dimensions. The results showed that there was a certain degree of overlap between the virus-infected patients and the normal ones.
SVM is a supervised calculation method, which has been applied to a wide range of pattern recognition problems. The goal of the SVM is to find an optimal hyperplane (classifier) to separate different classes of objects as correctly as possible. It is achieved by leaving the maximum possible partial points of the same class on the same side and maximizing the distance between any class and the hyperplane [Citation38]. Since SVM is based on the error with the least structural risk rather than the smallest error of misclassification on the training set, the over-fitting problem can be effectively avoided. In this study, we used SVM to fit a mathematical model for the diagnosis of viral infection in transplanted patients and verified the error rate by computer model test.
Compared with traditional diagnostic methods, our 3-non-coding-RNA detection panel has the following advantages in diagnosing viral infection after organ transplantation. First, the expressions of detection indices are stable and not affected by immunosuppressive drugs. Moreover, miRNA and lncRNA are the reaction products of organisms against pathogen invasion, which changes quickly and can be detected in the early stage of infection, especially when the infection is still localised. Finally, the diagnosis can be conducted rapidly and accurately with only a small amount of peripheral blood sample, which is convenient for clinical application.
Biswas S et al. developed and validated a plasma miRNA panel for detecting early stage of HIV-1 infection and could help initiate early antiretroviral treatment, which consists of miR-16-5p, miR-20b-5p, miR-195-5p, and miR-223-3p [Citation39]. Loureiro D et al. summarized miRNAs upregulated or downregulated during fibrosis progression, including miR-143, miR-143, miR-21, indicating their potential use as non-invasive biomarkers to diagnose fibrosis to prioritize patients with advanced fibrosis for treatment and surveillance [Citation40]. The above research suggests that combining several miRNAs and lncRNAs has advantages for improving diagnostic efficiency and certain application prospects.
There were still some deficiencies in our research. First, the sample capacity was too small to get a common conclusion. Moreover, for the dynamic changes of biomarkers during the infection process, our monitoring cases are relatively lacking. In most cases, we cannot know the exact time when the patients were infected with the pathogen, so we can only obtain specimens and information through the review and follow-up of patients with fever. Besides, due to limitations in clinical practice, the sample collection time of 21 patients monitored in this study could not be completely unified. In addition, the specificity and accuracy of diagnostic methods were only verified by computer simulation and needed to be determined by multi-centre clinical trials with large samples. The specific mechanism of dynamic changes in miRNA and lncRNA during infection has not been fully elucidated.
In conclusion, we found that miR-29b, miR-185, and NR_073415.2 were downregulated in PBMC of post-transplanted patients with viral infection. By clustering methods, a 3-noncoding-RNA detection panel for post-transplant viral infection was built up based on the expression of the abovementioned RNAs. Though the panel has high diagnostic specificity and sensitivity, its clinical application value still needs to be further confirmed by multi-centre prospective clinical trials.
Ethics approval and consent for participation
Approval for this study was obtained from the Ethics Committee of the First Affiliated Hospital of Sun Yat-sen University and was carried out according to the ethical standards of the Declaration of Helsinki. The First Affiliated Hospital of Sun Yat-sen University approved all animal studies, which were performed according to its guidelines.
Supplemental Material
Download MS Word (14.8 KB)Supplemental Material
Download MS Word (14.3 KB)Supplemental Material
Download MS Word (16.6 KB)Disclosure statement
The authors declare that they have no conflict of interest.
Data availability statement
The raw data of microarray were listed in the supplemental materials. The availability of other data and information used and analysed in the current study can be provided by the corresponding author upon reasonable request.
Additional information
Funding
Related Research Data
References
- Barker CF, Markmann JF. Historical overview of transplantation. Cold Spring Harb Perspect Med. 2013;3(4):a014977.
- Brandi G, Ricci AD, Rizzo A, et al. Is post-transplant chemotherapy feasible in liver transplantation for colorectal cancer liver metastases? Cancer Commun (Lond)). 2020;40(9):461–464.
- Scanlon N, Saklawi Y, Rouphael N. The role of systems vaccinology in understanding the immune defects to vaccination in solid organ transplant recipients. Front Immunol. 2020; 11:582201.
- Yu S, Su C, Luo X. Impact of infection on transplantation tolerance. Immunol Rev. 2019;292(1):243–263.
- Haidar G, Singh N. Viral infections in solid organ transplant recipients: novel updates and a review of the classics. Curr Opin Infect Dis. 2017;30(6):579–588.
- La Rosa C, Diamond DJ. The immune response to human CMV. Future Virol. 2012;7(3):279–293.
- Sawinski D, Goral S. BK virus infection: an update on diagnosis and treatment. Nephrol Dial Transplant. 2015;30(2):209–217.
- Shao EX, Wang CSW, Javorsky G. Parvovirus B19 induced red cell aplasia in a heart transplant patient diagnosed on pleural fluid. Transplantation. 2018;102(8):e367–e8.
- Le J, Durand CM, Agha I, et al. Epstein-Barr virus and renal transplantation. Transplant Rev (Orlando). 2017;31(1):55–60.
- Fishman JA. Infection in organ transplantation. Am J Transplant. 2017;17(4):856–879.
- Limaye AP, Babu TM, Boeckh M. Progress and challenges in the prevention, diagnosis, and management of cytomegalovirus infection in transplantation. Clin Microbiol Rev. 2020;34(1).
- Goodall GJ, Wickramasinghe VO. RNA in cancer. Nat Rev Cancer. 2021;21(1):22–36.
- Slack FJ, Chinnaiyan AM. The role of non-coding RNAs in oncology. Cell. 2019;179(5):1033–1055.
- Tan YT, Lin JF, Li T, et al. LncRNA-mediated posttranslational modifications and reprogramming of energy metabolism in cancer. Cancer Commun (Lond)). 2021;41(2):109–120.
- Vienberg S, Geiger J, Madsen S, et al. MicroRNAs in metabolism. Acta Physiol (Oxf)). 2017;219(2):346–361.
- Nahand JS, Vandchali NR, Darabi H, et al. Exosomal microRNAs: novel players in cervical cancer. Epigenomics. 2020;12(18):1651–1660.
- Hussen BM, Ahmadi G, Marzban H, et al. The role of HPV gene expression and selected cellular MiRNAs in lung cancer development. Microb Pathog. 2021; 150:104692.
- Yousefpouran S, Mostafaei S, Manesh PV, et al. The assessment of selected MiRNAs profile in HIV, HBV, HCV, HIV/HCV, HIV/HBV co-infection and elite controllers for determination of biomarker. Microb Pathog. 2020; 147:104355.
- Moghoofei M, Najafipour S, Mostafaei S, et al. MicroRNAs profiling in HIV, HCV, and HIV/HCV co-infected patients. Curr HIV Res. 2021;19(1):27–34.
- Nahand JS, Jamshidi S, Hamblin MR, et al. Circular RNAs: new epigenetic signatures in viral infections. Front Microbiol. 2020; 11:1853.
- Wang RQ, Long XR, Ge CL, et al. Identification of a 4-lncRNA signature predicting prognosis of patients with non-small cell lung cancer: a multicenter study in China. J Transl Med. 2020;18(1):320.
- Yang G, Zhang Y, Yang J. A five-microRNA signature as prognostic biomarker in colorectal cancer by bioinformatics analysis. Front Oncol. 2019; 9:1207.
- Theriault B, Wang Y, Chen L, et al. Long-term maintenance of sterility following skin transplantation in germ-free mice. Transplantation Direct. 2015;1(8):e28.
- Mendell JT, Olson EN. MicroRNAs in stress signaling and human disease. Cell. 2012;148(6):1172–1187.
- Takahashi K, Yamanaka S. A developmental framework for induced pluripotency. Development. 2015;142(19):3274–3285.
- Filios SR, Shalev A. β-Cell MicroRNAs: small but powerful. Diabetes. 2015;64(11):3631–3644.
- Bruni R, Marcantonio C, Pulsoni A, et al. microRNA levels in paraffin-embedded indolent B-cell non-Hodgkin lymphoma tissues from patients chronically infected with hepatitis B or C virus. BMC Infect Dis. 2014; 14 Suppl 5:S6.
- Xia B, Lu J, Wang R, et al. miR-21-3p regulates influenza a virus replication by targeting histone deacetylase-8. Front Cell Infect Microbiol. 2018; 8:175.
- Singaravelu R, O'Hara S, Jones DM, et al. MicroRNAs regulate the immunometabolic response to viral infection in the liver. Nat Chem Biol. 2015;11(12):988–993.
- Yu M, Liang W, Wen S, et al. EphB2 contributes to human naive B-cell activation and is regulated by miR-185. FASEB J. 2014;28(8):3609–3617.
- Belkaya S, Murray SE, Eitson JL, et al. Transgenic expression of microRNA-185 causes a developmental arrest of T cells by targeting multiple genes including Mzb1. J Biol Chem. 2013;288(42):30752–30762.
- Fatica A, Bozzoni I. Long non-coding RNAs: new players in cell differentiation and development. Nat Rev Genet. 2014;15(1):7–21.
- Long Y, Wang X, Youmans DT, et al. How do lncRNAs regulate transcription? Sci Adv. 2017;3(9):eaao2110.
- Xu Y, Li R, Li X, et al. An autophagy-related gene signature associated with clinical prognosis and immune microenvironment in gliomas. Front Oncol. 2020; 10:571189.
- Thompson JC, Davis C, Deshpande C, et al. Gene signature of antigen processing and presentation machinery predicts response to checkpoint blockade in non-small cell lung cancer (NSCLC) and melanoma. J Immunother Cancer. 2020;8(2):e000974.
- Xiao H, Wang B, Xiong HX, et al. A novel prognostic index of hepatocellular carcinoma based on immunogenomic landscape analysis. J Cell Physiol. 2021;236(4):2572–2591.
- Zhou C, York SR, Chen JY, et al. Long noncoding RNAs expressed in human hepatic stellate cells form networks with extracellular matrix proteins. Genome Med. 2016;8(1):31.
- Wang C, Shi X, Li W, et al. Oil species identification technique developed by Gabor wavelet analysis and support vector machine based on concentration-synchronous-matrix-fluorescence spectroscopy. Mar Pollut Bull. 2016;104(1-2):322–328.
- Biswas S, Haleyurgirisetty M, Lee S, et al. Development and validation of plasma miRNA biomarker signature panel for the detection of early HIV-1 infection. EBioMedicine. 2019; 43:307–316.
- Loureiro D, Tout I, Narguet S, et al. miRNAs as potential biomarkers for viral hepatitis B and C. Viruses. 2020;12(12):1440.