
 ?Mathematical formulae have been encoded as MathML and are displayed in this HTML version using MathJax in order to improve their display. Uncheck the box to turn MathJax off. This feature requires Javascript. Click on a formula to zoom.
Abstract
Epidermal growth factor receptor (EGFR) is the primary target for the treatment of colorectal cancer, the third most diagnosed cancer worldwide. In recent years, regulatory changes have facilitated the approval of biosimilars aimed to bring more access to biologics to patients. However, it has also expended the requirements of non-clinical characterisation data using state-of-the-art and orthogonal methodologies to demonstrate similarity between proposed biologic and its reference medicinal product (RMP). The current study was aimed to develop a stable CHO-S cell line producing panitumumab biosimilar candidate, P-mAb, a fully human IgG2 anti-EGFR monoclonal antibody and assess its physicochemical and functional similarity with RMP, Vectibix. The single-cell clone from stably transfected CHO-S cell pools was used for the production of P-mAb. This was followed by purification and comparative physicochemical and biological characterisation of P-mAb and RMP using SDS-PAGE, LC/MS, MALDI, MS/MS, CD spectrometry, DSF, SAXS, ITF, MTT assay and binding affinity. SAXS and MST assays are being used for first time in biosimilarity analysis of therapeutic monoclonal antibody. The results of structural and functional analysis of anti-EGFR P-mAb, produced by stable CHO-S cell line revealed high similarity between P-mAb and RMP, vectibix, thus providing the scientific basis of its potential for therapeutic applications.
Introduction
Biological drugs (biologics) are produced by biological processes and are in use for the treatment of various human diseases (cancer, auto-immune diseases, etc.) worldwide. The high cost of innovator biologics along with the expiry of patents of a number of these blockbuster protein drugs has given impetus to the development of biosimilars to bring more access to life-saving biologics to patients. A biosimilar is defined as a biological product that has similar properties in terms of quality, safety, and efficacy to a pre-approved biological product based on comparability of data [Citation1]. Further, a biosimilar is not expected to be identical in every aspect to RMP, however, there should not be significant differences in their structural and functional properties [Citation2]. Guidelines for quality, non-clinical and clinical requirements for the development of biosimilar mAbs were prescribed by regulatory authorities like Food and Drug Authority (FDA, USA), European Medical Agency (EMA), and in India, Review Committee on Genetic Modifications (RCGM, DBT), and Central Drugs Standard Control Organisation (CDSCO) [Citation1,Citation3,Citation4]. Over the past few years, loss of patent protection for the monoclonal antibodies has caused a significant shift in pharmaceutical industry towards the development of biosimilars and its number in the pharmaceutical pipeline is increasing expecting a rapid growth in demand in near future [Citation5,Citation6]. A list of recently approved biosimilars by US-FDA/EMA is presented in Supplementary Table ST1 [Citation7,Citation8]. About 60–70% of total biotherapeutic production uses mammalian cell culture because of the requirement of post-translational modification for proper functioning and stability [Citation9,Citation10]. Monoclonal antibodies, the largest group of recombinant proteins due to their wide applications in diagnostics and as therapeutics, are produced by cells which are originated from the single parent cell and are highly specific to the target molecule [Citation11]. Chinese hamster ovary (CHO) cells are most commonly used as it provides several advantages over other cell lines such as human-like post-translational modification of proteins, robust growth on chemically defined medium, and easy to transfect with the gene of interest (GOI) to produce stable cell clones [Citation12,Citation13].
Colorectal cancer (CRC) is the third most common cancer and third leading cause of cancer-related deaths [Citation14]. High expression of epidermal growth factor receptor (EGFR), a key factor for various cellular events, including cell survival, progression, invasion, metastasis, angiogenesis, etc., occurs in the case of CRC [Citation15]. Two anti-EGFR mAbs, cetuximab and panitumumab, are used for the treatment of CRC, and both target EGFR [Citation16]. Cetuximab is a chimeric antibody with its antigenic binding region of mouse origin, while panitumumab, a fully human antibody [Citation17,Citation18], Panitumumab was approved by the FDA and EMA for the treatment of metastatic CRC in the USA in 2006 and in European Union in 2007 () [Citation19,Citation20]. Later in 2009, the FDA restricted its use for the patient with wild-type KRAS (exon 2) mCRC [Citation21].
Table 1. Monoclonal antibodies for the treatment of mCRC and their year of approval.
Monoclonal antibodies (mAbs) are structurally and functionally complex molecules and as manufacturing process for innovator molecule (RMP) may be different, the regulatory guidance prescribes for demonstration of similarity between the RMP and its proposed biosimilar at the structural and functional levels. However, in contrast to small-molecule drugs, protein drugs do not possess fully defined and reproducible structures and hence impossible to produce identical molecules. Hence, the regulators recommend the sponsors of potential biosimilar to use a stepwise approach to develop data and information to support demonstration of similarity of proposed drug with RMP in terms of quality, safety and efficacy. The complexity of biosimilar protein therapeutics demands the application of state of the art and orthogonal analytical techniques for biosimilarity analysis. In the current study, an evaluation plan to comprehensibly assess the physicochemical and functional similarity between purified anti-EGFR P-mAb produced using a stable CHO cell line and its RMP, vectibix was developed to demonstrate its biosimilar potential.
Material and methods
Materials
CD FortiCHO™ medium (Gibco™, USA), glutamine (ThermoFisher Scientific, USA), Freedom™ pCHO 1.0 (ThermoFisher Scientific, USA), anti-clumping agent (ThermoFisher Scientific, USA), MTT assay kit TOX1 (Sigma-Aldrich, USA), and RMP Vectibix™ (Amgen Inc., USA) were used in this study. CHO-S™ cell line from ThermoFisher Scientific was used for the transfection and expression of the GOI. A431 (NCCS, INDIA) and HT29 cell line (CSIR-IMTECH, India) were used for cell proliferation inhibition assay to check the bioactivity of the mAb.
Production of P-mAb and its quantification
Batch culture was performed in a 125 ml Erlenmeyer flask containing 30 ml of CD FortiCHO™ media supplemented with 8 mM glutamine and 1% of an anti-clumping agent and using a stable CHO-S clone expressing anti-EGFR P-mAb. Flasks were inoculated with 3 × 10⁵ viable cells/ml and kept in a humidified carbon dioxide incubator shaker (Galaxy 170 R, Eppendorf, Germany) at 37 °C, 8% CO2, and 150 rpm. The samples, taken at one day intervals, were assessed for mAb concentration using UPLC (Shimadzu Corporation, Japan) equipped with a UV-Vis detector (SPD-20A) coupled to MAbPac™ protein A column (ThermoFisher Scientific, USA) kept inside an Oven (CTO-10AS VP) at 25 °C. The gradient of two buffers, A (pH 7.5; 50 mM sodium phosphate; 150 mM NaCl) and B (pH 2.5; 50 mM sodium phosphate; 150 mM NaCl) were run with a pump flow rate of 2 ml/min. Glucose and lactic acid were estimated using Aminex HPX87-H column (Bio-Rad Laboratories, Inc.) coupled with RID detector and 5 mM H2SO4 as mobile phase in isocratic mode.
Purification of P-mAb
The cell culture broth was centrifuged at 4000 g for 20 min using a benchtop centrifuge (Eppendorf, Germany). Following micro-filtration (0.22 µm) of cell-free broth, the culture filtrate was loaded onto prepacked HiTrap MabSelect Sure 5 ml column (GE Healthcare, USA) using conditions as per manufacturers instruction. P-mAb collected from protein A chromatography step was further purified using a pre-packed Sephacryl S-300 HR column (GE Healthcare, USA) connected to AKTA Avant protein purification system (GE Healthcare, USA). The eluted P-mAb, in phosphate buffer saline (pH 7.4; PBS), was concentrated using Amicon Ultra-15 30 kDa filter (Merck Millipore Ltd., Ireland) and stored at 4 °C until further analysis.
Physicochemical characterisation of the purified mAb
Sodium dodecyl sulfate–polyacrylamide gel electrophoresis (SDS-PAGE)
SDS-PAGE was performed by using the protocol described by Laemmli in reduced and non-reduced sample conditions [Citation22]. In case of non-reduced samples, 4x dye, without SDS and beta-mercaptoethanol, was used. Protein marker (Precision Plus Protein Standards, BioRad Laboratories) in the range of MW 10–250 kDa was used as standard.
Intact mass analysis
Mass analyses were done using Agilent 6550 iFunnel QTOF liquid chromatography mass spectroscopy (LC/MS) system. RMP and P-mAb samples were diluted to 1.0 mg/ml in 1% formic acid for LC/MS intact mass analysis. For reduction, RMP and P-mAb were diluted to 1.0 mg/ml in reduction buffer (pH 7.5; 25 mM Tris; 25 mM NaCl) and a concentrated tris(2-carboxyethyl) phosphine (TCEP) solution was added to obtain a final TCEP concentration of 5 mM. The solution was incubated at 37 °C for 30 min. The samples were then diluted using 1% formic acid to 0.2 mg/ml. For reduced and deglycosylated mAb subunit analysis, reduced samples were incubated overnight with PNGase F (Promega, USA) in a 1:10 ratio of enzyme to mAb at 37 °C in ammonium bicarbonate buffer (pH 7.8; 50 mM). C8 (150 × 3.0 mm) 300 Å column was used with 1% Trifluoroacetic acid (TFA) in water (buffer A) and 1% TFA acetonitrile (buffer B) as mobile phases. Following equilibration of the column with 90% buffer A and 10% buffer B, 2 µl of sample was loaded on the column with a linear gradient from 10% to 70% B in 15 min, 70–90% B from 15 to 18 min, 90–100% B from 18 to 19 min at a flow rate of 0.4 ml/min and ion chromatogram (TIC) was recorded from 100 to 1000 and 200 to 3200 for intact and reduced samples respectively. The system settings for gas temperature and VCap were kept at 270 °C and 4000 V, respectively. The system was used in positive ion mode for analysis. Agilent MassHunter qualitative analysis software was used to analyse the MS spectra, and the maximum entropy algorithm was used for the deconvolution of spectra (Supplementary Table ST2).
Peptide mapping
In-gel tryptic digestion was done using the InGel™ Blue kit (G-Biosciences, USA). Protein bands of HC and LC of purified mAb and RMP were excised from the gel after destaining and finally rinsing the gel in ultrapure water. Bands were cut into small pieces, and in-gel reduction, alkylation, and destaining were done using the kit manufacturer’s protocol. Overnight digestion using trypsin was performed at 37 °C and the digested samples were desalted and analysed using matrix assisted laser desorption ionisation time of flight (MALDI-TOF) MS/MS analysis.
Circular dichroism (CD)
Far-UV CD spectra (200–260 nm) and near-UV CD spectra (260–340 nm) of samples taken in a quartz cuvette (1 mm path length, at 20 °C) were recorded using a JASCO J-815 spectropolarimeter (Tokyo, Japan). In case of far-UV, the concentration of biosimilar P-mAb and RMP was kept at 0.25 mg/ml and the concentrations were kept at 5 mg/ml for near-UV spectra. For each sample and control, three CD spectra were recorded at far-UV and near-UV, averaged, and subtracted from 1x PBS baseline.
Differential scanning fluorimetry (DSF)
DSF was carried out on StepOne™ real-time PCR (ThermoFisher Scientific, USA) using 100 µM protein in Tris HCl (pH 7.4; 20 mM) with 100 mM NaCl as formulation buffer and each sample and blank were measured in triplicate. PCR plates were used with a 50 µL sample in each well. 1/100 ratio of Sypro™ orange dye solution (initially diluted 10 times from stock solution in Tris-HCl buffer, pH 7.2, 10 mM) to protein sample was used. The thermal denaturation of mAb was studied by increasing temperature from 20 °C to 95 °C at a rate of 1 °C per min. Fluorescent intensity (excitation at 490 nm and emission at 600–630 nm using ROX filter) was measured and analysed using StepOne software (Invitrogen, Thermo Fisher Scientific, USA) and the first derivative approach was applied to calculate the Tm.
Intrinsic fluorescence spectroscopy (ITF)
ITF was performed with 1 cm path length and at a temperature of 25 °C on a steady-state PTI QuantMaster 300 spectrophotometer (HORIBA, PTI, USA). The sample was excited with a wavelength of 280 nm, and emission spectra were recorded in a range of 300–400 nm. The excitation and emission slits were 5 nm and 10 nm, respectively. PBS (pH 7.4) was taken as blank and the emission spectra for each sample (2 µg/ml) were measured in triplicate.
Size exclusion high pressure liquid chromatography (SE-HPLC)
SE-HPLC was carried out using TSK Gel G2000 column (Tosoh, Japan) attached to UPLC (Shimadzu Corporation, Japan) equipped with a UV-Vis detector (SPD-20A), oven (CTO-10AS at 25 °C) and pump (flow at 1 ml/min), was carried out to characterise the aggregates present in the samples. 20 µl of mAb sample of 1.0 mg/ml concentration was loaded onto the column, and isocratic elution was done using phosphate buffer (pH 7.2; 100 mM) with 50 mM NaCl. LC solution program (Shimadzu Corporation, Japan) was used to integrate the peak and calculate the percentage of the aggregates.
Analytical ultra-centrifugation (AUC)
Sedimentation velocity analytical ultra-centrifugation (SV-AUC) was performed (Beckman coulter XL-I AUC, USA) using a rotor speed of 40000 rpm for 100 scans with 3 min interval time between scans and the runs started once the temperature reached 20 °C after switching on the vacuum. PBS (pH 7.4) and sample at a concentration of 0.5–0.8 mg/ml were used in the reference cell and sample cell of AUC cuvette, respectively and the AUC data were analysed using SEDFIT software.
Small angle X-ray scattering (SAXS) data acquisition, processing and analysis
All SAXS experiments were acquired on SAXSpace instrument (Anton Paar GmbH, Austria). Line collimation arising from a sealed X-ray tube was incident on the samples and buffer contained in a thermostated quartz capillary. The scattering data was recorded on a 1 D CMOS Mythen detector (Dectris, Switzerland). The intensity profiles were collected for both antibodies from 10 °C to 70 °C, and backwards at interval of 10 °C in same capillary for one hour. Supplementary Table ST3 summarises all the programs used to process the acquired data. Post-data collection, the beam position or position of momentum transfer vector, q was set to 0 using SAXSTreat program. Buffer subtraction and desmearing of data to represent scattering from point source was done using SAXSQuant program. Kratky analysis and Porod Exponent analysis were performed manually using plotting software. Using the SAXS data profile and shape parameters, ten uniform density models were calculated, aligned, averaged and re-optimized to obtain envelope maps which aid in perceiving the predominant solution shape of mAbs and their variation as a function of temperature.
Biological characterisation
Cell proliferation inhibition
MTT (3-[4,5-dimethylthiazole-2-yl]-2,5-diphenyltetrazolium bromide) assay [Citation23] was used for the analysis of cell proliferation inhibition. 100 µl of A431 and HT29 diluted cell suspension (1 × 10⁵ cells/ml in RPMI-1640 medium with 10% FBS and 2 mM glutamine) was taken in each well of 96 well plates and incubated overnight in a humidified carbon dioxide incubator at 37 °C and 5% CO2. The next day, a varying concentration from 266 µg/ml to 0.13 µg/ml (dilution factor of 2) of P-mAb and RMP were prepared with Tris-HCL buffer (pH 7.4; 20 mM) having 100 mM NaCl. 50 µl of diluted mAbs samples were added to each well in triplicate along with buffer as control. Following incubation of the plates at 37 °C and 5% CO2 for 48 h, the medium was discarded, and 15 µl of MTT solution (5 mg/ml dissolved in PBS) and 85 µl of the medium was added to each well and the plates were incubated at 37 °C. After 4 h incubation, MTT dissolution solution was added to each well and the optical density was measured at 570 nm in an ELISA plate reader (Infinity M200Pro, Tecan, Switzerland). The percentage of cell inhibition was calculated using the following equation.
Microscale thermophoresis (MST)
Purified P-mAb and RMP were labelled with the Monolith NT Protein Labelling kit RED-NHS (MO-L001) (NanoTemper Technologies, Munich, Germany) as per the manufacturer’s instructions. 100 nM of labelled protein was added to 16 serially diluted (dilution factor 2) EGFR solutions (PeproTech, USA) (250 nM to 7.62 pM). PBST (pH 7.4; PBS; 0.05% Tween-20) was used as dilution buffer. The samples were taken in capillaries and data measurement was carried out in Monolith NT.115 (NanoTemper Technologies, Germany) using settings MST power medium, excitation power 20%, and excitation type Nano-RED. Data analysis was carried out using MO Affinity Analysis v2.3 (NanoTemper Technologies, Germany).
Results
Batch production and purification of anti-EGFR P-mAb
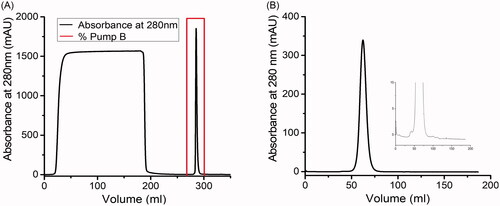
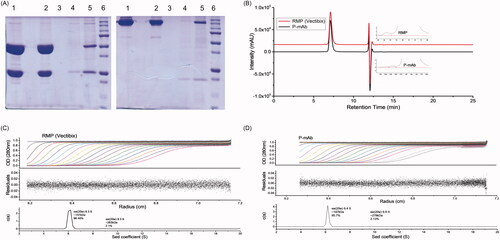
Analysis of samples withdrawn from flasks cultivating CHO-S cells (expressing P-mAb) at one day interval showed a maximum P-mAb concentration of around 170 mg/L on day 6 and at that stage, glucose and fermented lactic acid were found to be exhausted/consumed by the cells and as a result, the cells were found to be dead on the following day (). A two-step chromatographic purification of P-mAb, using Protein A affinity chromatography followed by SEC chromatography, were carried out and the profiles of chromatographic purification are shown in .
Figure 1. Volumetric production of P-mAb using a stable CHO-S clone (expressing anti-EGFR P-mAb) in batch culture.
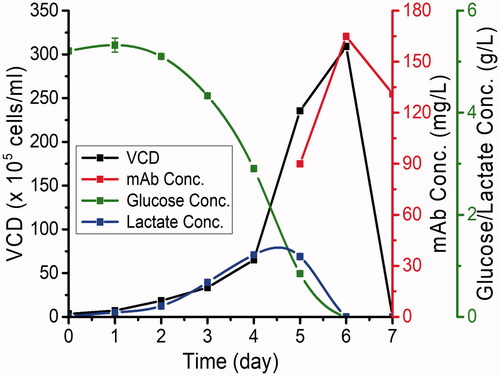
Figure 2. Profile of purification of P-mAb from the cell free broth: (A) Protein A affinity chromatography, (B) Size exclusion chromatography of the elute from Protein A chromatography using Sephacryl S300 column showing the monomer peak with negligible amount of HMW or LMW impurities (inset: zoom in at the peak base).
Characterisation of purified mAb
Regulatory agencies are increasingly recommending the use of state-of-the-art and orthogonal methodologies for the demonstration of structural similarity between a biosimilar and its RMP. In this study, a wide range of state-of-the-art analytical techniques including SAXS and MST were used to compare the physicochemical properties and biological activities of proposed biosimilar panitumumab (P-mAb) produced using CHO cell line and RMP (Vectibix).
Identity and primary structure
The LC-MS analysis results, presented in , showed P-mAb (147109.17) and RMP (147107.19) to be highly similar in their molecular mass. The theoretical average masses of different fragments or different glycosylation variants based on the sequence of expressed protein matches with the reference protein. As shown in the intact mass of predominant species in P-mAb and RMP sample matched with that of theoretical mass. Upon deconvolution, the resulted mass corresponded to the most abundant glycoforms (G0F/G1F), (G1F/G1F or G0F/G2F), (G0F/G0F) and (G1F/G2F), respectively. The highest glycoform peak (G0F/G1F) was also confirmed by the BioConfirm software analysis (mass error <2 kDa). The reduced and deglycosylated samples resulted in clear deconvoluted peaks corresponding to LC and HC (). The masses of LC and HC matched with that of the theoretical masses (mass error <0.5 kDa for LC and <5 kDa for HC) (). For peptide mapping and confirmation of similarity of primary sequence, trypsin digestion of mAbs was performed as it generates a moderate number of fragments by cleaving the peptide chain at the C-terminal side of lysine and arginine amino acid residues. The spectra generated by MALDI analysis of trypsin hydrolysates showed a similar mirror image of purified P-mAb to that of RMP (). Minor differences in peak intensity could be due to the lower or higher number of fragments generated for those peaks.
Figure 3. Comparative analysis of molecular mass, and peptide mass fingerprinting of purified P-mAb and RMP: (A) LC-MS spectrum showing the intact mass of both the RMP (upper) and P-mAb (lower), (B) Reduced and deglycosylated mAb analysis showing LC mass, (C) Reduced and deglycosylated mAb analysis showing HC mass, (D) Mirror plot of peptide mass of fragments obtained from MALDI MS/MS analysis of trypsin digested samples of P-mAb and RMP.
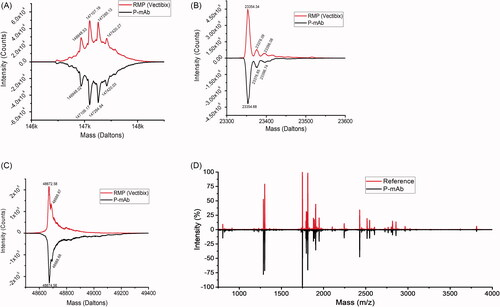
Table 2. LC/MS analysis of RMP and P-mAb with the theoretical and observed mass.
Higher order structure
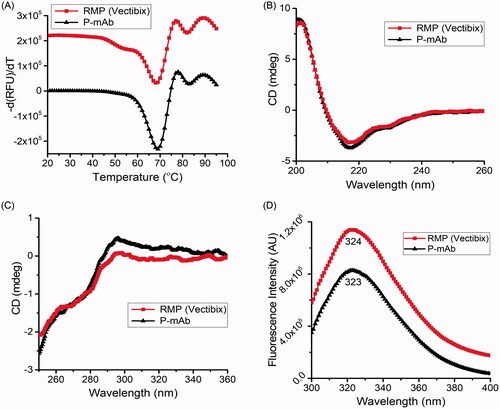
As protein functionality is determined by three-dimensional motifs, the higher order structure (HOS) of biosimilar drug candidate, in comparison with RMP, should be thoroughly evaluated using orthogonal methods to reveal potential differences [Citation24]. DSF analysis used to examine the temperature stability and compactness showed a similar transition temperature (Tm) for both purified P-mAb and RMP (). Tm1 for purified P-mAb and RMP was found to be 69 °C and 68 °C, while Tm2 for purified P-mAb and RMP was 83 °C and 82 °C, respectively. The two-transition temperature corresponded to thermal denaturation of constant CH2 and antigenic binding (Fab) domain [Citation25]. Far-UV and Near-UV CD spectra give insight into the secondary and tertiary structure of proteins. In the present case, no difference in the CD spectra of purified P-mAb and RMP was observed, suggesting the similarity in the secondary (α-helix, β-sheets, turns, and random coil) and tertiary structures of both molecules (). ITF is based on the detection of the fluorescence of tryptophan residues in the protein that are sensible to differences in the packing of the hydrophobic core and hence the emission wavelength of tryptophan fluorescence reflects the tertiary structure of the protein. The intrinsic fluorescence spectra of both purified P-mAb and RMP showed a similar pattern with λmax value of 324 nm and 323 nm for RMP and P-mAb, respectively () i.e. within universal acceptance criteria of ±2 nm maximum wavelength emission deviation [Citation26]. This supported CD results and confirmed the similarity in the tertiary structure between the proposed P-mAb and RMP. ITF was also reported as a sensitive method for the study of secondary and tertiary structures of antibodies in a previous study [Citation27].
Figure 4. Comparative analysis of higher-order structure of P-mAb and RMP: (A) DSF analysis for Tm determination (derivatized fluorescence data), (B) Far-UV CD spectra, (C) Near-UV CD spectra, and (D) Intrinsic fluorescence spectra of RMP (red) and P-mAb (black).
SAXS profiles from samples of P-mAb and its RMP at concentrations of 1 and 1.6 mg/ml in same matched PBS buffer (pH 7.4) are shown in . Intensity profiles from 283 to 323 K (or 10–50 °C) are presented in double Log mode which clearly supported that there was no aggregation in protein samples or inter-particulate effect in this buffer at this temperature range. It is important to highlight here that the calculated χ2 value between normalised I(q) profile from P-mAb and RMP at 283 K in the range of 0.12 to 3 nm−1 was found to be 0.97 supporting high degree of similarity in the interatomic vectors of these two mAb molecules in solution. Guinier plots presuming globular shape profile are shown as insets in . The Rg values thus computed are plotted in . In correlation with Guinier analysis, the Rg values increased in Sigmoidal two-state manner from 283 to 323 K and then increased rapidly supporting aggregation after this temperature. As seen in comparison of χ2 values, the estimated Rg values also displayed similarity in values and increment trend (). The Rg values changed from 5.2 to 6.7 nm from 283 to 323 K before aggregating and reflecting larger values.
Figure 5. Structural analysis using SAXS: (A) The SAXS I(q) profiles of (Left) P-mAb and (Right) RMP samples at different temperatures and the inset with the Guinier plots of these datasets, (B) The P(r) profiles computed using SAXS intensity data for (Left) P-mAb and (Right) RMP Sample with the inset Kratky plot of the datasets, (C) Variation in the (Left) Rg and (Right) Porod exponent as a function of temperature for P-mAb and RMP samples.
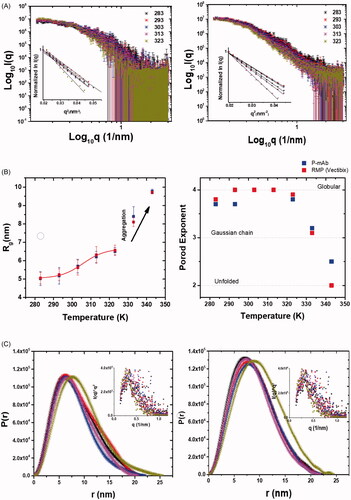
Porod exponent, x was calculated for each dataset which is a quantitative assessment of globular nature of the protein molecules in solution [Citation28,Citation29]. This estimation for P-mAb and RMP showed that protein molecules were largely folded from 283 to 323 K and then at higher temperatures they unfold ( right panel). This clarifies the above data that the observed increase in the dimensions of molecules at 333 and 343 K are primarily due to unfolding. Considering uniform scattering density of the mAb molecules, distance distribution of pair-wise vectors inside their molecular volume, P(r) were estimated keeping the experimental SAXS data as reference (). Globular scattering profile was considered for this estimation based on peak-like profile of their Kratky plots from the SAXS datasets ( insets) and correlation with Porod exponent values. The P(r) curves for both mAbs are shown from 283 to 323 K and they show similar vector distribution profiles supporting similarity in their shapes and internal features in solution over the temperature range. Data analysis suggested that the Dmax of molecules change from 20 to 25 nm with heating and the trend is comparable amongst both mAbs.
Considering the SAXS datasets and shape parameters, scattering shapes of mAbs at two conformationally monodisperse conditions i.e. 283 and 323 K were computed without any shape or symmetry bias (Supplementary Figure SF1). The normalised spatial disposition (NSD) values at 283 K were higher close to 0.9 and lower about 0.7 at 323 K suggesting increased polydispersity amongst confirmations with increase in temperature. Both mAbs depicted a compact T-shape profile at 283 K which opened up as Y-shape at 323 K. Taking the sequence of PmAb, some structural templates were searched. PDB 1MCO appeared as a best hit for closed shape which is crystal structure of IgG1 with a hinge deletion. Using symmetry mate of crystal packing, a structural template for two-chained IgG1 PmAb was generated and compared with the SAXS based envelope (Supplementary Figure SF1). A χ2 of ∼1.2 between the theoretical SAXS profile of the calculated residue model and SAXS based model indicated good correlation between the two models for both mAbs. For the open shape, the extended chain of antibody IgG1 b12 from PDB 1HZH was used and its two-chain form was created by cutting the linker the central Fc and one Fab was superimposed inside the SAXS based envelops calculated at 323 K. The computed χ2 value between theoretical SAXS profile of the positioning inside envelope vs. the SAXS data-based model was about 1.5. In past, such values indicated close agreement between crystal structures and SAXS data based model [Citation30].
Analysis of size and aggregates
Prevention of protein aggregation during the processing of protein-based drugs is of crucial interest. The purity and size variants of P-mAb and RMP were analysed using SDS-PAGE, SEC-HPLC, and SV-AUC. The molecular size of RMP and purified P-mAb, compared using SDS-PAGE analysis under reducing and non-reducing conditions, showed the protein bands of both molecules to be matching and no other low or high molecular weight protein bands were observed (). Analysis of purity of the purified P-mAb using SEC-HPLC found the retention time of the main peak of purified P-mAb and RMP samples to be identical (7.20 min) absence of any low molecular weight (LMW) entity though high molecular weight (HMW) aggregates were present in both the samples, % of HMW aggregates in case of RMP (0.85%) being higher in comparison to that of purified P-mAb (0.64%) (). SV-AUC, used as an orthogonal method to SEC-HPLC to further examine the presence of aggregates in the samples, also confirmed the presence of HMW aggregate in both the samples and showed the size distribution of P-mAb and RMP to be similar (). In conclusion, the aggregation propensity of both P-mAb and RMP was proven to be similar.
Figure 6. Comparative analysis of size and aggregates of P-mAb and RMP: (A) SDS-PAGE analysis in reducing (left) and non-reducing (right) conditions (Lane 1: RMP; 2: concentrated sample of purified P-mAb; 3: P-mAb pass through; 4: P-mAb pass through of protein A chromatography; 5: cell free broth; 6: protein marker), (B) SEC-HPLC chromatography of purified P-mAb (inset showed a zoom in view at the bottom of the peaks) showing HMW aggregates, (C) Sedimentation velocity (SV) of RMP using analytical ultracentrifugation (AUC), (D) Sedimentation velocity (SV) of purified P-mAb using AUC. Antibodies were dissolved in PBS and subjected to SV AUC at 40,000 RPM at 20 °C and A280 nm scans were taken at 3 min intervals and fitted to a continuous c(s) distribution from 0 S to 20 S. Only 20 alternate scans are shown for clarity. Upper panel shows A280, middle panel shows the residuals of the fitted data, and lower panel shows c(s) distributions. (Absorbance, residuals and c(s) distribution plot).
Biological activity and binding affinity
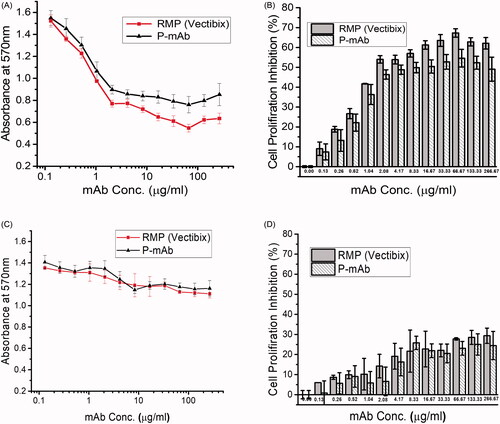
Both purified P-mAb and RMP were observed to inhibit the proliferation of the A431 cell line when compared to the control (without mAb). In both cases, proliferation inhibition increased initially with increasing concentration of the antibody, however, with further increase in antibody concentration, it did not improve inhibition of cell proliferation (). The inhibition trend showed by the purified P-mAb and RMP were highly similar and both antibodies inhibited cell proliferation by nearly 50% at 2.08 µg/ml concentration (Supplementary Table ST4). An EC50 value of 2.112 µg/ml for panitumumab had also been reported by another study [Citation31]. In case of HT29 cell line, though the inhibition of cell proliferation by panitumumab was not significant (), the results of inhibition of HT29 cell proliferation by panitumumab (P-mAb and RMP) was in agreement with the other studies carried out with HT29 cell line as panitumumab was known to inhibit the growth of cell lines expressing extremely high EGFR levels [Citation32,Citation33].
Figure 7. Cell proliferation inhibition assay with A431 (upper panel) and HT29 (lower panel) cell line: (A,C) Absorbance at 570 nm for RMP (red) and P-mAb (black), (B,D) Percentage of cell proliferation inhibition by RMP and P-mAb (buffer taken as negative control).
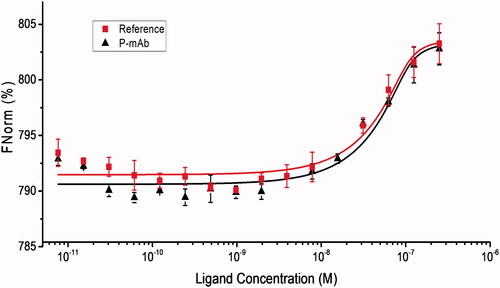
The dissociation constant (Kd) was measured by analysing the MST experiment data that provided information on the binding affinity of the antibody to the ligand molecule. The data analysis showed Kd values of 5.61 × 10−09 ± 1.17 M and 5.29 × 10−09 ± 1.01 M for P-mAb and RMP respectively. The binding and fitting curves were shown in . MST traces of both the antibodies were overlapping indicating the similarity in their binding affinities towards the EGFR (Supplementary Figure SF2).
Figure 8. Comparative analysis of binding of RMP (red) and P-mAb (black) to EGFR in micro scale thermophoresis. Legends represent the experimental values and the line represents the fitting curve obtained from data analysis using MO Affinity Analysis software (NanoTemper Technologies, Germany).
Discussion
Biologics such as mAbs are highly complex in terms of molecular structure and its structural elements are critical for function of this drug. In the recent years, though the changes in regulation led to the development of pathways for approval of biosimilars (including mAbs) consequently resulting in increased manufacturing and market approval, it has also expended the requirements of non-clinical characterisation data, both physicochemical and biological, showing the similarity of the proposed protein drug with the originator/RMP. The mechanism of action of panitumumab has previously been described in different studies [Citation17,Citation34]. Binding of EGF or TGF-α to EGFR triggers a cascade of cellular biochemical events including EGFR autophosphorylation and internalisation, which culminates in cell proliferation. Blocking the interaction of ligand to EGFR could result in the arrest of tumour growth [Citation35]. As per the reports on originator molecules panitumumab binds selectively to the EGFR and prevents binding of activating agents (EGF and TGF-α). Panitumumab was found to be more active in cells expressing ≥15,000 EGFR per cell [Citation36].
The motivation behind this study was to compare the physicochemical properties and biological activities of purified anti-EGFR P-mAb, produced by a stable CHO-S cell line, with that of its RMP, Vertibix using state-of-the-art and orthogonal methodologies including SAXS based structural analysis and high throughput MST technique for the binding analysis to demonstrate biosimilarity. The function of a therapeutic monoclonal antibody highly depends on its physicochemical properties including primary and higher-order structures and biological characteristics such as binding affinity and cell proliferation inhibition. In this study, the similarity assessment included extensive comparative analysis of identity, primary, secondary and tertiary structure, size, aggregation and functional analysis. The primary structure and higher order structure of P-mAb and RMP were thoroughly compared using orthogonal methods. Identical primary structure between P-mAb and RMP was demonstrated by peptide mapping and intact mass analysis. Reduced and deglycosylated mass analysis confirmed the different mass variants of intact mAb were a result of different glycoforms as LC and HC masses matched with that of the theoretical masses. As protein functionality is determined by three-dimensional motifs, the assessment of higher order structure is an essential part of similarity assessment. A detailed SAXs analysis showed no aggregation in protein samples or inter-particulate effect in the buffer used in the temperature range of 283–323 K (10–50 °C) and high degree of similarity in interatomic vectors of these two mAb molecules in solution. The χ2 value of 0.93 between I(q) profiles of these two mAbs at 323 K supported the shapes of the molecules remained comparable at increased temperature. Furthermore, the results of SAXS analysis showed both the mAbs adopting very similar closed and open shapes at low and higher temperature, respectively. DSF results demonstrated P-mAb and RMP have similar thermal unfolding patterns and these combined with CD, ITF and SAXS results of both antibodies confirmed secondary and tertiary structure similarity between the proposed P-mAb and RMP. Aggregation is a significant concern for biopharmaceuticals as it could decrease bioactivity and increase immunogenicity of the molecule [Citation37]. SDS-PAGE under reducing and non-reducing conditions and SEC-HPLC were used to compare the purity and monomer/aggregate content of the proposed P-mAb and RMP. Besides these methods, SV-AUC where samples were not exposed to extraneous conditions such as solid or mobile phases, was used as an orthogonal method for analysis of monomer/aggregate content. The results indicated the absence of low molecular weight (LMW) entity and the presence of very low amount of high molecular weight (HMW) aggregates in both RMP and proposed P-mAb, the percentage of HMW aggregates being less in proposed P-mAb compared to RMP. Under the circumstances, the presence of HMW aggregates in P-mAb are highly unlikely to have clinical safety issues in comparison with RMP [Citation37]. Finally, highly similar biological activities were observed between proposed P-mAb and RMP as demonstrated by inhibition of cell proliferation and affinity binding. To the best of our knowledge SAXS was used here for the first time in biosimilarity analysis of monoclonal antibody to compare the higher order structural similarity between a proposed mAb biosimilar and its RPM. Also, in this study, MST has been used to demonstrate the affinity between mAb and its ligand as it has the advantage of using vary low sample amount compared to other techniques [Citation38]. In summary, the results of comparative structural and functional analysis of proposed panitumumab biosimilar (P-mAb) using stable CHO-S cell line and its RMP, Vectibix revealed high similarity between P-mAb and RMP providing scientific basis for its potential for therapeutic applications and conducting preclinical and clinical evaluation of this biologic at commercial scale.
Conclusion
Each new biosimilar approval requires a set of analytical techniques and experiments for comparative analysis of the structural and functional properties of the proposed biosimilar with its RMP. In this study, the purified anti-EGFR P-mAb produced using a stable CHO-S clone was assessed for its biosimilar potential using various state-of-the-art and orthogonal methodologies. The results of comprehensive structural and biological analysis of purified P-mAb and its RMP demonstrated the high similarity of the proposed Panitumumab biosimilar to that of Vectibix, providing scientific basis for its potential for therapeutic applications and conducting preclinical and clinical evaluation of this biologic at commercial scale.
Author contributions
D.K.S. conceived and designed the experiments and is a guarantor for the overall content. J.N., K.N.M, and H.V. carried out the experiments. N.K. and Ashish performed the SAXS experiments. J.N, R.P.N.M., Ashish and D.K.S. analysed the data and wrote the manuscript.
Supplemental Material
Download MS Word (2 MB)Acknowledgements
The authors are thankful to the Department of Biotechnology (DBT), Council of Scientific and Industrial (CSIR), and University Grant Commission (UGC), Government of India, for financial support.
Disclosure statement
The authors do not have any conflict of interest related to this work.
Data availability statement
It is confirmed that “All data is included in the submission/manuscript”.
References
- DBT. Guidelines on similar biologics: regulatory requirements for marketing authorization in India. 2016. [cited 2019 May 26]:[p. 1–54] https://www.birac.nic.in/webcontent/Guidelines_on_Similar_Biologics_06_10_2017.pdf.
- Seo N, Polozova A, Zhang M, et al. Analytical and functional similarity of amgen biosimilar ABP 215 to bevacizumab. MAbs. 2018;10(4):678–691.
- CDER/CBER, FDA. Quality considerations in demonstrating biosimilarity of a therapeutic protein product to a reference product. Guid Ind. 2015. [cited 2021 Jan 26]. https://www.fda.gov/media/135612/download.
- European Medicines Agency. Guideline on similar biological medicinal products containing monoclonal antibodies – non-clinical and clinical issues. 2014;44:1–16. http://www.ema.europa.eu/docs/en_GB/document_library/Scientific_guideline/2015/01/WC500180219.pdf
- Kaplon H, Reichert JM. mAbs antibodies to watch in 2019. MAbs. 2019;11(2):219–238.
- Zhu J. Mammalian cell protein expression for biopharmaceutical production. Biotechnol Adv. 2012;30(5):1158–1170.
- FDA. Biosimilar product information. [cited 2021 Jun 13]. https://www.fda.gov/drugs/biosimilars/biosimilar-product-information.
- Harston A. How the U.S. compares to Europe on biosimilar approvals and products in the pipeline. 2019. [cited 2020 Apr 10]. https://www.biosimilarsip.com/2019/05/07/how-the-u-s-compares-to-europe-on-biosimilar-approvals-and-products-in-the-pipeline-4/.
- Kim JY, Kim YG, Lee GM. CHO cells in biotechnology for production of recombinant proteins: current state and further potential. Appl Microbiol Biotechnol. 2012;93(3):917–930.
- Jayapal K, Wlaschin K, Hu W, et al. Recombinant protein therapeutics from CHO cells-20 years and counting. Chem. Eng. Prog. 2007;103:40–47.
- Elvin JG, Couston RG, Van Der Walle CF. Therapeutic antibodies: market considerations, disease targets and bioprocessing. Int J Pharm. 2013;440(1):83–98.
- Fischer S, Handrick R, Otte K. The art of CHO cell engineering: a comprehensive retrospect and future perspectives. Biotechnol Adv. 2015;33(8):1878–1896.
- De Jesus M, Wurm FM. Manufacturing recombinant proteins in kg-ton quantities using animal cells in bioreactors. Eur J Pharm Biopharm. 2011;78(2):184–188.
- Siegel RL, Miller KD, Goding Sauer A, et al. Colorectal cancer statistics, 2020. CA A Cancer J Clin. 2020;70(3):145–164.
- Krasinskas AM. EGFR signaling in colorectal carcinoma. Patholog. Res. Int. 2011;2011:1–6.
- Tol J, Punt CJA. Monoclonal antibodies in the treatment of metastatic colorectal cancer: a review. Clin Ther. 2010;32(3):437–453.
- Yang XD, Jia XC, Corvalan JR, et al. Development of ABX-EGF, a fully human anti-EGF receptor monoclonal antibody, for cancer therapy. Crit Rev Oncol Hematol. 2001;38(1):17–23.
- Jonker DJ, O'Callaghan CJ, Karapetis CS, et al. Cetuximab for the treatment of colorectal cancer. N Engl J Med. 2007;357(20):2040–2048.
- Giusti RM, Shastri KA, Cohen MH, et al. FDA drug approval summary: panitumumab (Vectibix). Oncologist. 2007;12(5):577–583.
- Peeters M, Balfour J, Arnold D. Review article: panitumumab–a fully human anti-EGFR monoclonal antibody for treatment of metastatic colorectal cancer. Aliment Pharmacol Ther. 2008;28(3):269–281.
- Trotta F, Leufkens HGM, Schellens JHM, et al. Evaluation of oncology drugs at the European Medicines Agency and US Food and Drug Administration: when differences have an impact on clinical practice. J Clin Oncol. 2011;29(16):2266–2272.
- Laemmli UK. Cleavage of structural proteins during the assembly of the head of bacteriophage T4. Nature. 1970;227(5259):680–685.
- Mosmann T. Rapid colorimetric assay for cellular growth and survival: application to proliferation and cytotoxicity assays. J Immunol Methods. 1983;65(1-2):55–63.
- Kang J, Kim SY, Vallejo D, et al. Multifaceted assessment of rituximab biosimilarity: the impact of glycan microheterogeneity on Fc function. Eur J Pharm Biopharm. 2020;146:111–124.
- Ito T, Tsumoto K. Effects of subclass change on the structural stability of chimeric, humanized, and human antibodies under thermal stress. Protein Sci. 2013;22:1542–1551.
- Wen J, Batabyal D, Knutson N, et al. A comparison between emerging and current biophysical methods for the assessment of higher-order structure of biopharmaceuticals. J Pharm Sci. 2020;109(1):247–253.
- Garidel P, Hegyi M, Bassarab S, et al. A rapid, sensitive and economical assessment of monoclonal antibody conformational stability by intrinsic tryptophan fluorescence spectroscopy. Biotechnol J. 2008;3(9-10):1201–1211.
- Dolma K, Nagar J, Sahoo DK, Ashish Tracking urea induced unfolding-refolding of six-domain protein gelsolin by SAXS data analysis. Pharma Innov. J. 2018;7:5–11.
- Sagar A, Haleem N, Bashir YM, Ashish. Search for non-lactam inhibitors of mtb β-lactamase led to its open shape in apo state: new concept for antibiotic design. Sci Rep. 2017;7:6204.
- Ashish IJ, Juncadella R, Garg CD, Boone, et al. Conformational rearrangement within the soluble domains of the CD4 receptor is ligand-specific. J. Biol. Chem. 2008;283:2761–2772.
- Yang Y, Guo Q, Xia M, et al. Generation and characterization of a target-selectively activated antibody against epidermal growth factor receptor with enhanced anti-tumor potency. MAbs. 2015;7(2):440–450.
- Nicolantonio FD, Martini M, Molinari F, et al. Wild-type BRAF is required for response to panitumumab or cetuximab in metastatic colorectal cancer. J Clin Oncol. 2008;26(35):5705–5712.
- Tsai MH, Pan CH, Peng CL, et al. Panitumumab-conjugated Pt-drug nanomedicine for enhanced efficacy of combination targeted chemotherapy against colorectal cancer. Adv Healthcare Mater. 2017;6(13):1700111.
- Foon KA, Yang XD, Weiner LM, et al. Preclinical and clinical evaluations of ABX-EGF, a fully human anti-epidermal growth factor receptor antibody. Int J Radiat Oncol Biol Phys. 2004;58(3):984–990.
- Yang XD, Jia XC, Corvalan JRF, et al. Eradication of established tumors by a fully human monoclonal antibody to the epidermal growth factor receptor without concomitant chemotherapy. Cancer Res. 1999;59:1236–1243.
- Messersmith WA, Hidalgo M. Panitumumab, a monoclonal anti epidermal growth factor receptor antibody in colorectal cancer: another one or the one? Clin Cancer Res. 2007;13(16):4664–4666.
- Lee KH, Lee J, Bae JS, et al. Analytical similarity assessment of rituximab biosimilar CT-P10 to reference medicinal product. MAbs. 2018;10(3):380–396.
- Wienken CJ, Baaske P, Rothbauer U, et al. Protein-binding assays in biological liquids using microscale thermophoresis. Nat. Commun. 2010;1:1–7.