
Abstract
Endometrial cancer is one of the most common malignant tumours in women, and cancer stem cells are known to play an important role in its growth, invasion, metastasis, and drug resistance. Immunotherapy for endometrial cancer is still under research. In this study, a total of 547 endometrial cancer cases were randomly divided into training set (351 cases) set and test set (196 cases). The stemness index of patients was calculated using the One-Class Logistic Regression (OCLR) machine learning algorithm to explore the clinicopathological differences between index levels. Stemness subtypes were determined according to the characteristics of cancer stemness and their clinicopathological characteristics, immune features, and therapeutic effects were described. Our study suggests that endometrial cancer is classified into two stemness subtypes. Stemness subtypes, which are associated with its clinical features, may be independent prognostic factors for endometrial cancer. The stemness subtypes differed significantly in immune activity, immune cell infiltration, and the immune microenvironment, including sensitivity to chemotherapeutic drugs and potential therapeutic compounds. Algorithms were utilised to construct a stemness subtype prediction model and predictor. These findings will provide guidance for the clinical diagnosis, treatment, and prognosis of endometrial cancer.
Introduction
Endometrial cancer is one of the most common malignant tumour types that occurs in women [Citation1]. In 2018, 382 069 new cases of endometrial cancer were reported, with 89 929 deaths worldwide [Citation2,Citation3]. Conventional treatment options for endometrial cancer include surgery, radiation, chemotherapy, and hormone therapy [Citation4]. Stemness refers to the self-renewal and differentiation potential of cells and was first used in reference to normal adult stem cells [Citation5].
Cancer stem cells (CSCs) are the cells in tumour tissues that have stem-like characteristics, such as the ability for self-renewal and pluripotency, to mutate and develop into unique cell populations, to differentiate into different malignant cells with different phenotypes, and to acquire a variety of biological and phenotypic characteristics [Citation6–10]. CSCs are generally believed to originate from normal stem cells, progenitor cells, or differentiated cells via mutation. Their basic characteristics include a self-renewal ability, pluripotency, high tumour-initiation ability of a few cells, and chemical resistance [Citation11]. These undifferentiated malignant cells are more likely to spread than normal tumour cells, leading to disease progression and poor prognosis [Citation12–14]. Studies have shown that cancer stem cell are associated with endometrial cancer. CSCs play an important role in the recurrence and metastasis of endometrial cancer and are closely related to the metastasis and therapeutic resistance of endometrial cancer [Citation15–18]. Endometrial cancer stem cells can initiate cloning, self-renewal, proliferation, and differentiation, resulting in the formation of tumours that can be continuously passed in vivo [Citation19]. Related studies have also confirmed that several genes, including SMOC-2, Bmi1, and DUSP6, play important roles in the stemness of endometrial cancer [Citation20–22]. The innate and adaptive immune responses may recognise cancer cells and potentially eradicate tumours [Citation23–26].
Cancer immunotherapy is one of the newest methods for cancer treatment. In contrast to conventional treatments such as surgery, radiation, and chemotherapy, immunotherapy manipulates and uses a patient’s own immune system to fight cancer cells. Immunotherapy has been used to treat a variety of tumours, but its application in endometrial cancer, however, is still in the development stage [Citation27,Citation28].
Based on its cancer stemness characteristics, we established endometrial cancer stemness subtypes, to provide guidance for the future clinical diagnosis, treatment, and prognosis of endometrial cancer.
Materials and methods
Endometrial cancer expression data
TCGA-uterine corpus endometrial carcinoma (UCEC) gene expression RNA-seq data were downloaded from UCSC Xena (https://xena.ucsc.edu/) in the log2 (FPKM +1) format. A total of 547 UCEC cases were identified and were randomly divided into training set (351 cases) and test set (196 cases) ().
Table 1. The information of TCGA-UCEC data.
Stemness index calculation
The mRNAs index (mRNAsi) describes the similarity of tumour cells to stem cells using expression data. The index ranges from 0 to 1, with values closer to 1 indicating a lower degree of cell differentiation and stronger stem cell characteristics. This study used cells from the express data collection at the Progenitor Cell Biology Consortium (PCBC, https://progenitorcells.org/) and collected data using the One-Class Logistic Regression (OCLR) machine learning method for cell data for training. The R (3.5.2) package gelnet was used to construct the cell stemness model. The mRNAsi was calculated for TCGA data based on the stemness model obtained previously.
Distribution and clinical features of the stemness index
The pheatmap and ggpubr R packages were used to identify differences in the stemness index using different clinical features, including cancer subtype (TCGA-subtype), mutation-count, immune subtype, clinical stage, and clinical grade.
The tumour mutation (TMB) and biomarker (TP53, PTEN, KRAS, CEACAM5, APC, FGFR2,and MUC16) mutations in the endometrial cancer samples were used to analyse the differences in the stemness index between the different groups, using the pheatmap and ggpubr packages in R (3.5.2).
ssGSEA calculations of the immune characteristics, immune subtype recognition, and stemness index difference among immune subtypes
The proportion of UCEC immune cells was determined using the ssGSEA method and the R package GSVA. Additionally, the ESTIMATE algorithm was used to obtain immune, stroma, ESTIMATE, and tumour purity scores for evaluating the tumour microenvironment. The pheatmap package in R was used to draw a heat map of the immune cells, and the clustering method was used to obtain two immune subtypes. The ggpubr package in R was used to draw a box map and analyse the mRNAsi differences between the high- and low-immunity groups. We also calculated the correlation between the stemness index and the immune, stromal, and tumour purity scores and evaluated the differences in the immune, stromal, and ESTIMATE scores among the immune subtypes.
Immune cell infiltration in the immune subtypes
The immune cell infiltration into tumours is closely related to clinical outcomes, and as it is likely to improve patient survival, it has become a popular drug target [Citation29–31].
CIBERSORT, an analysis tool in R (3.5.2), was used to transform the gene expression matrix into an immune cell matrix and estimate the relative proportions of the 22 infiltrating immune cells based on standardised gene expression data using a deconvolution algorithm. The correlation between the stemness index and immune cells was also calculated.
Stemness index groups and differentially expressed genes (DEGs)
The survival and survminer R packages were used to calculate the differences in overall survival (OS) between the high- and low-stemness index groups, and the optimal P value was used for grouping. The limma package was then used to identify the DEGs between the two groups. The default false discovery rate (FDR) was used to correct the P value; |log2FC|> 1 and P.adj <0.01 were considered significant. A clusterProfiler analysis was then performed for differential gene function enrichment, including Gene Ontology (GO) and Kyoto Encyclopaedia of Genes and Genomes (KEGG) enrichment analysis, and q < 0.05 indicated significant pathway enrichment. In addition, we analysed the differences in the clinical characteristics between the high- and low-mRNAsi groups. The GSVA enrichment package was used to analyse the molecular pathways, and MSigDB (https://www.gsea-msigdb.org/gsea/msigdb/collections.jsp) was downloaded to analyse the KEGG gene sets and express the gene set variation analysis (GSVA) enrichment analysis matrix using the UCEC training set. To evaluate the differences between the high- and low-mRNAsi enrichment levels in the molecular pathways, we utilised limma package analysis enrichment score differences between the two groups based on |log2FC| >0.5 and P.adj <0.05 indicating a significant difference between the groups.
DEG mutation and CNV
TCGA endometrial cancer mutation data were downloaded (https://portal.gdc.cancer.gov/), and the gene mutation data differences were extracted using the maftools package mutating data display and map waterfall. The 10 highest differences in gene mutation frequency were identified. The RCircos package was also used to identify the DEG copy number variations (CNVs).
Identification of stemness subtypes based on DEG clustering and survival analysis
The ConsensusClusterPlus R package can be used to generate quantitative evidence to help determine the number and members of possible clusters in the data set. This package was used in this investigation to cluster and identify the type of the differential genetic matrix, using the clustering algorithm PAM. The stemness subtype was obtained, a heat map was drawn based on the differential gene matrix, and the survival package was used to draw a survival curve.
Identification and validation of stemness subtypes based on DEG clustering and survival analysis
TCGA-UCEC samples were divided into training set (351 cases) and the test set (196 cases), according to the principle of 6:4 as the validation set. The endometrial cancer samples and their expression levels in the validation set were extracted from the test set. The ConsensusClusterPlus package in R was used to cluster and type the differential gene matrix. The clustering algorithm PAM was used to obtain the stemness subtypes in the validation set, and the survival package was used to draw the survival curve of the stemness subtypes.
Clinical features and the GSVA among the subtypes in the training set
Cases were grouped according to their stemness subtype, and the differences among the different clinical features, including immune group, TP53 mutation status, TCGA subtype, immune subtype, grade, stage, and mRNAsi, were analysed. GSVA KEGG enrichment analysis was then conducted using the limma package to identify the significant differences between the different subtype stemness molecular pathways, with | log2FC | >0.5 and P.adj <0.05 indicating a significant difference.
Univariate and multivariate independent prognostic analysis
The survival package was used for univariate and multifactorial independent prognostic analysis to assess whether the stemness subtype could be used as an independent prognostic factor. The variables included in the analysis were mRNAsi, immune subtype, stemness subtype, age, and body mass index (BMI).
TMB, mutation, and CNV among the subtypes, and biomarker mutation status
The ggpubr package was used to illustrate the differences in TMB between the different stemness subtypes. Then we grouped according to their stemness subtypes and used maftools to identify their gene mutations. TCGAbiolinks package was used to download the CNV data for endometrial cancer. The GenePattern (https://cloud.genepattern.org/gp/pages/index.jsf) tool in the Genomic Identification of Significant Targets in Cancer (GISTIC) software was used for analysis, and the results were visualised using the maftools package. We grouped the results by stemness subtype to show the different mutations in biomarkers (PTEN, TP53, KRAS, FGFR2, APC, MUC16, and CEACAM5).
Immune activity among stemness subtypes
The tracking tumour immunophenotype (TIP, http://biocc.hrbmu.edu.cn/TIP/index.jsp) can be analysed in seven anticancer immune steps of the immune cycle, which are as follows: release of cancer cell antigens (Step 1); cancer antigen presentation (Step 2); priming and activation (Step 3); trafficking of immune cells to tumours (Step 4); infiltration of immune cells into tumours (Step 5); recognition of cancer cells by T cells (Step 6); and killing of cancer cells (Step 7) [Citation32]. The higher the tumour immune dysfunction and exclusion (TIDE) prediction score, the higher the probability of immune avoidance, suggesting that patients are less likely to benefit from immune checkpoint inhibitors (ICIs). TIP can also predict the proportion of infiltrating immune cells. We analysed the immune activity and proportion of infiltrating immune cells among the stemness subtypes using TIP. The ESTIMATE algorithm was then used to obtain the immune and stromal scores for the different stemness subtypes, and the differences between the scores were presented using ggpubr. The Pearson Chi-square test was also used to analyse the distribution differences of the immune subtypes within the stemness subtypes.
Gene expression analysis of the immune checkpoints between subtypes
The expression of immune checkpoint molecules on immune cells inhibits the function of immune cells, and therefore, the body cannot produce an effective antitumor immune response, thus enabling immune escape by the tumour [Citation33,Citation34]. ICIs are a class of drug used to remove this inhibition and allow immune cells to reactivate and destroy cancer cells. In this study, a total of 65 immune checkpoint genes were extracted, and an expression matrix of the immune checkpoint genes was constructed according to the expression data of the collected immune checkpoint gene samples. The differences in immune checkpoint gene expression between the genotypes were then analysed using the ggpubr package in R.
Prediction of immunotherapy responses among cancer subtypes
To predict the immunotherapeutic response between cancer subtypes, we analysed a submap generated using the GenePattern software (https://cloud.genepattern.org/gp/pages/index.jsf). Curative effect predictions for immunotherapy between the different cancer subtypes were assessed, and an FDR <0.05 indicated that the anti-programmed cell death protein 1 (PD-1) and anti-CTLA4 treatments were effective.
Sensitivity analysis of chemotherapy among the stemness subtypes
The pRRophetic package was used to predict the chemotherapy responses of different stemness subtypes to cisplatin and doxorubicin, and drug sensitivity was determined using the IC50 of each sample. The lower the IC50, the higher the drug sensitivity.
CMap analysis identifies the subtypes of potential compounds
The CMap database (https://clue.io/) is used to explore the potential compounds associated with different stemness subtypes that enables prediction of drugs based on gene expression characteristics as well as identification of the modes of action (MoA) of compounds. We used the limma package to analyse the differences between stemness subtype genes, where | logFC | >1.5 and P.adj <0.01 indicated a significant difference. The first 150 genes with positive and negative differential multiples were selected, and a total of 300 differential genes were queried in the CMap database. Compounds with negative enrichment scores and p < 0.05 were identified as potential drugs for the stemness subtype.
Machine learning approaches to build and validate a stemness subtype predictor
We selected the expression levels of the DEGs as the input variable and the stemness subtype as the result. Four machine learning methods were used to identify the important genes related to stemness type, namely absolute shrinkage and selection operator (LASSO), support vector machine (SVM), random forest and Boruta (Boruta), and extreme gradient boosting (XGBoost). We used R packages such as glmnet, Boruta, Caret, and XGBoost to calculate the importance of genes and each variable to identify the characteristic genes. The predictive performance of the four machine learning algorithms was evaluated using receiver operating characteristic (ROC) curve analysis to identify the area under the ROC curve (AUC). The common genes identified using LASSO, SVM, RFB, and XGBoost were then considered to be important genes associated with stemness subtypes and were visualised using VENN diagrams.
Model validation
The stemness subtype predictor is derived from multivariate logistic regression analysis of the key genes used to build the prediction model. We used stemness subtype predictor to predict the stemness subtype in the test set and verified the stemness performance. The subtype prediction model was assessed using ROC curve analysis. We then performed a group analysis on the stemness subtype results that were predicted by the validation set. First, we analysed the differences in the survival curves of different stemness subtypes. We also analysed the differences in various clinical characteristics of stemness subtypes, including the TP53 mutation status, mRNAsi, TCGA subtype, immune subtype, grade, stage, and stemness subtype. We used CIBERSORT to ESTIMATE the relative proportions of the 22 infiltrating immune cells under different stemness subtypes and obtained immune, stroma, and tumour purity scores using the ESTIMATE algorithm for different stemness subtypes. Furthermore, we analysed the differences in immune checkpoint expression among the different stemness subtypes. Finally, we analysed the sensitivity of the stemness subtypes among the different histological samples in the validation set.
Statistical analysis
All data processing and analysis were completed in R (3.5.2). The Wilcoxon rank-sum test was used to compare the differences between the two groups, and the Kruskal–Wallis test was used to compare multiple groups. The post hoc Benjamini–Hochberg test was used. The Pearson correlation test (a parametric test) was used to assess correlations between normally distributed variables, and the Spearman correlation test (a non-parametric test) was used to assess the correlation between non-normally distributed variables. A chi-square test was used for association analysis of the categorical variables. p < 0.05 was considered to indicate statistical significance.
Results
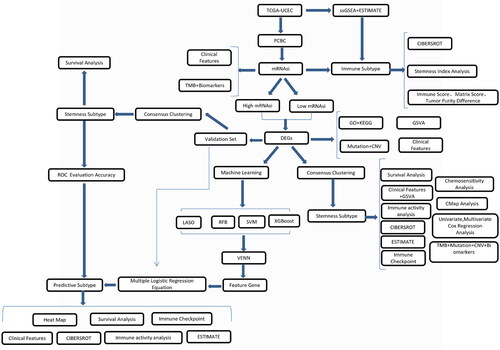
presents a flow chart of the study: 547 TCGA-UCEC samples were randomly divided into the training set (351 cases) and the test set (196 cases). In the training set, TCGA-UCEC samples were divided into ‘High’ and ‘Low’ mRNAsi groups. Two subtypes, Stemness Subtype I and Stemness Subtype II, were obtained via analysis of the training set. The two stemness subtypes were then tested in the validation set.
Figure 1. The flow chart.
Sample stemness index calculation
The PCBC data were analysed, and training set data were obtained. These data were used to predict the UCEC expression matrix and obtain mRNAsi scores for the samples (Supplementary Table 1).
Distribution and clinical features of the stemness index
We evaluated the relationship between the sample stemness index and clinical characteristics. The mRNAsi of the different subtypes and immune subtypes varied greatly (). The higher the stage was, the higher the mRNAsi was; the higher grade was, the higher the mRNAsi was. In addition, we divided the mRNAsi into different groups according to the different clinical characteristics and studied the mRNAsi differences in the groups. We found that mRNAsi in UCEC_CN_HIGH was significantly higher than that in UCEC_CN_LOW. The mRNAsi of C2 was significantly higher than that of C1. The mRNAsi of the group whose mutation count was 60–500 was higher than that of the group whose mutation count was <60. The mRNAsi of G3 was significantly higher than that of G1 and G2. The mRNAsi of stage III and stage IV was higher than that of stage I ().
Figure 2. Correlations between mRNAsi and clinical features, TMB, and biomarkers. (A) Relationship between the mRNAsi distribution and clinical features, including subtype, immune subtype, mutation count, grade, and stage. The columns represent the mRNAsi samples arranged from low to high. Rows represent different features. (B) Violin diagram showing mRNAsi differences in the different clinical feature groups. (C) An overview of the association between mRNAsi and patient TMB and gene mutations, with columns representing the mRNAsi samples in the order of low to high and the rows representing different characteristics. (D) The relationship between mRNAsi and the different characteristic groups in the UCEC patient samples, grouped by TMB height and the mutation status of TP53, PTEN, KRAS, CEACAM5, APC, FGFR2, and MUC18. *p < 0.05, **p < 0.01, ***p < 0.001, ****p < 0.0001, ns: p > 0.05.
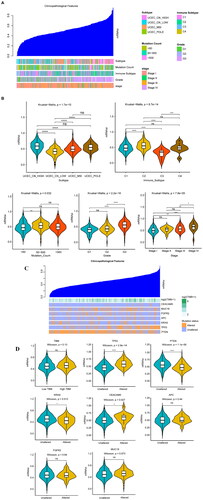
Stemness index and the TMB and biomarkers
The relationship between the mRNAsi distribution and the TMB and biomarkers is shown in . The higher mRNAsi, the higher the TMB. The mRNAsi was higher in TP53 mutant samples. We grouped the samples as high- or low-TMB according to their median TMB. We found no significant difference in the mRNAsi between the high- and low-TMB samples (p = 0.13). In addition, the differences in mRNAsi were assessed according to the identified genes (PTEN, TP53, KRAS, CEACAM5, APC, EGFR2), between the mutant and the non-mutant groups. mRNAsi in the TP53 and CEACAM5 mutation group was significantly higher than that in the non-mutant group (p < 0.05), while the PTEN mRNAsi in the non-mutant KRAS group was higher than that in the mutant group (p < 0.05) ().
ssGSEA calculation of the immune characteristics of the samples
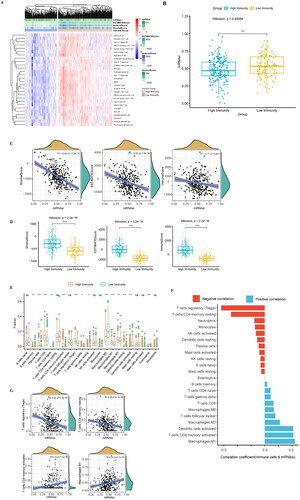
First, a total of 351 samples from the UCEC training set were used for the ssGSEA analysis, and the enrichment levels for 28 immune characteristics were obtained (Supplementary Table 2). We then used ESTIMATE to determine the immunity, stroma, and ESTIMATE scores (Supplementary Table 3) of the sample. Hclust clustering was adopted, and the complete-linkage clustering method was used. Samples were divided into high- and low-immune subtypes (). There were 220 samples with high immunity and 131 with low immunity (Supplementary Table 4). We used a box plot to show the differences in the mRNAsi in different immune subtypes and found that mRNAsi was higher in the high-immunity group than the low-immunity group ().
Figure 3. Analysis of the immune subtypes, mRNAsi, and immune infiltration. (A) Immune subtypes were classified according to the overall immune activity of UCEC. Behavioural immune cells were classified as samples. Red and blue indicate high and low levels of immune cell enrichment, respectively. The tumour microenvironment score is shown at the top of the heat map. (B) Box plots show the differences in the mRNAsi between the high- and low-immunity groups. Green and yellow represent high and low immunity, respectively. (C) Correlation analysis between the mRNAsi and the matrix, ESTIMATE, and immune scores which were assessed using the ESTIMATE algorithm. (D) Boxplot comparisons of the stroma, ESTIMATE, and immune scores for the different immune subtypes. (E) Comparison of the abundance of the 22 immune cell types in the immune subtypes. (F) Correlation analysis between immune cells and mRNAsi: red indicates a correlation coefficient <0, and green indicates a correlation coefficient >0. (G) The correlation curves of the abundance of 4 immune cells with strong positive and negative correlation coefficients and mRNAsi are displayed. *p < 0.05, **p < 0.01, ***p < 0.001, **** < 0.0001.
Immune cell infiltration among immune subtypes and correlation of immune cells with stemness index
The correlation curve for mRNAsi based on the matrix score was plotted, and the ESTIMATE and immune scores were calculated using ESTIMATE. The results showed that the mRNAsi were negatively correlated with the matrix score (R = −0.49, p < 0.001), Estima score (R = −0.32, p < 0.001), and immune score (R = −0.17, p = 0.0011) ()
In addition, we analysed the differences in the matrix, ESTIMATE, and immune scores in different immune subgroups, and the results showed that they were higher in the high-immunity group than in the low-immunity group ().
We estimated the relative proportion of 22 kinds of immune cells using the CIBERSORT algorithm, and the results showed that the abundance of most immune cells among the different immune subtypes had significant differences ( & Supplementary Table 5). We analysed the correlation of 22 immune cells with mRNAsi (Supplementary Table 6) and found that the mRNAsi was negatively correlated with regulatory T cells (R = −0.32, p < 0.001) and positively correlated with M1 macrophages (R = 0.22, p < 0.001) ().
DEG analysis of the high- and low-stemness index groups
Overall survival (OS) analysis was performed for UCEC, and the optimal P value was used to group the mRNAsi with a threshold of 0.51. There were significant differences in the OS between the two groups; in particular, there were 169 cases of high mRNAsi and 181 cases of low mRNAsi. The patients’ OS in the high-mRNAsi group was higher than that in the low-mRNAsi group (HR = 1.84, p = 0.0262) (). We further analysed the differences between the high and low mRNAsi in two groups of genes; | log2FC | >1 and p < 0.01 indicated a significant difference. A total of 287 genes were identified (Supplementary Table 7), and heat maps were utilised to show the expression of the DEGs (). We further analysed the differences in the clinical characteristics between the high- and low-mRNAsi groups, and the results revealed significant differences (p < 0.05) in immune subtype, grade, stage, TP53 mutation status, and TCGA subtype ().
Figure 4. Clinical features of the different mRNAsi groups, GO, KEGG, mutation, and CNV of DEGs. (A) OS analysis: the red line indicates high mRNAsi and the green line indicates low mRNAsi. (B) The heat map shows the DEG expression levels between the two groups. The red group represents high expression, and the blue group represents low gene expression. (C) Differences in the clinical characteristics between high- and lo—mRNAsi groups. Columns represent samples, and rows represent known clinical features. (D) Functional enrichment analysis of the DEGs, including BP, CC, and MF. (E) Scatter plot of the KEGG pathway enrichment statistics. In the figure, the circle size represents the number of genes enriched (count), the colour intensity represents the size of q value value. The darker the red, the higher the significance level. BP, biological process; CC: cell composition; MF: molecular function. (F) The differential enrichment pathways between the high- and low-mRNAsi groups. Each small box represents the enrichment score of each patient. Colour changes indicate the enrichment score, with red and blue representing high and low scores, respectively. The grouping of each patient is shown at the top of the heat map. (G) Waterfall diagram showing the 10 genes with the highest mutation frequency from the DEGs. Different colours indicate different mutation types. (H) Circos plot shows the CNV of the DEGs, with red indicating amplification and blue indicating deletion.
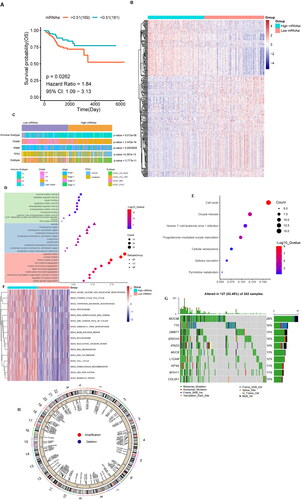
Next, we further analysed the function and pathway of the DEG enrichment data to obtain the GO terms and KEGG enrichment pathways. GO analysis included biological process (BP), Cellular Component (CC), and Molecular function (MF). We conducted GO and KEGG enrichment analysis for 287 differentially expressed genes and set the screening criteria as q value <0.05 (Supplementary Table 8 & Supplementary Table 9). We sorted the q values and used a bubble graph to show the top 30 significant BP, CC, and MF terms (). The enriched BP terms included organelle fission, nuclear division, and mitotic nuclear division. The spindle, chromosomal region, chromosome region, and centromeric region were the enriched CC terms. Enzyme inhibitor activity, peptidase regulator activity, and tubulin binding were the enriched MF terms. After analysis, seven pathways were identified as and meaningful. The bubble diagram in shows all the enriched pathways; the significantly enriched pathways include cell cycle and oocyte meiosis.
In addition, we used GSVA to analyse the differences in the enriched molecular pathways between the high- and low-mRNAsi groups. The results showed that the main enriched pathways in the high-mRNAsi group included KEGG_DNA_REPLICATION, KEGG_MISMATCH_REPAIR, and KEGG_CELL_CYCLE ( & Supplementary Table 10).
DEGs mutation and CNV
To understand the mutation status of the DEGs, we used a waterfall diagram to show the 10 genes with the highest mutation frequency, including MUC5B, TTK, DMBT1, ERICH3, ATAD2, MUC6, L1CAM, KIF4A, MYH11, and COL3A1. These genes were mutated in 52.48% of the samples, and the mutation type was mostly missense (). In addition, we analysed the CNV of 287 DEGs; representative results are shown in .
Identification of stemness subtypes based on DEG clustering, and survival analysis among subtypes
Based on the expression levels for 287 DEGs, a consistent clustering method was used to classify the samples. When K = 2, the consistency matrix showed the highest consistency (), and the cumulative distribution function (CDF) was the lowest when compared with the other clusters (). Moreover, the Delta area score was the highest when K = 2, after which the decline slowed down (). Therefore, two clusters were identified, namely stemness subtype I (191 cases) and stemness subtype II (160 cases) (Supplementary Table 11). We used the samples from these two clusters for subsequent analysis.
Figure 5. Identification and analysis of the stemness subtypes using their DEGs. (A) The consistency matrix graph shows the clustering situation when K = 2, which is the optimal clustering number. (B) The CDF plot shows the consensus distributions of each K; K = 2–10. (C) Delta area shows the relative change in stability; K = 2–10. (D) Survival analysis shows the differences in survival between stemness subtype I and stemness subtype II. (E) Heat map showing the expression levels of 287 DEGs, with red indicating high expression and blue indicating low expression. The stemness subtype, immune group, TCGA subtype, immune subtype, and mRNAsi for each patient are shown at the top of the heat map. (F) The consistency matrix graph shows the clustering situation when K = 2, which is the optimal clustering number. (G) The CDF plot shows the consensus distributions of each K; k = 2–9. (H) The delta area shows the relative change in stability; k = 2–9. (I) Survival analysis shows the OS differences between stemness subtypes I and II. (J) Differences in the clinical features between the stemness subtype I and stemness subtype II groups. Columns represent samples, and rows represent clinical features. (K) Differential enrichment pathways between stemness subtypes I and II are displayed. Each small box represents the enrichment score of each patient. Colour changes indicate the level of enrichment score: red and blue represent high and low scores, respectively, and the grouping of each patient is shown at the top of the heat map. (L) TCGA data set univariate Cox regression analysis. Significant factors include mRNAsi and the stemness subtype. (M) TCGA data set multivariate Cox regression analysis. The significant factor is the stemness subtype.
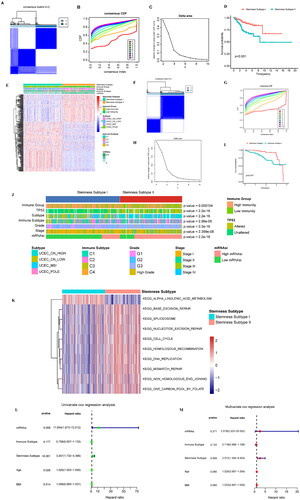
We further studied the relationship between the two stemness subtypes and survival rate and analysed the survival differences among the subtypes (). OS between the two groups was significantly different (p < 0.001), with patients in stemness subtype I having a higher OS than those in stemness subtype II. Heat maps were used to show the expression levels of the DEGs among the stemness subtypes ().
Furthermore, we extracted the expression of DEGs from the validation set, constructed the expression consisting of 287 DEGs, and then used the consistent clustering method to classify the samples. When K = 2, the consistency matrix showed the highest consistency (), and the CDF was the lowest when compared with the other clusters (). Moreover, the Delta area score was the highest when K = 2 (). Therefore, two clusters were identified, namely stemness subtype I (70 cases) and stemness subtype II (126 cases) (Supplementary Table 12).
We further studied the relationship between the two stemness subtypes and survival rate and analysed the survival differences among the subtypes (). OS between the two groups was significantly different (p = 0.047), with patients in stemness subtype I having a higher OS than those in stemness subtype II.
Clinical features and GSVA among subtypes
We analysed the differences in the clinical characteristics between stemness subtype I and stemness subtype II, and the results showed significant differences (p < 0.05) in immune group, TP53 mutation status, TCGA subtype, immunes, grade, stage, and mRNAsi grouping.
We analysed the stemness subtype I and II enrichment pathways between the two groups; | log2FC | >0.5 and p < 0.05 were considered significant. Ten different pathways were identified (Supplementary Table 13), and the results showed that KEGG_ALPHA_LINOLENIC_ACID_METABOLISM was the main enrichment pathway in the stemness subtype I group. The pathways mainly enriched in the stemness subtype II group included KEGG_DNA_REPLICATION, KEGG_MISMATCH_REPAIR, and KEGG_CELL_CYCLE ().
Univariate and multivariate independent prognostic analysis
Univariate and multivariate COX regression analyses were performed and included mRNAsi, immune subtype, stemness subtype, age, and BMI. The results showed that the stemness subtype was significantly associated in the univariate model (p < 0.001, HR = 3.057, 95% CI =1.732–5.396) and in the multifactorial model (p = 0.004, HR = 2.572, 95% CI = 1.344–4.924) were significant in prognostic analysis (), indicating that the stemness subtype could be an independent prognostic factor.
TMB, mutation, and CNV among subtypes, and the mutation status of biomarkers
We analysed the TMB differences among different stemness subtypes, and the results showed no significant difference between stemness subtype I and stemness subtype II (p > 0.05) (). We also analysed the mutations of genes in different stemness subtypes, and the results showed that the genes with high a mutation frequency in stemness subtype I were PTEN, PIK3CA, ARID1A, TTN, CTNNB1, PIK3R1, CTCF, MUC16, KRAS, and CSMD3; these genes were mutated in 97.3% of the samples in stemness subtype I. The genes with a high mutation frequency in stemness subtype II were TP53, PIK3CA, TTN, ARID1A, PTEN, KMT2D, CHD4, PP2R1A, MUC16, and DNAH7; these genes were mutated in 97.35% of the samples in stemness subtype II ().
Figure 6. Analysis of the stemness subtype TMB, gene mutation, CNV, immune microenvironment, and immune checkpoint gene. (A) The violin diagram shows the TMB differences between the stemness subtypes, with green and yellow representing stemness subtypes I and II, respectively. (B) Waterfall diagram showing the 10 genes with the highest mutation frequency in the stemness subtype I and stemness subtype II samples. Different colours indicate different mutation types. (C) Analysis of the copy number differences between stemness subtypes I and II, with red and blue indicating amplification and deletion, respectively. GISTIC analysis assigned each variation a G-score, which indicated the magnitude of the variation. (D) The G-score differences between stemness subtypes I and II were analysed using box plots. (E) Gene mutations in different stemness subtypes: sky blue and brown indicate that the gene did not and did mutate in the sample, respectively. (F) Box plot showing the differences in immune activity in the stemness subtypes. (G) Differences in the immune cells in the different groups. (H) Fiddle plots were used to compare the differences in immune, stroma, and ESTIMATE scores for the different stemness subtypes. (I) Differences in the distribution of the immune subtypes in different stemness subtypes; sky blue and brown represent low and high immunity levels, respectively. (J) Immune checkpoint gene difference analysis, with red and green representing stemness subtypes I and II, respectively. *p < 0.05, **p < 0.01, ***p < 0.001, ns: p > 0.05.
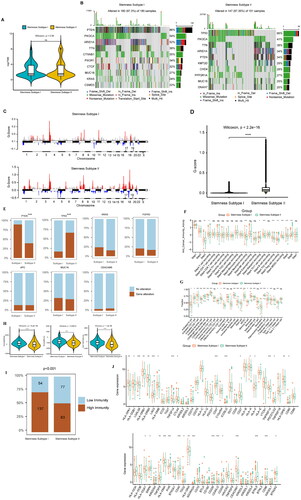
To understand the CNV differences among the different stemness subtypes, we analysed the stemness subtypes I and II using a GISTIC module in Genepattern. We visualised the data obtained by analysis using MAfTools (). Violin diagrams were then used to show the differences in the Gistic scores between the stemness subtypes I and II ().
We also analysed the mutations of biomarkers between different stemness subtypes, and the results showed that PTEN and TP53 exhibited significant mutations. The numbers of PTEN and TP53 mutations were higher in the stemness subtypes I and II, respectively ().
Analysis of immune activity between stemness subtypes
Immunoactivity analysis between stemness subtypes showed that stemness subtypes I and II had different anticancer immune statuses in the partial immune cycles ( & Supplementary Table 14). This result was confirmed by analysing differences in the proportion of infiltrating immune cells between stemness subtypes I and II, including activated B cells, activated CD4+ T cells, and activated CD8+ T cells ( & Supplementary Table 15). The results of the immune microenvironment analysis showed that the immune, matrix, and ESTIMATE scores were higher in stemness subtypes I than in stemness subtype II (). In addition, we combined immune subtypes to analyse the differences in them between the stemness subtypes. The results showed that many samples had high immunity levels in stemness subtype I, while low immunity levels were abundant in stemness subtype II (p < 0.001) ().
Analysis of immune checkpoint gene expression among subtypes
We analysed the differences in the expression levels of 65 immune checkpoint genes between stemness subtypes, and the results showed that stemness subtypes I and II had significant differences in multiple immune checkpoint genes ().
Prediction of immunotherapy response between cancer types
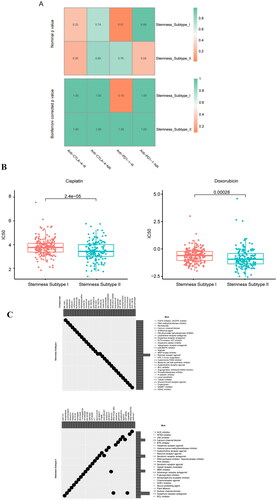
To analyse the efficacy of anti-PD-1 and anti-CTLA4 therapy in the different cancer subtypes, we extracted immunotherapy data of melanoma patients as reference data. A total of 47 immunotherapy patients were included in the analysis. The UCEC expression data were then predicted using a submap in Genepattern to obtain anti-PD-1 and anti-CTLA4 therapeutic efficacy; however, no significant results were obtained ().
Figure 7. Prediction of the immunotherapeutic response between cancer subtypes, sensitivity analysis of chemotherapeutic drugs between stemness subtypes, and identification of potential subtype compounds. (A) Submap prediction of the immunotherapy responses among the cancer subtypes. (B) Box diagram showing the sensitivity of the chemotherapies between the stemness subtypes, with red and green indicating stemness subtypes I and II, respectively. (C) Scatter diagram showing the relationship between compounds and MoA, with rows representing MoA and columns representing compounds.
Sensitivity analysis of chemotherapy among stemness subtypes
To understand the sensitivity of different stemness subtypes to chemotherapy drugs, we used the pRRophetic package to analyse the sensitivity of different stemness subtypes to cisplatin and adriamycin. The results showed that the sensitivities of stemness subtypes I and II to cisplatin and adriamycin were different, and the sensitivity of stemness subtype II was higher than that of stemness subtype I ( & Supplementary Table 16).
CMap analysis identifies subtypes of potential compounds
CMap was used to explore the potential compounds between stemness subtypes of UCEC, and the limma package was used to analyse the differential genes (236) between stemness subtypes I and II (Supplementary Table 17). The differential genes were queried into the CMap database; the top 30 compounds with negative enrichment scores for stemness subtypes I and II and p < 0.05 were selected for display, and the MoA of each compound was analysed ().
Multiple machine learning approaches to build and validate the stemness subtype predictor
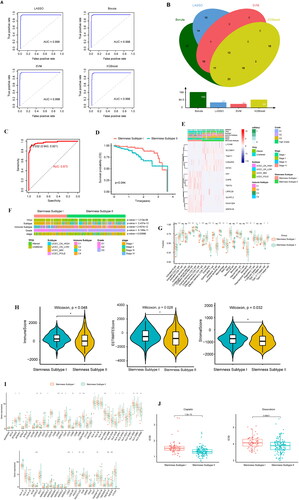
We used four machine learning algorithms to analyse the expression matrix based on 287 DEGs, and finally obtained the important characteristic genes associated with stemness subtype. ROC curve analysis showed that the AUC values for the four machine learning algorithms, namely LASSO, Boruta, SVM, and XGBoost, were 0.998, 0.998, 0.998, and 0.998, respectively (). Furthermore, 57, 169, 40, and 88 important characteristic genes were obtained through LASSO, Boruta, SVM, and XGBoost analysis, respectively. Twelve intersection genes of the four machine learning algorithms were identified by using a VENN diagram ( & Supplementary Table 18).
Figure 8. Machine learning approaches to build and validate a stemness subtype predictor. (A) LASSO, Boruta, SVM, and XGBoost feature selection performance evaluation; the AUC was generated using ROC curve analysis. (B) The characteristic genes shared by the 4 machine learning algorithms were determined using a VENN diagram, and 12 genes were identified as important. (C) ROC curve for characteristic gene prediction to validate the cluster stemness subtypes. (D) OS predicted by stemness subtypes. (E) The heat map shows the expression levels of characteristic genes in the validation set, with red and blue indicating high and low expression, respectively. Distribution of the clinical characteristics for each patient is shown at the top of the heat map, including the OS differences between mRNAsi, TP53 mutation status, TCGA subtype, immune subtype, grade, stage, and stemness subtype. (F) Differences in the clinical features between the stemness subtypes I and II. Columns represent samples, and rows represent clinical features. (G) Comparison of the abundance of 22 immune cells in the immune subtypes. (H) Fiddle plots were used to compare differences in the immune, ESTIMATE, and stroma scores for the different stemness subtypes. (I) Immune checkpoint gene difference analysis: red and green represent stemness subtypes I and II, respectively. (J) Case diagram shows the sensitivity of the chemotherapies between the stemness subtypes, with red and green indicating stemness subtypes I and II, respectively. *p < 0.05, **p < 0.01, ***p < 0.001, ns: p > 0.05.
Validation sets evaluated predictive performance
We conducted multivariate logistic regression analysis on 12 important characteristic genes and built a prediction model, obtaining the following formula for predicting stemness subtypes: Prediction score of stemness subtype = −1.969 + 0.071 × (KIF2C expression) + 0.035 × (C20orf24 expression) + 0.001 × (IHH expression) + 0.018 × (TNNT1 expression) − 0.12 × (SPATA18 expression) + 0.034 × (SLC38A1 expression) − 0.0043 × (KIAA1324 expression) − 0.829 × (TEKT4 expression) − 0.001 × (CAPS expression) − 0.0056 × (GLYATL2 expression) + 0.006 × (LRRC26 expression) + 0.004 × (L1CAM expression) (Supplementary Table 19). The first value in the formula is −1.969, which is the weight obtained by the multivariate logistic regression analysis. The regression coefficient in the formula can reflect the importance of the corresponding independent variable. The larger the absolute value of the coefficient, the more important this feature is. The validation set was predicted. The samples with a prediction score <0.032 belonged to stemness subtype I (126 cases), and the samples with a prediction score >0.032 belonged to stemness subtype II (70 cases) (Supplementary Table 20). ROC curve analysis showed that the AUC of stemness subtypes I and II was 0.973 (). We analysed the predicted OS differences among the stemness subtypes, and the results showed that the OS in stemness subtype I was higher than that in stemness subtype II (). A heat map was used to show the expression distribution of 12 important characteristic genes ().
We further analysed the differences in the distribution of the clinical features of the confirmed concentrated stemness subtype. The results showed that TP53 mutation status, TCGA subtype, immune subtype, and stage were different between the stemness subtypes I and II groups (). Tumour immune infiltration analysis showed partial differences in the proportion of stemness subtype I and stemness subtype II immune cells ( & Supplementary Table 21). Tumour microenvironment analysis showed higher immune, ESTIMATE, and stroma scores in stemness subtype I than in stemness subtype II ( & Supplementary Table 22)
We analysed the gene expression differences at 65 immune checkpoints between the verified cluster stemness subtypes, and the results showed significant differences between the stemness subtype I and stemness subtype II genes at multiple immune checkpoints ().
To understand the sensitivity of the different stemness subtypes to chemotherapy drugs, the pRRophetic package was used to analyse the sensitivity of different stemness subtypes to cisplatin and adriamycin in the validation set. The results showed that the sensitivities of stemness subtypes I and II to cisplatin and adriamycin were different, and the sensitivity of stemness subtype II was higher than that of stemness subtype I ( & Supplementary Table 23).
Discussion
In endometrial cancer, approximately one-third of patients have localised cancer at time of diagnosis [Citation35]. Most patients are successfully cured by surgery alone, or surgery followed by brachytherapy with or without external beam radiation therapy [Citation36–39]. However, approximately 13% of high-risk patients and 3% of low-risk patients relapse [Citation40,Citation41].
As CSCs may be responsible for tumour growth, invasion, and metastasis, they are of great clinical significance for understanding endometrial cancer metastasis, and for preventing its recurrence [Citation42]. Endometrial CSCs exhibit self-renewal, low proliferative activity, chemoresistance, and tumour initiation activity [Citation43]. In endometrial cancer, CSCs are associated with activation of Wnt/β-Catenin, PI3K/AKT, Notch, and NF-κB signalling, enhancing stemness, resistance, and EMT [Citation20,Citation43–47].
We compared the DEGs of the high- and low- stemness index groups and established the stemness subtypes based on their DEGs. The stemness subtypes were associated with immune cell infiltration and immune checkpoint gene expression. These findings confirm that stemness subtype can be used as an independent prognostic factor, and that the subtypes differ in their sensitivity to chemotherapy drugs. Thus, we constructed a stemness subtype prediction model and predictor.
In clinical practice, a patient’s stemness subtype can be determined based on stemness subtype markers, making it possible to predict prognosis as accurately as possible and to select appropriate chemotherapy drugs. At the same time, our subtype comparison of potential compounds provides a direction for discovering new chemotherapy drugs. These findings lay the foundation for exploring more appropriate therapeutic drugs based on cancer stemness classification.
Although immunotherapy has been used to treat a variety of tumours, for endometrial cancer, it is still in the research stage, and the available immunotherapy data are thus insufficient. The association between stemness subtype and immunotherapy reactivity in endometrial cancer needs to be validated in larger and more mature clinical datasets.
In endometrial cancer, POLE mutations and microsatellite instabilities are associated with high levels of tumour-infiltrating lymphocytes and antigen loads, suggesting that it responds well to immunotherapy, and particularly to PD-1/programmed cell death ligand 1 (PD-L1) checkpoint inhibitors [Citation48,Citation49]. There are currently several clinical trials underway, mostly in Phase I [Citation27,Citation28,Citation50]. Preliminary results reported at the American Society of Clinical Oncology website (AsCO.org) suggest atezolizumab (anti-PD-L1) and pembrolizumab (anti-PD-1) as promising agents for treating endometrial cancer [Citation27]. Atezolizumab was reported to have a good safety profile in a Phase I study (Clinical Trial Information: NCT01375842), with tumour reduction levels of 13% (2/15) in patients. A trend towards higher progression-free survival and OS was observed in patients with high levels of tumour-infiltrating immune cells [Citation51]. Another Phase I clinical trial (Clinical Trial Information: NCT02054806) showed that pembrolizumab had an acceptable safety profile and antitumor activity [Citation50]. A Phase 2 trial in MMR-deficient tumours also demonstrated modest efficacy for pembrolizumab [Citation49,Citation52].
Based on the lack of immunotherapy data for endometrial cancer, we extracted immunotherapy data for melanoma patients as reference data, finding that stemness subtype was not associated with immunotherapy in melanoma. However, this does not indicate that stemness subtype is not associated with immunotherapy in endometrial cancer.
Although we identified endometrial cancer stemness subtypes, and constructed predictive models and predictors, this study has some limitations. These stemness subtypes, and their sensitivity to chemotherapy drugs, need to be validated using clinical samples, and the molecular mechanisms require experimental clarification.
In conclusion, this study demonstrates that UCEC is classified into two stemness subtypes. The subtype could be an independent prognostic factor, associated with immune cell infiltration and chemotherapy sensitivity. These findings will therefore have substantial importance for the clinical diagnosis, treatment, and prognosis of endometrial cancer.
Author Contributions
Xiaoqin Lu and Wuliang Wang was responsible for designing the study, writing the manuscript, extracting and analysing data, interpreting results. Yanqi Ying and Wenyi Zhang have participated in extracting and analysing data. Rui Li contributed to review and edit the article.
Supplemental Material
Download MS Excel (87.8 KB)Supplemental Material
Download MS Excel (18.2 KB)Supplemental Material
Download MS Excel (18.9 KB)Supplemental Material
Download MS Excel (65.9 KB)Supplemental Material
Download MS Excel (14.3 KB)Supplemental Material
Download MS Excel (8.8 KB)Supplemental Material
Download MS Excel (8.6 KB)Supplemental Material
Download MS Excel (33 KB)Supplemental Material
Download MS Excel (26 KB)Supplemental Material
Download MS Excel (110.9 KB)Supplemental Material
Download MS Excel (67.1 KB)Supplemental Material
Download MS Excel (9.7 KB)Supplemental Material
Download MS Excel (12.2 KB)Supplemental Material
Download MS Excel (15 KB)Supplemental Material
Download MS Excel (10.5 KB)Supplemental Material
Download MS Excel (9.5 KB)Supplemental Material
Download MS Excel (12.6 KB)Supplemental Material
Download MS Excel (30.6 KB)Supplemental Material
Download MS Excel (9.3 KB)Supplemental Material
Download MS Excel (70.7 KB)Supplemental Material
Download MS Excel (15 KB)Supplemental Material
Download MS Excel (28.2 KB)Supplemental Material
Download MS Excel (136.4 KB)Supplemental Material
Download MS Excel (28.4 KB)Disclosure statement
No potential conflict of interest was reported by the author(s).
Data availability statement
Publicly available datasets were analysed in this study. This data can be found here: https://www.cancer.gov/about-nci/organization/ccg/research/structural-genomics/tcgaunding.
Additional information
Funding
References
- Bell DW, Ellenson LH. Molecular genetics of endometrial carcinoma. Annu Rev Pathol. 2019;14:339–367.
- Bray F, Ferlay J, Soerjomataram I, et al. Global cancer statistics 2018: GLOBOCAN estimates of incidence and mortality worldwide for 36 cancers in 185 countries. CA Cancer J Clin. 2018;68(6):394–424.
- Siegel RL, Miller KD, Jemal A. Cancer statistics, 2020. CA A Cancer J Clin. 2020;70(1):7–30.
- van den Heerik A, Horeweg N, de Boer SM, et al. Adjuvant therapy for endometrial cancer in the era of molecular classification: radiotherapy, chemoradiation and novel targets for therapy. Int J Gynecol Cancer. 2021;31(4):594–604.
- Malta TM, Sokolov A, Gentles AJ, Cancer Genome Atlas Research Network, et al. Machine Learning identifies stemness features associated with oncogenic dedifferentiation. Cell. 2018;173(2):338–354.e315.
- Bjerkvig R, Tysnes BB, Aboody KS, et al. Opinion: the origin of the cancer stem cell: current controversies and new insights. Nat Rev Cancer. 2005;5(11):899–904.
- Reya T, Morrison SJ, Clarke MF, et al. Stem cells, cancer, and cancer stem cells. Nature. 2001;414(6859):105–111.
- Bapat SA. Evolution of cancer stem cells. Semin Cancer Biol. 2007;17(3):204–213.
- Marusyk A, Almendro V, Polyak K. Intra-tumour heterogeneity: a looking glass for cancer? Nat Rev Cancer. 2012;12(5):323–334.
- Kreso A, Dick JE. Evolution of the cancer stem cell model. Cell Stem Cell. 2014;14(3):275–291.
- Nangia-Makker P, Hogan V, Raz A. Galectin-3 and cancer stemness. Glycobiology. 2018;28(4):172–181.
- Shibue T, Weinberg RA. EMT, CSCs, and drug resistance: the mechanistic link and clinical implications. Nat Rev Clin Oncol. 2017;14(10):611–629.
- Ge Y, Gomez NC, Adam RC, et al. Stem Cell lineage infidelity drives wound repair and cancer. Cell. 2017;169(4):636–650.e614.
- Esparza R, Azad TD, Feroze AH, et al. Glioblastoma stem cells and stem cell-targeting immunotherapies. J Neurooncol. 2015;123(3):449–457.
- Carvalho MJ, Laranjo M, Abrantes AM, et al. Endometrial cancer spheres show cancer stem cells phenotype and preference for oxidative metabolism. Pathol Oncol Res. 2019;25(3):1163–1174.
- Giannone G, Attademo L, Scotto G, et al. Endometrial cancer stem cells: role, characterization and therapeutic implications. Cancers (Basel). 2019;11(11):1820.
- Dawood S, Austin L, Cristofanilli M. Cancer stem cells: implications for cancer therapy. Oncology (Williston Park). 2014;28(12):1101–1107, 1110.
- Vander Linden C, Corbet C. Therapeutic targeting of cancer stem cells: integrating and exploiting the acidic niche. Front Oncol. 2019;9:159.
- Hubbard SA, Gargett CE. A cancer stem cell origin for human endometrial carcinoma? Reproduction. 2010;140(1):23–32.
- Lu H, Ju DD, Yang GD, et al. Targeting cancer stem cell signature gene SMOC-2 overcomes chemoresistance and inhibits cell proliferation of endometrial carcinoma. EBioMedicine. 2019;40:276–289.
- Kim M, Lee S, Park WH, et al. Silencing Bmi1 expression suppresses cancer stemness and enhances chemosensitivity in endometrial cancer cells. Biomed Pharmacother. 2018;108:584–589.
- Kato M, Onoyama I, Yoshida S, et al. Dual-specificity phosphatase 6 plays a critical role in the maintenance of a cancer stem-like cell phenotype in human endometrial cancer. Int J Cancer. 2020;147(7):1987–1999.
- Johdi NA, Sukor NF. Colorectal cancer immunotherapy: options and strategies. Front Immunol. 2020;11:1624.
- Gajewski TF, Schreiber H, Fu YX. Innate and adaptive immune cells in the tumor microenvironment. Nat Immunol. 2013;14(10):1014–1022.
- Marcus A, Gowen BG, Thompson TW, et al. Recognition of tumors by the innate immune system and natural killer cells. Adv Immunol. 2014;122:91–128.
- Vesely MD, Kershaw MH, Schreiber RD, et al. Natural innate and adaptive immunity to cancer. Annu Rev Immunol. 2011;29:235–271.
- Marinelli O, Annibali D, Aguzzi C, et al. The Controversial role of PD-1 and its ligands in gynecological malignancies. Front Oncol. 2019;9:1073.
- Brooks RA, Fleming GF, Lastra RR, et al. Current recommendations and recent progress in endometrial cancer. CA Cancer J Clin. 2019;69(4):258–279.
- Picard E, Verschoor CP, Ma GW, et al. Relationships between immune landscapes, genetic subtypes and responses to immunotherapy in colorectal cancer. Front Immunol. 2020;11:369.
- Chen P, Yang Y, Zhang Y, et al. Identification of prognostic immune-related genes in the tumor microenvironment of endometrial cancer. Aging (Albany NY). 2020;12(4):3371–3387.
- Li BL, Wan XP. Prognostic significance of immune landscape in tumour microenvironment of endometrial cancer. J Cell Mol Med. 2020;24(14):7767–7777.
- Xu L, Deng C, Pang B, et al. TIP: a web server for resolving tumor immunophenotype profiling. Cancer Res. 2018;78(23):6575–6580.
- Starzer AM, Preusser M, Berghoff AS. Immune escape mechanisms and therapeutic approaches in cancer: the cancer-immunity cycle. Ther Adv Med Oncol. 2022;14:17588359221096219.
- Tang S, Ning Q, Yang L, et al. Mechanisms of immune escape in the cancer immune cycle. Int Immunopharmacol. 2020;86:106700.
- Cancer stat facts: Uterine cancer. National Cancer Institute. Available at: https://seer.cancer.gov/statfacts/html/corp.html. (Accessed on September 28, 2019).
- Signorelli M, Lissoni AA, Cormio G, et al. Modified radical hysterectomy versus extrafascial hysterectomy in the treatment of stage I endometrial cancer: results from the ILIADE randomized study. Ann Surg Oncol. 2009;16(12):3431–3441.
- Nout RA, Smit VT, Putter H, PORTEC Study Group, et al. Vaginal brachytherapy versus pelvic external beam radiotherapy for patients with endometrial cancer of high-intermediate risk (PORTEC-2): an open-label, non-inferiority, randomised trial. Lancet. 2010;375(9717):816–823.
- de Boer SM, Powell ME, Mileshkin L, et al. Adjuvant chemoradiotherapy versus radiotherapy alone for women with high-risk endometrial cancer (PORTEC-3): final results of an international, open-label, multicentre, randomised, phase 3 trial. Lancet Oncol. 2018;19(3):295–309.
- National Comperhensive Cancer Network. Available online: https://www.nccn.org/professionals/physician_gls/pdf/uterine_blocks.pdf. (Accessed on September 28, 2019).
- Fung-Kee-Fung M, Dodge J, Elit L, Cancer Care Ontario Program in Evidence-based Care Gynecology Cancer Disease Site Group, et al. Follow-up after primary therapy for endometrial cancer: a systematic review. Gynecol Oncol. 2006;101(3):520–529.
- Lajer H, Jensen MB, Kilsmark J, et al. The value of gynecologic cancer follow-up: evidence-based ignorance? Int J Gynecol Cancer. 2010;20(8):1307–1320.
- Banz-Jansen C, Helweg LP, Kaltschmidt B. Endometrial cancer stem cells: where do We stand and where should We go? Int J Mol Sci. 2022;23(6):3412.
- Friel AM, Sergent PA, Patnaude C, et al. Functional analyses of the cancer stem cell-like properties of human endometrial tumor initiating cells. Cell Cycle. 2008;7(2):242–249.
- Witte KE, Hertel O, Windmöller BA, et al. Nanopore Sequencing reveals global transcriptome signatures of mitochondrial and ribosomal gene expressions in various human cancer stem-like cell populations. Cancers (Basel). 2021;13(5):1136.
- Kusunoki S, Kato K, Tabu K, et al. The inhibitory effect of salinomycin on the proliferation, migration and invasion of human endometrial cancer stem-like cells. Gynecol Oncol. 2013;129(3):598–605.
- Dong P, Konno Y, Watari H, et al. The impact of microRNA-mediated PI3K/AKT signaling on epithelial-mesenchymal transition and cancer stemness in endometrial cancer. J Transl Med. 2014;12:231.
- Gao Y, Liu T, Huang Y. MicroRNA-134 suppresses endometrial cancer stem cells by targeting POGLUT1 and notch pathway proteins. FEBS Lett. 2015;589(2):207–214.
- Howitt BE, Shukla SA, Sholl LM, et al. Association of polymerase e-Mutated and Microsatellite-Instable endometrial cancers with neoantigen load, number of Tumor-Infiltrating lymphocytes, and expression of PD-1 and PD-L1. JAMA Oncol. 2015;1(9):1319–1323.
- Le DT, Durham JN, Smith KN, et al. Mismatch repair deficiency predicts response of solid tumors to PD-1 blockade. Science. 2017;357(6349):409–413.
- Ott PA, Bang YJ, Berton-Rigaud D, et al. Safety and antitumor activity of pembrolizumab in advanced programmed death ligand 1-Positive endometrial cancer: results from the KEYNOTE-028 study. J Clin Oncol. 2017;35(22):2535–2541.
- Fleming GF, Emens LA, Eder JP, et al. Clinical activity, safety and biomarker results from a phase Ia study of atezolizumab (atezo) in advanced/recurrent endometrial cancer (rEC). J Clin Oncol. 2017;35(15_suppl):5585–5585.
- Le DT, Uram JN, Wang H, et al. PD-1 blockade in tumors with Mismatch-Repair deficiency. N Engl J Med. 2015;372(26):2509–2520.