
 ?Mathematical formulae have been encoded as MathML and are displayed in this HTML version using MathJax in order to improve their display. Uncheck the box to turn MathJax off. This feature requires Javascript. Click on a formula to zoom.
Abstract
Indocyanine green (ICG) is effective for a variety of applications including liver tumour imaging and operates in the near-infrared window. Agents for near-infrared imaging are, however, still in clinical development. The present study aimed to prepare and investigate fluorescence emission properties of ICG in combination with Ag-Au in order to enhance their specific interactions with human hepatocellular carcinoma cell lines (HepG-2). The Ag-Au-ICG complex was prepared via physical adsorption, and hence evaluated for fluorescence spectra using a spectrophotometer. Ag-Au-ICG at an optimised dosage (Ag-Au:ICG = 0.0147:1 molar ratio) in Intralipid medium was added to HepG-2 to observe the maximum fluorescence signal intensity, which further enhanced HepG-2 contrast fluorescence. Ag-Au-ICG served as a fluorescence enhancer bound onto the liposome membrane, whilst free Ag, Au, and pure ICG induced low levels of cytotoxicity in HepG-2 and a normal human cell line. Thus, our findings provided new insights for the liver cancer imaging.
Concentration-dependent fluorescence peaking in the near-infrared window revealed ICG aggregation in Ag-Au molecules.
Ag-Au-ICG fluorescence intensity depended strongly on the environmental media.
Human hepatocellular carcinoma cell lines treated with Ag-Au-ICG in Intralipid enhanced the contrast of fluorescence microscopy images by decreasing the level of scattering in the cell lines with the contrast values being approximately five times those observed in pure ICG in Intralipid.
Highlights
Introduction
Although nanotechnologies have been widely used as therapeutic and carrier agents in targeted drug delivery systems into hepatocellular carcinoma (HCC), receiving a comprehensive medical diagnosis prior to treatment commencement is essential [Citation1]. For a rapid and correct diagnosis of HCC, a combination of nanomaterials and fluorescent agents might be useful for advancing fluorescence bioimaging technology. Among HCC nanomedicine research, indocyanine green (ICG), a Food and Drug Administration (FDA)-approved water-soluble tricarbocyanine fluorescence probe, has been known to selectively accumulate in primary liver cancer and facilitate liver cancer imaging as well as surgery [Citation2]. ICG displays its fluorescence emission in near-infrared light with excitation and emission wavelengths at 740–800 nm and 800–860 nm, respectively. Although ICG imaging has been successful in clinical applications, emission attenuation by light scattering in deep tissue remains an important issue [Citation3–10], as it leads to poor spatial resolution. In addition, ICG imaging has been impeded by the high cost of sensitive detectors. However, the fluorescence detection in the near-infrared window makes it possible to improve image performance with help from nanotechnology.
Nanomaterials have now become affordable and been engineered to improve fluorescence quantum yield, resulting in high resolution, contrast, and sensitivity of fluorescence imaging. The development of fluorescence imaging agents for clinical testing was propelled by the availability of a variety of anisotropic nanomaterials, including carbon nanodots and carbon nanotubes [Citation11]. Moreover, different sizes and shapes of noble bimetal nanoparticles, namely Ag-Au and Ag-Pd nanostructures, showed a shift of the surface plasmon resonance wavelengths towards near-infrared windows [Citation12]. Therefore, it is thought that the use of ICG and noble bimetallic nanoparticles might complement each other and improve the fluorescence imaging resolution. Furthermore, since the current dose value of ICG to demonstrate the superior fluorescence intensity and image quality for liver tumour detection is 7 ppm before surgery [Citation13,Citation14], the availability of bimetallic nanoparticles and ICG compounds might provide the alternative approaches for imaging liver cancer in clinical practice.
In this study, Au-core, Ag-shell nanorods serving as ICG nanocarrier were proposed as an alternative to the traditional ICG staining and was meant to reduce the ICG dose, which might cause some unwanted side effects, such as allergic reactions [Citation15]. The Au-core, Ag-shell nanorods were selected because they showed tuneable fluorescence signals under near-infrared light as compared with Ag alone and Au alone of similar sizes [Citation16,Citation17]. Aggregation of positively charged core-shell nanostructures on the negatively charged cellular surface yielded strong fluorescence emission. Thus, our compound could potentially be used as a bioimaging agent. Intralipid was widely used as an optical model for mimicking living tissue scattering properties. Intralipid was here as well as it is an FDA approved fat emulsion used nutritional supplement for patients undergoing cancer treatment [Citation18]. Pre-treatment with Intralipid with chemo drugs increased the tumour cytotoxicity and reduced the off-target toxicity, which further led to a reduction of chemotherapeutic drug dosage. In our study, we showed that the Ag-Au-ICG complex utilised in the near-infrared window is less affected by photon absorption and scattering effects; thus, improving fluorescence contrast imaging of cancer cell lines. The microenvironment interaction mechanism underlying the Ag-Au-ICG tested in cancer cell lines would provide a clear picture of their safety (early detection and diagnosis) and cytotoxicity. Following proper preparation, bioimaging might enable a clear visualisation of tumour organoids and tissues in the next step.
Materials and methods
Materials
Au-core, Ag-shell nanorods in suspension form (ϕ = 26 ± 2 nm) was bought from Nanoseedz (Hong Kong, China). Indocyanine green (ICG) in powder form and 20% Intralipid were bought from Sigma-Aldrich (St. Louis, MO, USA). Deep red-LED (660 nm, 3 W) was bought from Chanzon (China). Dulbecco’s modified Eagle’s medium (DMEM), foetal bovine serum (FBS), and phosphate buffered saline (PBS) were bought from Sigma-Aldrich (Singapore).
Cell culture
Human hepatocellular carcinoma cell lines (HepG-2) were obtained from Scientific Instrument Centre, Faculty of Science, King Mongkut’s Institute of Technology Ladkrabang, Bangkok. Human keratinocyte immortal cells (HaCat) were used as the normal cell line. Cells were cultured overnight in an incubator at 37 °C with 5% carbon dioxide in flasks with DMEM supplemented with 10% FBS, according to previous protocol [Citation19]. After washing twice with PBS, the adhered cells were resuspended in the culture medium. A final density of 1.0 × 10⁵ cells/mL was reached.
Fluorescence measurement
ICG in different media (deionised water and 1% Intralipid) was prepared at concentrations of 1.3, 2.5, 5.9, 10.8, 18.4, 24.2, 28.7, and 32.3 μM. We used 1 ml of 20% Intralipid and diluted it in up to 20 ml of saline solution to obtain the 1% Intralipid [Citation20]. ICG solution was made fresh and used within 2 h. Ag-Au was obtained as colloidal solution in different media (deionised water and 1% Intralipid) at concentrations of 47.5, 52.8, 59.4, 67.9, 79.3, 86.5, 91.4, and 93.2 nM. The prepared solution was a 1:1 mix ratio (v/v) to obtain the target concentrations for different reaction times (). Subsequently, absorbance spectra of Ag-Au-ICG and free ICG were measured at 300–1100 nm using a spectrophotometer (Avantes, Netherlands). Total time for each data acquisition was approximately 30 s. The emission spectra were collected using a 660 nm LED excitation wavelength available for fluorescence experiments. The spectra were obtained within 1 h of dilution preparation. Fluorescence quantum yield was modified as follows [Citation21,Citation22]:
(1)
(1)
where QS and Qc are the fluorescence quantum yields of the sample and control, respectively. IS and IC represent the integrated fluorescence intensities of the sample and control, respectively. AS and AC represent the absorbance of the sample and control, respectively.
Table 1. Amount of Ag-Au and ICG in two different solvents (deionised water and 1% Intralipid) under different reaction times.
In vitro studies for testing fluorescence image
Human hepatocellular carcinoma cell lines (HepG-2) were seeded into a 24-well plate (1 × 10⁵ cells/mL) under a pH 6.0 and the wells were incubated at 37 °C and 5% carbon dioxide for 24 h. For comparative fluorescence imaging of HepG-2 by each fluorescent agent, 0.1 ml of individual formulated solution was added to 0.1 ml of the cell suspension in 24-well plates. The optimal molar ratio of Ag-Au:ICG was 0.0147:1 (). Fluorescence images were therefore captured using inverted fluorescence microscope (Nikon; magnification ×10) after exposure to Ag-Au-ICG and ICG in Intralipid with two exposure times (1 and 2 h). The amount of ICG (Control) was the same as that of Ag-Au-ICG (Sample) as described in . Namely, we used 5.9 µM ICG and 86.5 nM Ag-Au in order to obtain a molar ratio of 0.0147:1 (Ag-Au:ICG). Total time for each image acquisition was approximately 1 min. Contrast image analysis was done using the ImageJ software.
Cell viability and apoptosis
Viability and apoptosis of HepG-2 following Ag-Au-ICG and ICG treatments were carried out according to previous protocol [Citation19,Citation23]. Fluorescence intensity was determined using flow cytometry (FCM model: BD FACSCanto, Piscataway, NJ, USA). We used R-phycoerythrin (R-PE) as the fluorescence signal.
Statistical analysis
Data were presented as the mean. Data were analysed using the graphical and statistical modelling package “Origin5.0”, and differences were assessed using ANOVA with a significance set at p < 0.05.
Results
Ag-Au absorbed the light over a broad wavelength range of 450–950 nm, whereas pure ICG demonstrated its fluorescence peak at approximately 830 nm (). Notably, a combination of Ag-Au and ICG showed a significant fluorescence peak position in the near-infrared window ( and ). Solvent medium-dependent fluorescence peak position was also in agreement with that measured by den Bos et al. [Citation24]. Similar to the free ICG, the fluorescence peak of Ag-Au-ICG was at 800–830 nm in deionised water and further shifted to 830–850 nm in Intralipid. At an equivalent molar ratio of Ag-Au:ICG, fluorescence intensity was enhanced as follows: ICG in Intralipid; ICG in deionised water; Ag-Au-ICG in Intralipid; Ag-Au-ICG in deionised water. Our findings indicate that Ag-Au-ICG exhibited a bimodal fluorescence spectrum in aqueous media because of two reasons. One, small molecules of water-soluble ICG monomer provided numerous surface attachments sites for Ag-Au, especially at low concentrations [Citation25,Citation26]. Two, Ag-Au-ICG molecules were easily adsorbed into Intralipid [Citation27]. Therefore, Ag-Au might deliver much more ICG to the tumour site and allow for longer duration imaging.
Figure 1. Representative normalised absorbance of free Ag-Au and normalised fluorescence of free ICG in deionised water.
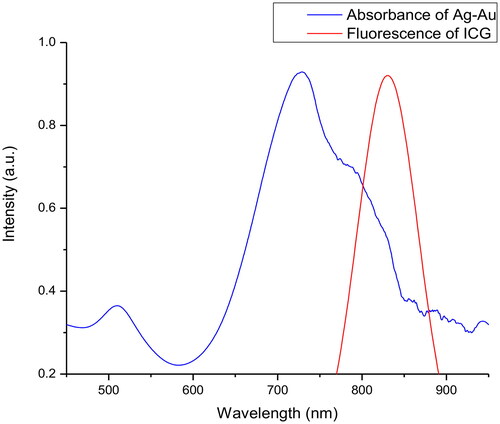
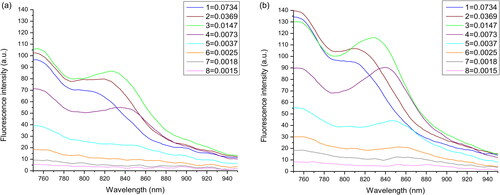
Figure 2. Fluorescence emission profiles of (a) free ICG and (b) Ag-Au-ICG in deionised water at the different molar ratio of Ag-Au:ICG (1).
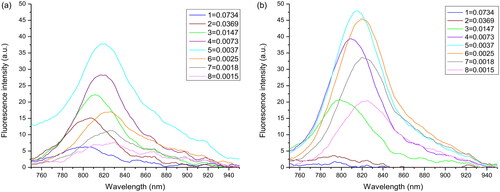
Figure 3. Fluorescence emission profiles of (a) free ICG and (b) Ag-Au-ICG in 1% Intralipid under different molar ratio of Ag-Au:ICG (1).
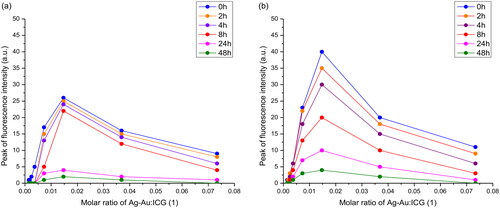
Time-dependent fluorescence intensity was displayed in and . Similar to free ICG, the peak fluorescence intensity of Ag-Au-ICG in deionised water and Intralipid gradually decreased from 0 to 2 h and exhibited a more sudden decrease from 24 to 48 h. The fluorescence values were approximately 0 after 48 h. Therefore, the ICG solution used in this study is suggested to be made fresh and used within 1–2 h. The emission spectra should be obtained within 1–2 h of the dilution preparation.
Figure 4. Peak fluorescence intensity of (a) free ICG and (b) Ag-Au-ICG in deionised water under different molar ratio of Ag-Au:ICG(1) for a reaction time period of 0–48 h.
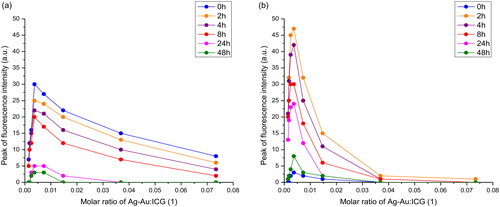
Figure 5. Peak fluorescence intensity of (a) free ICG and (b) Ag-Au-ICG in 1% Intralipid under different molar ratio of Ag-Au:ICG(1) for a reaction time period of 0–48 h.
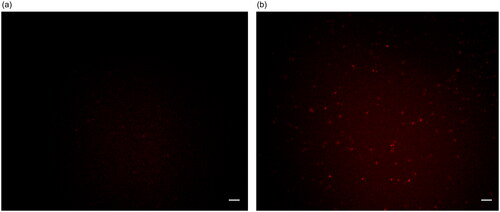
To evaluate the binding effect of Ag-Au-ICG used as a fluorescence imaging agent on liver cancer cells, HepG-2 (as a simulation of liver cancer cells) cells were treated with the optimal molar ratio of Ag-Au:ICG in Intralipid (0.0147:1), ensuring high-contrast fluorescence imaging as the scattering effect is concentration-dependent. Free ICG in Intralipid was used as a control. Bright field images and their corresponding fluorescence images of HepG-2 were acquired 1 and 2 h post administration of Ag-Au-ICG and free ICG in Intralipid (). Unlike free ICG in Intralipid, the bright spots observed in fluorescence images of HepG-2 treated with Ag-Au-ICG in Intralipid from 1 h were more intense than those observed at 2 h. This was due to the excitation of surface plasmon resonance along the long axis of Ag-Au, which induced a shift of the resonance wavelengths towards the near-infrared, elevating the emission intensity compared to that observed following the treatment with ICG alone [Citation12, Citation28–30].
Figure 6. Bright field image of HepG-2 treated with (a) free ICG and (b) Ag-Au-ICG in 1% Intralipid for 1 h.
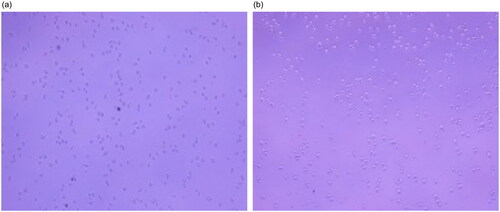
Figure 7. Bright field image of HepG-2 treated with (a) free ICG and (b) Ag-Au-ICG in 1% Intralipid for 2 h.
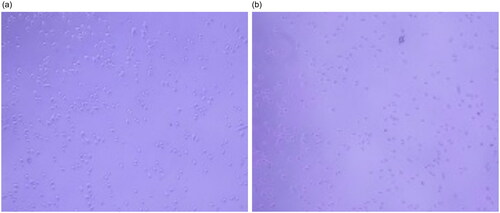
Figure 8. Fluorescence image of HepG-2 treated with (a) free ICG and (b) Ag-Au-ICG in 1% Intralipid for 1 h. Scale bar, 50 µm.
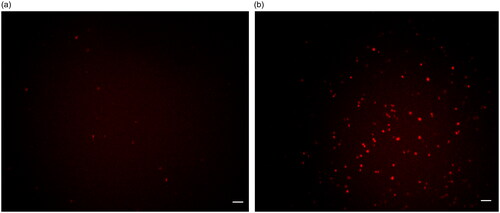
Figure 9. Fluorescence image of HepG-2 treated with (a) free ICG and (b) Ag-Au-ICG in 1% Intralipid for 2 h. Scale bar, 50 µm.
Discussion
According to Equation (1), the fluorescence quantum yields of Ag-Au-ICG obtained from fluorescence intensities depicted in (Ag-Au-ICG in deionised water) and 3 (Ag-Au-ICG in Intralipid) were calculated and shown in (Ag-Au-ICG in deionised water) and 3 (Ag-Au-ICG in Intralipid), respectively. In detail, the fluorescence quantum yield of Ag-Au-ICG in deionised water (0.0210–0.1107 as seen in ) was lower than that in Intralipid (0.1190–0.2501 as seen in ). This was because the emission intensity of Ag-Au-ICG in the near-infrared light was strongly attenuated due to water absorption; however, this effect was weaker for Intralipid [Citation31]. We also showed that the highest fluorescence quantum yield of Ag-Au-ICG in Intralipid was 0.2501. Thus, the optimal molar ratio of Ag-Au:ICG was 0.0147:1 and hence selected for the cell imaging experiment.
Table 2. Optical properties of Ag-Au-ICG and free ICG in deionised water at 0 h. Fluorescence quantum yield of standard ICG in water was 0.042 [Citation33].
Table 3. Optical properties of Ag-Au-ICG and free ICG in 1% Intralipid at 0 h. Fluorescence quantum yield of standard ICG in emulsion was 0.086 [Citation21,Citation22].
In , the fluorescence intensity of Ag-Au-ICG was increased (fluorescence enhancement effect) when the molar ratio of Ag-Au:ICG in deionised water was increased from 0.0015:1 to 0.0037:1. This low molar ratio represented decreasing distance from each surface of Ag-Au in deionised water to be easily adsorbed by ICG [Citation32]). The fluorescence intensity of Ag-Au-ICG was reduced (fluorescence quenching effect) when the molar ratio of Ag-Au:ICG in deionised water was further increased from 0.0073:1 to 0.0734:1 (high molar ratio). The fluorescence intensity trend changed of Ag-Au-ICG in Intralipid () was the same as that in deionised water (). That is, the fluorescence intensity of Ag-Au-ICG was increased (fluorescence enhancement effect) when the molar ratio of Ag-Au:ICG in Intralipid was increased from 0.0015:1 to 0.0147:1 (low molar ratio). This low molar ratio represented decreasing distance from each surface of Ag-Au in Intralipid to be easily adsorbed by ICG [Citation32]). The fluorescence intensity of Ag-Au-ICG was reduced (fluorescence quenching effect) when the molar ratio of Ag-Au:ICG in Intralipid was further increased from 0.0369:1 to 0.0734:1 (high molar ratio). Therefore, the optimal molar ratio of Ag-Au:ICG in Intralipid (0.0147:1) was specifically chosen for maximum contrast during fluorescence cell imaging when selecting the highest fluorescence quantum yield of 0.2501. Using this optimal dose, the ICG concentration of 5.9 µM (or 4.5 ppm) used in our study was lower than the dose that has been shown to cause unwanted side effects [Citation8,Citation9].
To further refine the image quality, quantitative analysis of the fluorescence enhancement effect of Ag-Au-ICG in Intralipid on HepG-2 fluorescence cell imaging was carried out based on contrast image measurements (gray value) of the region of interest. Image quality of HepG-2 following treatment with Ag-Au-ICG in Intralipid was superior to that observed following treatment with free ICG in Intralipid at equivalent exposure time, corresponding to the fluorescence quantum yield data. The contrast images could be further enhanced by using longer exposure times (approximately 5 times of that used in free ICG). Namely, the contrast image of the system was reduced in the following order: Ag-Au-ICG in Intralipid for 1 h (10.0); Ag-Au-ICG in Intralipid for 2 h (8.6); free ICG in Intralipid for 1 h (3.2); free ICG in Intralipid for 2 h (1.7). Despite the relative loss of signal intensity associated with Ag-Au-ICG in Intralipid at 2 h, the fluorescence cell imaging quality attributed to the reduced scattering effects induced by Ag-Au-ICG was still higher than that associated with the use of ICG alone.
Similar to HaCat cells, the cell viability of HepG-2 treated by Ag-Au-ICG was higher than 96%; thus, indicating that the fluorescence imaging agent developed in this study can be used to facilitate liver cancer imaging (). Following flow cytometry analysis, we showed that the mean fluorescent intensity corresponding to the observed 4% cell apoptosis was probably induced by free metal ions (approximately 2%) and free ICG (approximately 2%). As the extracellular pH values in tumour cells were lower than in normal cells [Citation35], it is possible that the Ag-Au hydrolysis released some free silver and gold ions, which further increased the proportion of silver and gold ions in the system. Next, fatty acids within ICG reacted with Ag-Au and these free metal ions during the formation of Ag-Au-ICG complex. Thus, the free radical scavenging activity induced by the presence of free metal ions might have let to DNA damage [Citation36]. It is also possible that the free ICG was less cytotoxic to the cells [Citation37]. Therefore, it could be concluded that the biological interactions on nanomaterial surfaces were derived from the complementary effects of Ag-Au and ICG molecules. A significant number of Ag-Au-ICG complex transported into the HepG-2 emitted the intense intrinsic fluorescence and allowed Ag-Au and ICG to track the live cells. The cytoplasm of live cells was hence visualised in red, whereas free Ag and Au as well as ICG alone minimally cytotoxic to HepG-2 and HaCat cell lines.
Table 4. Comparative cell apoptosis induced by ICG and Ag-Au-ICG in a human cancer cell line (HepG-2) and a human normal cell line (HaCat). MFI: Mean fluorescence intensity (a.u.).
Conclusions
This study aimed to examine the physiochemical properties Ag-Au-ICG that played an important role in improving the fluorescence imaging contrast on liver cancer cell lines. Ag-Au and ICG were prepared using the physical adsorption method and characterised by measuring fluorescence spectra using a spectrophotometer. Cell visualisation was performed to evaluate the image quality following treatment with the optimal dose of Ag-Au-ICG. Our results indicate that the fluorescence peaks of Ag-Au-ICG, and to a lesser extent free ICG, in different media (deionised water and Intralipid) for a range of Ag-Au and ICG concentrations were shifted towards the near-infrared window. Additionally, the use of Ag-Au-ICG was associated with a significant enhancement of fluorescence intensity. This enhanced fluorescence emission was substantially affected by the environment of the Ag-Au and ICG molecules. For in vitro imaging, human hepatocellular carcinoma cell lines treated with Ag-Au-ICG in Intralipid showed an improved image contrast due to the decreased intra-cellular scattering. Furthermore, the contrast values observed following treatment with Ag-Au-ICG in Intralipid were approximately five times higher than those observed following free ICG in Intralipid treatment. The availability of Ag-Au-ICG in Intralipid could provide novel insights for advancing fluorescence imaging technology for liver cancer patients in the near future.
Ethics approval and consent to participate
Not applicable.
Author contributions
Pattarapol Sittisart participated in the research design, data collection, data analysis, and wrote the manuscript. Kitsakorn Locharoenrat devised the research design and performed the data analysis, research summary and recommendation, as well as wrote the manuscript. Both authors read and approved the final manuscript.
Acknowledgments
The authors thank the Scientific Instrument Center, School of Science, King Mongkut’s Institute of Technology Ladkrabang, Thailand for providing the cancer cell lines.
Disclosure statement
No potential conflict of interest was reported by the author(s).
Data availability statement
The authors confirm that the data supporting the findings of this study are available within the article.
Additional information
Funding
References
- Bakrania A, Zheng G, Bhat M. Nanomedicine in hepatocellular carcinoma: a new frontier in targeted cancer treatment. Pharmaceutics. 2021;14(1):41.
- Kokudo N, Ishizawa T. Fluorescence imaging: treatment of hepatobiliary and pancreatic diseases. Basel: Karger Medical and Scientific; 2013.
- Ishizawa T, Masuda K, Urano Y, et al. Mechanistic background and clinical applications of indocyanine green fluorescence imaging of hepatocellular carcinoma. Ann Surg Oncol. 2014;21(2):440–448.
- Bhavane R, Starosolski Z, Stupin I, et al. NIR-II fluorescence imaging using indocyanine green nanoparticles. Sci Rep. 2015;8:14488.
- Kaibori M, Matsui K, Ishizaki M, et al. Evaluation of fluorescence imaging with indocyanine green in hepatocellular carcinoma. Cancer Imaging. 2016;16:6.
- ZhuGe DL, Wang LF, Chen R, et al. Cross-linked nanoparticles of silk fibroin with proanthocyanidins as a promising vehicle of indocyanine green for photo-thermal therapy of glioma. Artif Cells Nanomed Biotechnol. 2019;47(1):4293–4304.
- Norat P, Soldozt S, Elsarrag M, et al. Application of indocyanine green videoangiography in aneurysm surgery: evidence, techniques, practical tips. Front Surg. 2019;6:34.
- Zhang J, Miao Y, Ni W, et al. Cancer cell membrane coated silica nanoparticles loaded with ICG for tumour specific photothermal therapy of osteosarcoma. Artif Cells Nanomed Biotechnol. 2019;47(1):2298–2305.
- Ogawa A, Nakagawa T, Oda G, et al. Study of the protocol used to evaluate skin-flap perfusion in mastectomy based on the characteristics of indocyanine green. Photodiagnosis Photodyn Ther. 2021;35:102401.
- Shen Y, Zheng M, Li J, et al. Clinical application of indocyanine green fluorescence imaging in the resection of hepatoblastoma: a single institution’s experiences. Front Surg. 2022;9:932721.
- Czerski J, Sarkar SK. Carbon nanomaterials for bioimaging, bioanalysis, and therapy. New York: Wiley; 2018.
- Liu T-M, Conde J, Lipiński T, et al. Revisiting the classification of NIR-absorbing/emitting nanomaterials for in vivo bioapplications. NPG Asia Mater. 2016;8(8):e295–e295.
- Piccolo G, Barabino M, Pesce A, et al. Role of indocyanine green fluorescence imaging in minimally invasive resection of colorectal liver metastases. Surg Laparosc Endosc Percutan Tech. 2022;32(2):259–265.
- Wakabayashi T, Cacciaguerra AB, Abe Y, et al. Indocyanine green fluorescence navigation in liver surgery: a systematic review on dose and timing of administration. Annals Surg. 2022;275(6):1025–1034.
- Zhai Q, Wang Y, Tian A. Severe hemodynamic instability after indocyanine green injection during off-pump coronary artery by-pass grafting: a case report. Med. 2017;96(46):e8766.
- Dou X, Yuan X, Yu Y, et al. Lighting up thiolated Au@Ag nanoclusters via aggregation-induced emission. Nanoscale. 2014;6(1):157–161.
- Sun J, Wu H, Jin Y. Synthesis of thiolated Ag/Au bimetallic nanoclusters exhibiting an anti-galvanic reduction mechanism and composition-dependent fluorescence. Nanoscale. 2014;6(10):5449–5457.
- Chen YJ, Tsai CY, Cheng YM, et al. Impacts of intralipid on nanodrug abraxane therapy and on the innate immune system. Sci Rep. 2020;10(1):2838.
- Pairoj S, Damrongsak P, Damrongsak B, et al. Antitumor activities of carboplatin–doxorubicin–ZnO complexes in different human cancer cell lines (breast, cervix uteri, Colon, liver and oral) under UV exposition. Artif Cells Nanomed Biotech. 2021;49(1):120–135.
- Al-Zebeidi J, Agdi M, Lary S, et al. Effect of empiric intravenous intralipid therapy on pregnancy outcome in women with unexplained recurrent implantation failure undergoing intracytoplasmic sperm injection-embryo transfer cycle: a randomized controlled trial. Gynecol Endocrinol. 2020;36(2):131–134.
- Locharoenrat K. Linear and nonlinear optics: materials, preparations, and properties. Singapore: Pan Stanford, 2021.
- Rammarat E, Kraithong S, Wanichacheva N, et al. Rhodamine 6G and Au–Pd core–shell nanorods: fluorescence enhancement for detection of mercury. Ukr J Phys Opt. 2018;19(4):191–198.
- Asadpour S, Kargozar S, Moradi L, et al. Natural biomacromolecule based composite scaffolds from silk fibroin, gelatin and chitosan toward tissue engineering applications. Int J Biol Macromol. 2020;154:1285–1294.
- van den Bos J, Wieringa FP, Bouvy ND, et al. Optimizing the image of fluorescence cholangiography using ICG: a systematic review and ex vivo experiments. Surg Endosc. 2018;32(12):4820–4832.
- Yaseen MA, Yu J, Wong MS, et al. In-vivo fluorescence imaging of mammalian organs using charge-assembled mesocapsule constructs coating indocyanine green. Opt Express. 2008;16(25):20577–20587.
- Desmettre T, Devoisselle JM, Mordon S. Fluorescence properties and metabolic features of indocyanine green (ICG) as related to angiography. Surv Ophthalmol. 2000;45(1):15–27.
- Tang JC, Partono A, Anvari B. Near-infrared-fluorescent erythrocyte-mimicking particles: physical and optical characteristics. IEEE Trans Biomed Eng. 2019;66(4):1034–1044.
- Fang S, Li C, Lin J, et al. Gold nanorods-based theranostics for simultaneous fluorescence/two photon luminescence imaging and synergistic phototherapies. J Nanomater. 2016;2016:1082746.
- Khan NU, Lin J, Younas MR, et al. Synthesis of gold nanorods and their performance in the field of cancer cell imaging and photothermal therapy. Cancer Nano. 2021;12(1):20.
- Ćwik M, Sulowska K, Buczyńska D, et al. Controlling plasmon propagation and enhancement via reducing agent in wet chemistry synthesized silver nanowires. Opt Express. 2021;29(6):8834–8845.
- Krajnik B, Golacki LW, Fiedorczyk E, et al. Quantitative comparison of luminescence probes for biomedical applications. Methods Appl Fluoresc. 2021;9(4):045001.
- Bardhan R, Grady NK, Halas NJ. Nanoscale control of near-infrared fluorescence enhancement using Au nanoshells. Small. 2008;4(10):1716–1722.
- Goutayer M, Garcia NY. Fluorescent nanoemulsion of indocyanine green. Patent No. 09781822.3 2009.
- Navarro FP, Berger M, Goutayer M, et al. A novel indocyanine green nanoparticle probe for non-invasive fluorescence imaging in vivo. Proc of SPIE. 2009;7190:71900L1–7190010.
- Hao G, Xu ZP, Li L. Manipulating extracellular tumour pH: an effective target for cancer therapy. RSC Adv. 2018;8(39):22182–22192.
- Matur M, Madhyastha H, Shruthi TS, et al. Engineering bioactive surfaces on nanoparticles and their biological interactions. Sci Rep. 2020;10(1):19713.
- Wu N, Tu Y, Fan G, et al. Enhanced photodynamic therapy/photothermo therapy for nasopharyngeal carcinoma via a tumour microenvironment-responsive self-oxygenated drug delivery system. Asian J Phar Sci. 2022;17(2):253–267.