
Abstract
Merkel cell carcinoma (MCC) is a primary cutaneous neoplasm of neuroendocrine carcinoma of the skin, which is characterized by molecular heterogeneity with diverse tumour microenvironment (TME). However, we are still lack knowledge of the cellular states and ecosystems in MCC. Here, we systematically identified and characterized the landscape of cellular states and ecotypes in MCC based on a machine learning framework. We obtained 30 distinct cellular states from 9 immune cell types and investigated the B cell, CD8 T cell, fibroblast, and monocytes/macrophage cellular states in detail. The functional profiling of cellular states were investigated and found the genes highly expressed in cellular states were significantly enriched in immune- and cancer hallmark-related pathways. In addition, four ecotypes were further identified which were with different patient compositions. Transcriptional regulation analysis revealed the critical transcription factors (i.e. E2F1, E2F3 and E2F7), which play important roles in regulating the TME of MCC. In summary, the findings of this study may provide rich knowledge to understand the intrinsic subtypes of MCCs and the pathways involved in distinct subtype oncogenesis, and will further advance the knowledge in developing a specific therapeutic strategy for these MCC subtypes.
Introduction
Merkel cell carcinoma (MCC) is a rare but highly aggressive skin cancer, which has neuroendocrine features and a high local recurrence rate and the potential for distant metastasis [Citation1]. Indeed, MCC is one of the high mortality rate of cancers, with more than one-third of MCC patients dying and is twice as deadly as malignant melanoma [Citation2]. It was discovered that a double-stranded DNA polyomavirus was integrated into the genomes of eight tumour cells in MCCs, suggesting that polyomaviruses are oncogenic [Citation3]. Moreover, it has been shown that the vast majority of MCCs are related to the clonal integration of the Merkel cell polyomavirus (MCPyV), and only a small number of MCCs are due to a large number of mutations caused by prolonged sun exposure, which are known as MCPyV-MCC [Citation3], suggesting that Merkel cell polyomavirus infection was the main risky factor for MCC. Additionally, MCPyV + MCC patients had a three-fold higher survival rate than those with MCPyV- MCC, MCPyV can be used as prognostic factor [Citation4]. Moreover, the tumour immune microenvironment (TME) plays an important role in various types of cancer [Citation5,Citation6], but the in-depth study of TME in MCC is still seriously lacking.
The TME is composed of many different cell types, including B cells, fibroblasts, T cells, and dendritic cells [Citation7]. Thus, it is essential to analyze the different cell types in TME of MCC. Recent studies have demonstrated that MCPyV + MCC has higher immune infiltration [Citation8,Citation9]. Considering the TME of MCC, previous studies mainly focused on the expression of PD-L1 in tumour-infiltrating lymphocytes [Citation8,Citation10], and have shown that significantly different in PD-L1 expression in tumour cells due to the presence of MCPyV [Citation8]. In addition, characterizing the TME of MCC was performed by comparing the expression of important genes. For example, CD200 can promote the development and progression of a variety of cancers [Citation11–13]. In addition, CD200 was frequently and highly expressed in MCC, suggesting that CD200 may be a novel immune target independent of T-cell immune checkpoints [Citation14]. Several lines of evidences suggested several other genes were significantly differently expressed between MCPyV + MCC and MCPyV- MCC [Citation15], including TP53 and RB1. The expressions of these genes were associated with clinical survival of cancer patients [Citation16–18].
Moreover, recent cancer transcriptome analysis has revealed different immune subtypes of cancer [Citation19,Citation20], which extends the conventional cancer classification based on anatomical site of original [Citation21]. Transcriptome-based classifications of tumour subtypes have informed a number of characteristics of clinical patients, including the response to immunotherapy. But it usually oversimplifies the cell types in TME and not considered the cellular states and ecosystems of tumours [Citation22]. Recent developments of single-cell RNA sequencing (scRNA-seq) have enabled comprehensively surveys of TMEs of various tumour types [Citation23]. However, there is still lack of scRNA-seq data for MCC. Recently, Luca, Steen et al. develop the EcoTyper software to deconvolve tumour-microenvironment interactions from high volume bulk transcriptomics data [Citation24]. This tool has been successfully applied in various types of cancer, such as diffuse large B cell lymphoma (DLBCL) [Citation25]. However, the landscape of cellular states and ecosystems in MCC is still unknown.
Here, we comprehensively characterized the cellular states and ecosystems in MCC by EcoTyper, which is a machine learning framework. We resolved the immunophenotype of MCC based on 12 cell types. We obtained the landscape of cellular states and ecotypes, which were enriched the existing immunotypes. In addition, marker genes of cellular states were analyzed to understand the biological pathways affected by each cell state and we revealed the biomarkers of MCC. The potential transcription factors (TFs) that regulating the cellular states were also identified. Together, our comprehensive transcriptome integrative analyses provide a comprehensive atlas of TMEs in MCC and functional characterization of TMEs greatly helps identify biomarkers of MCC.
Materials and methods
Transcriptomes of MCC
We performed a systematic analysis of public gene expression data of Merkel cell carcinoma (MCC). The transcriptomes of MCC patients were downloaded from gene expression omnibus (GEO) under the accession number GSE39612 [Citation16]. The datasets were obtained from the Affymetrix® GPL570 platform (Human Genome U133 Plus 2.0 Array). We downloaded the raw CEL file from GEO, and processed via the robust multiarray averaging (RMA) algorithm implemented in the ‘affy’ package in R program. All probes were mapped to gene symbols by the annotation in ‘hgu133plus2.db’, and the probes that mapped to multiple gene symbols were removed. Finally, there were 20,862 genes remained for further analysis and 74 tumour patients of MCC were considered in this study.
Cell-type specific gene signatures
To obtain the cell-type specific gene expression profiles of MCC patients, we used CIBERSORTx [Citation26] to estimate gene expression profiles and assess the proportion of major cell populations. To conduct a comprehensive analysis of MCC, we applied the signature matrix published in the EcoTyper [Citation22], which contains 12 major cell types. This signature matrix is a combination of two previously published signature matrices: LM22, which includes 22 human immune cell types, and TR4, which includes epithelial, endothelial, immune and fibroblast populations.
To obtain the signature matrix suitable for cell classification, the cell types in the LM22 were mapped into 9 major lineages: B cells, plasma cells (PC), CD8 T cells, CD4 T cells, natural killer (NK) cells, monocytes/macrophages, dendritic cells, mast cells, polymorphonuclear neutrophils (PMNs). Based on the transcriptomes of MCC, we obtained fractional abundance estimates for 12 major cell types. In each sample, the summarized abundances 12 cell types were normalized to 1. Finally, CIBERSORTx was employed to determine gene expression profiles by default parameters.
Discovery of cellular states in MCC
After obtained the cell-type specific gene expression profiles, we employed the machine learning method, EcoTyper, to classify clusters for each cell type. Based on non-negative matrix factorization (NMF) combined with specific heuristics, EcoTyper calculated the generated cell-type specific gene expression profiles to identify and quantify cellular states for each cell type. In the process of calculation, EcoTyper determined the number of cell states for each cell type based on cophenetic coefficient and the cluster number was default ranged from 2 to 20. We selected the cluster number closest to a cophenetic coefficient of 0.99 as the most suitable cluster number in each cell types. Cellular states whose marker genes less than 10 and that likely to be false positives according to false-positive index (AFI) were removed in our analysis.
Profiling of ecosystems in MCC
Equally important, we employed EcoTyper [Citation22] to identify the robust cellular state co-occurrence network terms ecotypes. EcoTyper uses a community identification approach that the pairing co-associations between cell states were maximized while mutual repulsive forces were minimized. In brief, a denote binary matrix with cellular states as rows and samples as columns, if cell state i is assigned to sample j, Ai,j is set 1, otherwise is 0. Next, the Jaccard matrix of paired combinations of all cell states in A was calculated. According to the number of MCC cellular states, a 30*30 Jaccard matrix was generated. After the Jaccard matrix was generated, the hypergeometric test was carried out on pairing cell states (such as s and p), entries in Js,p are set 1 if p is greater than 0.01 and 0 otherwise.
Next, in order to identify ecotypes, ‘hclust’ function in R package stats was used to conduct unsupervised clustering of Jaccard matrix. The optimal number of clustering was determined according to silhouette width maximization. Finally, two ecotypes were obtained in MCC. Cytoscape [Citation27] was then used to generate network diagrams of MCC ecotypes.
Functional analysis of cellular states
To examine functional landscape of cellular states and ecotypes, we performed functional enrichment analysis for marker genes of cellular states and ecotypes obtained from EcoTyper. First, we used ‘clusterProfiler’ [Citation28] package to analyze biological processes in Gene ontology (GO). Only the GO terms with genes ranges from 15 to 500 were considered, the significance thresholds of biological processes were p < 0.01 and adjust p < 0.05. And for each cell state, we show the visualization of top ten biological functions the highest gene counts. The GO terms of ecotypes were clustered based on simplify Enrichment R package [Citation29]. The similarities among GO terms were calculated by the ‘GO_similarity’ function and the cluster results were visualized by ‘simplifyGO’ function.
To analyze the effects of each cellular state on the cancer hallmark pathways and the immune-related pathways, we downloaded the cancer hallmark pathways from MsigDB [Citation30] and the immune-related pathways were downloaded from ImmPort project [Citation31]. We used hypergeometric test to analyze these pathways and we only considered pathways with adjust p < 0.05 as significant. Moreover, we applied the Gene Set Enrichment Analysis (GSEA) to further analyze genes highly expressed in each cellular state [Citation32].
Transcriptional regulation analysis
To determine the transcription factors (TFs) that potentially regulated the highly expressed genes in ecotypes, we performed the transcriptional regulation analysis by the RcisTarget. First, we used Wilcoxon’s rank sum test to obtain the highly expressed genes in each ecotype. The genes with adjusted p-values less than 0.05 were selected as the highly expressed genes in each ecotype, and applied these genes to RcisTarget. We applied the TF binding sites upstream 500 bp of transcription start sites and ‘cistarget’ function was used to analyze with the parameters (nesThreshol = 3, AUC = 3*sd(auc) + mean(auc)). The enriched motifs were ranked based on the normalized enrichment score (NES) and top five were visualized for each ecotype in MCC.
Results
High-throughput cellular states discovery in MCC
We applied EcoTyper to identify cellular states from bulk transcriptome profiles of MCC patients. The default first step of EcoTyper is to estimate gene expression profiles and assess the proportions of major cell populations with CIBERTSORTx. To compare the cellular heterogeneity from 74 MCC patients, the abundance of cell type was used to estimate cell-type specific gene expression profiles of 12 cell types. Next it identified cellular states transcriptionally defined and confirmed robust cellular state co-occurrence that defined the cellular communities ().
Figure 1. The machine learning framework for high-throughput characterization of cellular states and ecosystems in MCC. (A) Overview of the application of EcoTyper to cellular states and ecosystems profiling in MCC. (B) UMAP projection of cellular states across MCC tumour patients. (C) The proportions of patients within different cellular states in each cell type. (D) The sankey diagram showing the relationship of epithelial cellular states, tissue, and merkel cell polyomavirus status.
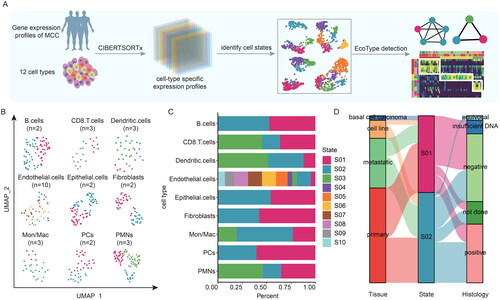
Based on the computational analysis, we found that 74 MCC patients were divided into 9 cellular types, including B cells, CD8 T cells, Dendritic cells, Endothelial cells, Epithelial cells, Fibroblasts, Mon/Mac, PCs, and PMNs. Next, we obtained 30 distinct cellular states from these 9 cell types (). The numbers of cellular states were clearly different, ranging from 2 to 10 in each cell type. Moreover, two or three cellular states were observed in the majority of cell types, but there were ten clusters in Endothelial cells ().
To clearly show the distribution of samples for cellular states in each cell type, we calculated the proportions of patients. We found that the proportions of patients were significantly different in each cellular state (). For example, patients were mainly divided into S01 in the Fibroblasts and PCs, whereas S01 had fewer patients than the other states in Dendritic cells. Recent studies have shown that MCC presents a trilinear different characteristics, concurrenting the expression of B-lymphoid lineage, epithelial and neuroendocrine markers [Citation33]. In most studies it has been pointed out that epithelial stem cells are the most likely cellular origin of MCC [Citation34–36]. For epithelial cells, we obtained two celluar states (). By analysis of the tissue and virus infection status of MCC patients in each cellular state, we found that there were more primary MCC patients in S01, and the majority of patients in S01 were not infected with MCPyV (). Together, these results provided a landscape of cellular states in MCC, which will be a valuable resource for understanding the TME of MCC patients.
B cell and CD8 T cell states in MCC
To further analyze the cellular state profile of MCC, we started with specific cell types. Recent finding indicated that cellular immunity plays a key role in MCC [Citation37]. Meanwhile, increasing evidences have shown that MCCs express the marker genes of early B cell [Citation18,Citation38]. B cells were hypothesized to be the origin cells of MCC by the consistency of early B cell antigen expression in MCC [Citation39]. Therefore, it is vital to delineate the subtypes defined by transcription of these immune cells. For B cells in MCC, we identified two cellular states by EcoTyper (), whereas we obtained three cellular states in CD8 T cells (). We presented the samples information of CD8 T cells and B cells in detail, and found that most cases in S01 of both cell types are primary MCC, and most of them are MCPyV + MCC, this was consistent with the conclusion that MCPyV + MCC patients have better survival ().
Figure 2. The cellular states landscape of B cell and CD8 T cell in MCC. (A-B) Heatmap depicting cellular states of B cells and CD8 T cells identified from MCC bulk transcriptomes. Patient samples are organized by the most prevalent cell states and genes used for identification of the cell states are shown. (A) for two B cell states. (B) for three CD8 T cell states. (C-D) a sankey diagram showed the relationship of cellular states, tissue, and merkel cell polyomavirus status. (C) for B cell states. (D) for CD8 T cell states. (E) Boxplot showing the expressions of WDFY4, CD19, CD38 and MS4A1 in patients within B cell states. (F) Boxplot showing the expressions of IL16, IL2RB, IL18BP and MPEG1 in patients within CD8 T cell states. (G) Barplots showing the enriched functional pathways for genes highly expressed in B cell S01 and CD8 T cell S01.
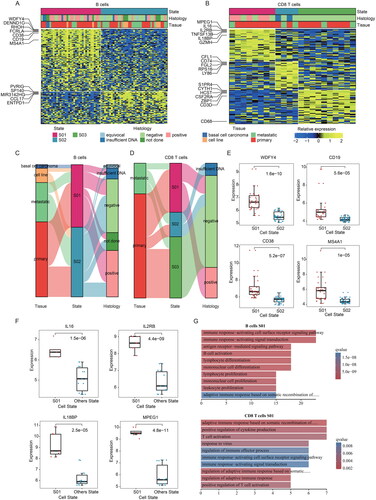
In addition, we found that genes involved in immune response were specifically highly expressed in the corresponding cellular states (). For example, WDFY4, CD38, CD19, MS4A1/CD20 were highly expressed in S01 state of B cells (). WDFY4 plays an important role in cross-presentation in vivo, and is required for antigen processing and presentation and cellular response to virus [Citation40]. Similar to WDFY3, WDFY4 may be involved in the regulation of autophagy, and simultaneously, multiple studies have shown that autophagy was associated with lymphocyte activation, especially in B cells [Citation41]. CD19 is a reliable marker for pre-B cells, and express in most B-cell malignancies [Citation42]. MS4A1/CD20 is a marker gene for B cells and highly expressed in S01 of B cells (), and a recent study had described a subset of CD20+ T cells with immune-regulatory and pro-inflammatory activity [Citation43].
Meanwhile, there are several interleukin-related genes, including IL16, IL2RB, IL18BP, that were significantly highly expressed in S01 of CD8 T cells (). In this cellular state, Macrophage-expressed gene 1 (MPEG1), which was reported to be indispensable for bacterial killing following phagocytosis [Citation44], was also highly expressed (). We next performed functional enrichment analysis on the marker genes of S01 in both B cells and CD8 T cells. We found that they were mainly enriched in the pathways related to immune response (), including response to virus, immune response-activating signal transduction. These results suggested that the marker genes in S01 of both B and CD8 T cells play important roles in MCC.
Fibroblast and monocytes/macrophages cellular states in MCC
Cancer-associated fibroblasts (CAFs) promote cancer development and metastasis [Citation45]. In addition, fibroblasts exhibit a CAF-like phenotype in MCC tumour [Citation46]. Mon/Mac are another important immune cells in TME, which are regarded as tumour-associated macrophages (TAMs) [Citation47]. Emerging studies suggested that TAMs promote tumour growth and subvert anti-tumour immunity [Citation48]. To obtain the phenotypes of fibroblast and Mon/Mac in MCC, we applied EcoTyper to perform in-depth analysis of both cellular types. Two cellular states were identified in fibroblasts (). However, we did not observe an obvious sample concentration trend in cellular states of fibroblasts (). Next, we respectively analyzed the functions of the highly expressed genes in the two cellular states. We found that the highly expressed genes were enriched in similar functions ().
Figure 3. The cellular states landscape of fibroblasts and monocytes/macrophages in MCC. (A) Heatmap depicting fibroblasts cell states identified from MCC bulk transcriptomes. (B) The sankey diagram showed the relationship of fibroblasts cellular states, tissue, and merkel cell polyomavirus status. (C) Barplots showing the enriched functional pathways for genes highly expressed in S01 states and S02 states of fibroblasts. (D) Heatmap depicting Mon/mac cell states identified from MCC bulk transcriptomes. (E) Heatmap showing the expression of the top the most prevalent genes in three Mon/mac cell states.
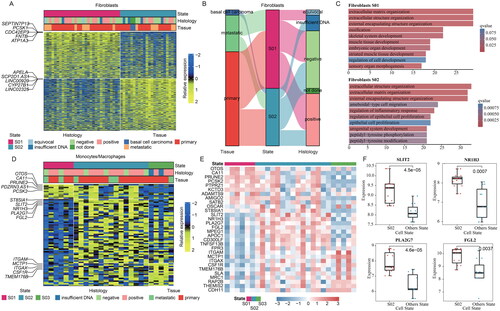
Moreover, we identified three cellular states of Mon/Mac in MCC (). We found different genes that were highly expressed in each cellular state. Thus, we investigated the expression of top ten ranked genes in cellular states of Mon/Mac in detail. We found that the marker genes showed higher expression in the corresponding cellular states (). In addition, we found that SLIT2, NR1H3, PLA2G7, FGL2 were significantly highly expressed in S02 (). SLIT2 plays an antitumor role in a variety of tumours [Citation49] and recent study has shown that SLIT2 regulates antitumor immunity by altering bone marrow-derived macrophages (BMDMs) [Citation50]. PLA2G7, an enzyme with anti-inflammatory and proinflammatory functions, has been reported to have tumour predictive ability in different tumours [Citation51]. NR1H3 was found to be associated with a subclass of macrophages with better survival [Citation52]. Accumulating evidences have indicated high expression of FGL2 is associated with better prognosis [Citation53]. These results suggested that the subtyping of Mon/Mac can identify cancer-related biomarkers in MCC.
Functional profiling of cellular states in MCC
After identifying cellular states and gene expression analysis for key cellular states, we next tried to predict the potential functions of each cellular state. First, we performed functional enrichment analysis for marker genes of cellular states with hypergeometric test. We found that the majority of genes were enriched in the immune-related pathways and cancer hallmark-related pathways (). In particular, the marker genes of S01 in epithelial cells and PMN cells enriched in cancer-related pathways, including apoptosis, notch signalling, epithelial mesenchymal transition (). Several studies have explored that notch signalling regulates tissue development and homeostasis, and was associated with the occurrence and progression of various malignant tumours [Citation54]. Moreover, different degrees of epithelial-mesenchymal transition (EMT) were observed in Merkel cell lines [Citation55].
Figure 4. Comprehensive functional profiling of cellular states in MCC. (A) Circos plot showing the cancer hallmark and immune-related pathways enriched genes highly expressed in cellular states in MCC. The cell states of each cell type are shown on the left and pathways are on the right, widths of the links indicate the proportion of genes enriched in pathways. (B) Scatter plot showing the normalized enrichment scores (NES) of pathways in epithelial cells S01. Pathways are ranked by NES. Colours of dots are corresponding to the p-values. (C) The enrichment score (ES) distribution for the genes differentially expressed in epithelial cells S01 enriched in five pathways. Each line is for a pathway.
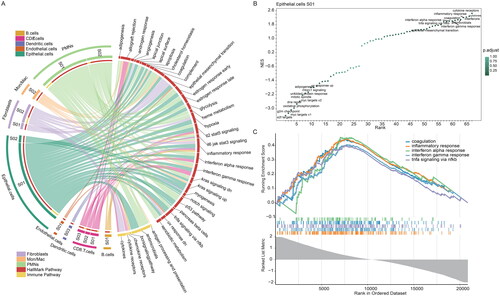
We next conducted an in-depth analysis of epithelial cells S01 and several cancer hallmark-related pathways were found to be significantly enriched in the marker genes of the epithelial S01 (), including coagulation, inflammatory response, interferon alpha response. Several oncogenic pathways, including UV response UP, were mainly enriched in genes with low expression in S01 (). As it has been mentioned above that epithelial stem cells may also be the origin cells of MCC, then these results further demonstrated their functions in MCC. Taken together, the comprehensive functional landscape in MCC was revealed by functional enrichment analysis of marker genes in each cellular state.
Discovery of ecosystems in MCC
TME is a complex system composed of heterogeneous cell types, and plays critical roles in cancer development and progression. Therefore, it is essential to uncover the underlying mechanisms of TME in MCC. We employed EcoTyper to decode the multicellular community ecotypes in MCC, which were considered as ecotypes. It turns out that we decoded four ecotypes (). We next analyzed the composition of ecotypes by cell abundance profiles. We found significant differences in the composition of each ecotype, and the majority of MCC patients were divided into specific ecotypes ().
Figure 5. Landscape of cellular ecosystems in MCC. (A) Cellular state abundance patterns of MCC patients, with cell states organized into four ecotypes and tumour samples (columns) ordered by the most abundant ecotype per sample. (B) The proportions of cell types in four ecotypes in MCC. (C) Sankey diagram showing distribution of cellular states in four ecotypes. (D) Network organization of cellular states in four ecotypes. (E) Sankey diagram showing the relationship of four ecotypes, tissue, and merkel cell polyomavirus status. (F) Molecular characteristics of four ecotypes. The abundance of cell types in four ecotypes (top), the functional pathways of four ecotypes (bottom).
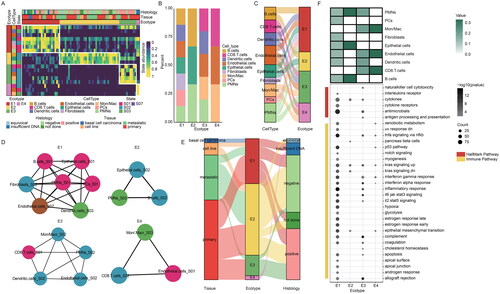
To further explore the differences in cell type composition within each ecotype, we calculated the proportion of cell types for per ecotype. We found that both the type and number of cell types in each ecotype were significantly different (). For example, E1 consisted of seven cell types including fibroblasts and Mon/Mac, whereas E2 and E3 contained only three cell types (). In addition, the composition of cellular states in ecotypes was also significantly different, with each CE containing 3 to 7 cell states ().
Next, we analyzed the characteristics of patients from different ecotypes, and found that most of the patients in E1 were primary MCC, although there was no obvious difference in viral infection (). To better understand the functions of ecotypes, we performed functional enrichment analysis using hypergeometric tests, including immune- and cancer hallmark-related pathways. We found that genes highly expressed in E1 were enriched in several cancer hallmark-related pathways (, i.e. TNFA signalling via NFKB, inflammatory response). Several genes were also significantly enriched in immune-related pathways, including antimicrobials, cytokines, and cytokine receptors, probably because of the influence of B cells (). At the same time, we found that the high expression genes of E4 were only enriched in the cancer-related pathways. These results suggested that genes in each ecotype play different functional landscapes in MCC.
Transcriptional regulation of ecosystems in MCC
We next explored the function of ecotypes in terms of upstream transcriptional regulators in MCC. To achieve this goal, transcriptional regulation analysis was performed based on marker genes of ecotypes. In total, we found several TF regulators were enriched in two ecotypes (). E2F transcription factor family members play critical roles in cell cycle regulation and apoptosis [Citation56]. E2F family genes have increased expression levels in a variety of cancers [Citation57]. We found that the target genes of multiple E2F family genes, including E2F1, E2F3 and E2F7, were significantly enriched in E1 highly expressed genes (). SPI1 is a transcriptional activator that may be specifically involved in the differentiation or activation of macrophages or B cells, the targets of SPI1 were highly expressed E3 gene ().
Figure 6. Transcriptional regulators of ecosystems in MCC. (A-B) Representative TFs potentially regulating the genes highly expressed in corresponding ecotypes. Top five TFs were shown for each ecotype of MCC. (A) for E1 and (B) for E3. (C) Heatmap showing the expressions of TFs across patients within different ecotypes. (D) Boxplots showing the expressions of representative TFs. (E-F) Functional enrichment of the target genes of transcription factors. GO terms were clustered into groups based on gene similarities. (E) for E2 and (F) for E3.
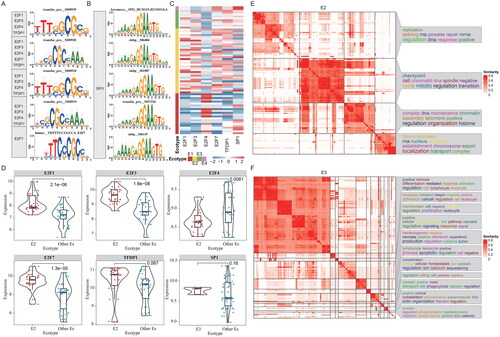
Next, we compared the expression of top five TFs ranked by enrichment scores in each ecotype. We found that these TFs were significantly highly expressed in the corresponding ecotypes (). For example, E2F1, E2F3, E2F4, E2F7, TFDP1 have higher expression levels in E2, and SPI1 is significantly highly expressed in E3 (). Moreover, we performed functional enrichment analysis on the target genes of these transcription factors. For E2 ecotype, we found that genes were mainly enriched in DNA replication and related to regulation pathways (). T cell activation and other immune-related pathways were enriched in the target’s genes of SPI1 in E3 (). These results suggested that TFs play important roles in regulating the genes that functions in different ecotypes of TME in MCC.
Discussion
Merkel cell carcinoma (MCC) is a rare aggressive skin cancer associated with immunosuppression [Citation58]. TMEs play key roles in the occurrence, development, invasion and treatment of cancer [Citation59]. The efficacy of cancer immunotherapy largely depends on the TMEs [Citation60]. Comprehensive analysis of MCC based on TMEs can provide new insights into the clinical diagnosis and treatment of MCC. In this study, we stratified MCC patients according to transcriptome-defined subtypes and cell type-specific gene expression patterns in cancer. We used the machine learning method, EcoTyper, to characterize the TMEs in 74 patients of MCC. In total, we comprehensively identified 30 transcriptome-defined cellular states based on 12 cell types, and four multicellular communities. These cellular states and ecosystems provided valuable resources for characterization of TMEs in MCC.
A number of studies have suggested that MCC can be controlled by the immune system, and the markers of different immune cell types may serve as prognostic factors in patients with MCC [Citation61]. We applied EcoTyper to B cells and CD8 T cells, two important immune cell types, and obtained two B cell states and three CD8 T cell states. We found that the majority of patients in S01 of both cell types had better survival of primary MCC and MCPyV + MCC. Moreover, the results of functional enrichment analysis showed that the marker genes of S01 in both B cells and CD8 T cells were significantly enriched in the pathway related to immune response. By in-depth analysis of the two immune cell types, we found that S01 states of both B cells and CD8 T cells play important roles in MCC.
Cancer-associated fibroblasts (CAFs) and tumour-associated macrophages (TAMs) are important components of tumour microenvironment [Citation62,Citation63], affecting cancer progression and metastasis [Citation64,Citation65]. Therefore, EcoTyper was used to analyze fibroblasts and Mon/Mac. We identified two fibroblast cellular states and three Mon/Mac cellular states. We also found that SLIT2, NR1H3, PLA2G7, FGL2 were significantly highly expressed in Mon/Mac cellular states S02. The results suggested that the Mon/Mac subtype may be a potential prognostic factor for MCC. Functional enrichment analysis revealed that genes highly expressed in cellular states were significantly enriched in the cancer hallmark pathways and immune-related pathways.
Moreover, to systematically analyze the TFs of ecotypes, we conducted transcriptional regulation analysis based on marker genes of each ecotype. We obtained some important TFs, including E2F transcription factor family members (e.g. E2F1, E2F3, E2F7) and SPI1. These results suggested that TFs play important roles in the TME of MCC. In this study, we depicted cellular states and ecotypes based on only 74 MCC patients, and more datasets are needed for validation. Moreover, whether the biomarkers identified from B cells, CD8 T cells, fibroblasts and Mon/Mac can be used as prognostic factors needs to be verificated with relevant clinical data.
In conclusion, we conducted comprehensive analysis of TME in MCC based on the transcriptome and a machine learning framework, providing a new perspective for the clinical diagnosis and treatments of MCC.
Authors’ contribution
PZ and JL proposed and managed the study. SC and SL wrote the manuscript. SC and SL collected the material and performed the bioinformatic analysis. RW and SC provided the explanations of the results. Data analysis consisted of SL, SC and PY. All authors contributed to the article and approved the submitted version.
Acknowledgments
We thank the Hainan Province Clinical Medical Center and Academician Workstation in Hainan Province for their support and assistance with this study.
Disclosure statement
No potential conflict of interest was reported by the author(s). The authors declare that the research was conducted in the absence of any commercial or financial relationships that could be construed as a potential conflict of interest.
Data availability statement
Public gene expression profiles used in this work can be acquired from Gene Expression Omnibus (GEO, http://www.ncbi.nlm.nih.gov/geo/). The datasets used and/or analyzed during the present study are available from the corresponding authors on reasonable request.
Additional information
Funding
References
- Becker JC, Stang A, DeCaprio JA, et al. Merkel cell carcinoma. Nat Rev Dis Primers. 2017;3:17077. doi: 10.1038/nrdp.2017.77.
- DeCaprio JA. Molecular pathogenesis of merkel cell carcinoma. Annu Rev Pathol. 2021;16:69–91. doi: 10.1146/annurev-pathmechdis-012419-032817.
- Feng H, Shuda M, Chang Y, et al. Clonal integration of a polyomavirus in human merkel cell carcinoma. Science. 2008;319(5866):1096–1100. doi: 10.1126/science.1152586.
- Sihto H, Kukko H, Koljonen V, et al. Clinical factors associated with merkel cell polyomavirus infection in merkel cell carcinoma. J Natl Cancer Inst. 2009;101(13):938–945. doi: 10.1093/jnci/djp139.
- Bilotta MT, Antignani A, Fitzgerald DJ. Managing the TME to improve the efficacy of cancer therapy. Front Immunol. 2022;13:954992. doi: 10.3389/fimmu.2022.954992.
- Cerro PA, Mascaraque M, Gallego-Rentero M, et al. Tumor microenvironment in non-melanoma skin cancer resistance to photodynamic therapy. Front Oncol. 2022;12:970279. doi: 10.3389/fonc.2022.970279.
- Quail DF, Joyce JA. Microenvironmental regulation of tumor progression and metastasis. Nat Med. 2013;19(11):1423–1437. doi: 10.1038/nm.3394.
- Lipson EJ, Vincent JG, Loyo M, et al. PD-L1 expression in the merkel cell carcinoma microenvironment: association with inflammation, merkel cell polyomavirus and overall survival. Cancer Immunol Res. 2013;1(1):54–63. doi: 10.1158/2326-6066.CIR-13-0034.
- Walsh NM, Fleming KE, Hanly JG, et al. A morphological and immunophenotypic map of the immune response in merkel cell carcinoma. Hum Pathol. 2016;52:190–196. doi: 10.1016/j.humpath.2016.02.002.
- Feldmeyer L, Hudgens CW, Ray-Lyons G, et al. Density, distribution, and composition of immune infiltrates correlate with survival in merkel cell carcinoma. Clin Cancer Res. 2016;22(22):5553–5563. doi: 10.1158/1078-0432.CCR-16-0392.
- Kretz-Rommel A, Qin F, Dakappagari N, et al. CD200 expression on tumor cells suppresses antitumor immunity: new approaches to cancer immunotherapy. J Immunol. 2007;178(9):5595–5605. doi: 10.4049/jimmunol.178.9.5595.
- Moreaux J, Hose D, Reme T, et al. CD200 is a new prognostic factor in multiple myeloma. Blood. 2006;108(13):4194–4197. doi: 10.1182/blood-2006-06-029355.
- Tonks A, Hills R, White P, et al. CD200 as a prognostic factor in acute myeloid leukaemia. Leukemia. 2007;21(3):566–568. doi: 10.1038/sj.leu.2404559.
- Gaiser MR, Weis C-A, Gaiser T, et al. Merkel cell carcinoma expresses the immunoregulatory ligand CD200 and induces immunosuppressive macrophages and regulatory T cells. Oncoimmunology. 2018;7(5):e1426517. doi: 10.1080/2162402X.2018.1426517.
- Daily K, Coxon A, Williams JS, et al. Assessment of cancer cell line representativeness using microarrays for merkel cell carcinoma. J Invest Dermatol. 2015;135(4):1138–1146. doi: 10.1038/jid.2014.518.
- Harms PW, Patel RM, Verhaegen ME, et al. Distinct gene expression profiles of viral- and nonviral-associated merkel cell carcinoma revealed by transcriptome analysis. J Invest Dermatol. 2013;133(4):936–945. doi: 10.1038/jid.2012.445.
- Waltari M, Sihto H, Kukko H, et al. Association of merkel cell polyomavirus infection with tumor p53, KIT, stem cell factor, PDGFR-alpha and survival in merkel cell carcinoma. Int J Cancer. 2011;129(3):619–628. doi: 10.1002/ijc.25720.
- Bhatia K, Goedert JJ, Modali R, et al. Merkel cell carcinoma subgroups by merkel cell polyomavirus DNA relative abundance and oncogene expression. Int J Cancer. 2010;126(9):2240–2246. doi: 10.1002/ijc.24676.
- Li Y, Jiang T, Zhou W, et al. Pan-cancer characterization of immune-related lncRNAs identifies potential oncogenic biomarkers. Nat Commun. 2020;11(1):1000. doi: 10.1038/s41467-020-14802-2.
- Jiang T, Zhou W, Chang Z, et al. ImmReg: the regulon atlas of immune-related pathways across cancer types. Nucleic Acids Res. 2021;49(21):12106–12118. doi: 10.1093/nar/gkab1041.
- Thorsson V, Gibbs DL, Brown SD, et al. The immune landscape of cancer. Immunity. 2018;48(4):812–830 e14. doi: 10.1016/j.immuni.2018.03.023.
- Luca BA, Steen CB, Matusiak M, et al. Atlas of clinically distinct cell states and ecosystems across human solid tumors. Cell. 2021;184(21):5482–5496 e28. doi: 10.1016/j.cell.2021.09.014.
- Suva ML, Tirosh I. Single-Cell RNA sequencing in cancer: lessons learned and emerging challenges. Mol Cell. 2019;75(1):7–12. doi: 10.1016/j.molcel.2019.05.003.
- Rolong A, Chen B, Lau KS. Deciphering the cancer microenvironment from bulk data with EcoTyper. Cell. 2021;184(21):5306–5308. doi: 10.1016/j.cell.2021.09.028.
- McNally DR, Elemento O, Melnick A. Dissecting bulk transcriptomes of diffuse large B cell lymphoma. Cancer Cell. 2021;39(10):1305–1307. doi: 10.1016/j.ccell.2021.09.006.
- Newman AM, Steen CB, Liu CL, et al. Determining cell type abundance and expression from bulk tissues with digital cytometry. Nat Biotechnol. 2019;37(7):773–782. doi: 10.1038/s41587-019-0114-2.
- Shannon P, Markiel A, Ozier O, et al. Cytoscape: a software environment for integrated models of biomolecular interaction networks. Genome Res. 2003;13(11):2498–2504. doi: 10.1101/gr.1239303.
- Yu G, Wang L-G, Han Y, et al. clusterProfiler: an R package for comparing biological themes among gene clusters. OMICS. 2012;16(5):284–287. doi: 10.1089/omi.2011.0118.
- Gu Z, Hubschmann D. Simplify enrichment: a bioconductor package for clustering and visualizing functional enrichment results. Genom Proteom Bioinform. 2023;21(1):190–202. doi: 10.1016/j.gpb.2022.04.008.
- Liberzon A, Birger C, Thorvaldsdóttir H, et al. The molecular signatures database (MSigDB) hallmark gene set collection. Cell Syst. 2015;1(6):417–425. doi: 10.1016/j.cels.2015.12.004.
- Bhattacharya S, Dunn P, Thomas CG, et al. ImmPort, toward repurposing of open access immunological assay data for translational and clinical research. Sci Data. 2018;5:180015. doi: 10.1038/sdata.2018.15.
- Subramanian A, Tamayo P, Mootha VK, et al. Gene set enrichment analysis: a knowledge-based approach for interpreting genome-wide expression profiles. Proc Natl Acad Sci U S A. 2005;102(43):15545–15550. doi: 10.1073/pnas.0506580102.
- Chteinberg E, Vogt J, Kolarova J, et al. The curious case of merkel cell carcinoma: epigenetic youth and lack of pluripotency. Epigenetics. 2020;15(12):1319–1324. doi: 10.1080/15592294.2020.1773096.
- Kervarrec T, Samimi M, Guyétant S, et al. Histogenesis of merkel cell carcinoma: a comprehensive review. Front Oncol. 2019;9:451. doi: 10.3389/fonc.2019.00451.
- Tilling T, Moll I. Which are the cells of origin in merkel cell carcinoma? J Skin Cancer. 2012;2012:680410. doi: 10.1155/2012/680410.
- Ostrowski SM, Wright MC, Bolock AM, et al. Ectopic Atoh1 expression drives merkel cell production in embryonic, postnatal and adult mouse epidermis. Development. 2015;142(14):2533–2544. doi: 10.1242/dev.123141.
- Samimi M. Immune checkpoint inhibitors and beyond: an overview of immune-based therapies in merkel cell carcinoma. Am J Clin Dermatol. 2019;20(3):391–407. doi: 10.1007/s40257-019-00427-9.
- Sur M, AlArdati H, Ross C, et al. TdT expression in merkel cell carcinoma: potential diagnostic pitfall with blastic hematological malignancies and expanded immunohistochemical analysis. Mod Pathol. 2007;20(11):1113–1120. doi: 10.1038/modpathol.3800936.
- Zur Hausen A, Rennspiess D, Winnepenninckx V, et al. Early B-cell differentiation in merkel cell carcinomas: clues to cellular ancestry. Cancer Res. 2013;73(16):4982–4987. doi: 10.1158/0008-5472.CAN-13-0616.
- Theisen DJ, Davidson JT, Briseño CG, et al. WDFY4 is required for cross-presentation in response to viral and tumor antigens. Science. 2018;362(6415):694–699. doi: 10.1126/science.aat5030.
- Conway KL, Kuballa P, Khor B, et al. ATG5 regulates plasma cell differentiation. Autophagy. 2013;9(4):528–537. doi: 10.4161/auto.23484.
- Kochenderfer JN, Rosenberg SA. Treating B-cell cancer with T cells expressing anti-CD19 chimeric antigen receptors. Nat Rev Clin Oncol. 2013;10(5):267–276. doi: 10.1038/nrclinonc.2013.46.
- Schuh E, Berer K, Mulazzani M, et al. Features of human CD3 + CD20+ T cells. J Immunol. 2016;197(4):1111–1117. doi: 10.4049/jimmunol.1600089.
- Ellett F, Pase L, Hayman JW, et al. mpeg1 promoter transgenes direct macrophage-lineage expression in zebrafish. Blood. 2011;117(4):e49-56–e56. doi: 10.1182/blood-2010-10-314120.
- Kalluri R. The biology and function of fibroblasts in cancer. Nat Rev Cancer. 2016;16(9):582–598. doi: 10.1038/nrc.2016.73.
- Fan K, Spassova I, Gravemeyer J, et al. Merkel cell carcinoma-derived exosome-shuttle miR-375 induces fibroblast polarization by inhibition of RBPJ and p53. Oncogene. 2021;40(5):980–996. doi: 10.1038/s41388-020-01576-6.
- Noy R, Pollard JW. Tumor-associated macrophages: from mechanisms to therapy. Immunity. 2014;41(1):49–61. doi: 10.1016/j.immuni.2014.06.010.
- DeNardo DG, Ruffell B. Macrophages as regulators of tumour immunity and immunotherapy. Nat Rev Immunol. 2019;19(6):369–382. doi: 10.1038/s41577-019-0127-6.
- Qiu H, et al. SLIT2 is epigenetically silenced in ovarian cancers and suppresses growth when activated. Asian Pac J Cancer Prev. 2011;12(3):791–795.
- Kaul K, Benej M, Mishra S, et al. Slit2-mediated metabolic reprogramming in bone marrow-derived macrophages enhances antitumor immunity. Front Immunol. 2021;12:753477. doi: 10.3389/fimmu.2021.753477.
- Morigny P, Kaltenecker D, Zuber J, et al. Association of circulating PLA2G7 levels with cancer cachexia and assessment of darapladib as a therapy. J Cachexia Sarcopenia Muscle. 2021;12(5):1333–1351. doi: 10.1002/jcsm.12758.
- Vegliante MC, Mazzara S, Zaccaria GM, et al. NR1H3 (LXRalpha) is associated with pro-inflammatory macrophages, predicts survival and suggests potential therapeutic rationales in diffuse large b-cell lymphoma. Hematol Oncol. 2022;40(5):864–875. doi: 10.1002/hon.3050.
- Yuan K, Feng Y, Wang H, et al. FGL2 is positively correlated with enhanced antitumor responses mediated by T cells in lung adenocarcinoma. PeerJ. 2020;8:e8654. doi: 10.7717/peerj.8654.
- Nowell CS, Radtke F. Notch as a tumour suppressor. Nat Rev Cancer. 2017;17(3):145–159. doi: 10.1038/nrc.2016.145.
- Gravemeyer J, Lange A, Ritter C, et al. Classical and variant merkel cell carcinoma cell lines display different degrees of neuroendocrine differentiation and epithelial-mesenchymal transition. J Invest Dermatol. 2021;141(7):1675–1686 e4. doi: 10.1016/j.jid.2021.01.012.
- Ertosun MG, Hapil FZ, Osman Nidai O. E2F1 transcription factor and its impact on growth factor and cytokine signaling. Cytokine Growth Factor Rev. 2016;31:17–25. doi: 10.1016/j.cytogfr.2016.02.001.
- Kent LN, Bae S, Tsai S-Y, et al. Dosage-dependent copy number gains in E2f1 and E2f3 drive hepatocellular carcinoma. J Clin Invest. 2017;127(3):830–842. doi: 10.1172/JCI87583.
- Harms PW, Harms KL, Moore PS, et al. The biology and treatment of merkel cell carcinoma: current understanding and research priorities. Nat Rev Clin Oncol. 2018;15(12):763–776. doi: 10.1038/s41571-018-0103-2.
- Yuan X, Wang J, Huang Y, et al. Single-cell profiling to explore immunological heterogeneity of tumor microenvironment in breast cancer. Front Immunol. 2021;12:643692. doi: 10.3389/fimmu.2021.643692.
- Ma J, Huang L, Hu D, et al. The role of the tumor microbe microenvironment in the tumor immune microenvironment: bystander, activator, or inhibitor? J Exp Clin Cancer Res. 2021;40(1):327. doi: 10.1186/s13046-021-02128-w.
- Engels EA, Frisch M, Goedert JJ, et al. Merkel cell carcinoma and HIV infection. Lancet. 2002;359(9305):497–498. doi: 10.1016/S0140-6736(02)07668-7.
- Mao X, Xu J, Wang W, et al. Crosstalk between cancer-associated fibroblasts and immune cells in the tumor microenvironment: new findings and future perspectives. Mol Cancer. 2021;20(1):131. doi: 10.1186/s12943-021-01428-1.
- Xiang X, et al. Targeting tumor-associated macrophages to synergize tumor immunotherapy. Signal Transduct Target Ther. 2021;6(1):75.
- Chen D, Zhang X, Li Z, et al. Metabolic regulatory crosstalk between tumor microenvironment and tumor-associated macrophages. Theranostics. 2021;11(3):1016–1030. doi: 10.7150/thno.51777.
- Biffi G, Tuveson DA. Diversity and biology of cancer-associated fibroblasts. Physiol Rev. 2021;101(1):147–176. doi: 10.1152/physrev.00048.2019.