
 ?Mathematical formulae have been encoded as MathML and are displayed in this HTML version using MathJax in order to improve their display. Uncheck the box to turn MathJax off. This feature requires Javascript. Click on a formula to zoom.
Abstract
Perturbation of transcriptome in viral infection patients is a recurrent theme impacting symptoms and mortality, yet a detailed understanding of pertinent transcriptome and identification of robust biomarkers is not complete. In this study, we manually collected 23 datasets related to 6,197 blood transcriptomes across 16 types of respiratory virus infections. We applied a comprehensive systems biology approach starting with whole-blood transcriptomes combined with multilevel bioinformatics analyses to characterize the expression, functional pathways, and protein-protein interaction (PPI) networks to identify robust biomarkers and disease comorbidities. Robust gene markers of infection with different viruses were identified, which can accurately classify the normal and infected patients in train and validation cohorts. The biological processes (BP) of different viruses showed great similarity and enriched in infection and immune response pathways. Network-based analyses revealed that a variety of viral infections were associated with nervous system diseases, neoplasms and metabolic diseases, and significantly correlated with brain tissues. In summary, our manually collected transcriptomes and comprehensive analyses reveal key molecular markers and disease comorbidities in the process of viral infection, which could provide a valuable theoretical basis for the prevention of subsequent public health events for respiratory virus infections.
Introduction
Emerging infectious diseases are one of the serious public health challenges of the twenty-first century. In particular, disease syndromes caused by viruses in humans may develop into large-scale epidemics or global epidemics. Viruses bring enormous mortality, morbidity and economic burden to humans [Citation1]. Respiratory virus infection is one of the major infectious diseases threatening human health. About 80% of respiratory infections are caused by viruses [Citation2]. Over the past two decades, such emergent events have been numerous and varied. Such as Severe Acute Respiratory Syndrome Coronavirus (SARS), H1N1 Influenza, Middle East respiratory syndrome (MERS) and Severe Acute Respiratory Syndrome Coronavirus 2 (SARS-CoV-2).
Previous transcriptome studies have been conducted in the treatment of viral infections and diseases. For example, previous study has investigated the molecular basis of hepatitis B virus-associated acute chronic liver failure (HBV-ACLF) by transcriptome, transcriptome analysis emphasized that the immune metabolism disorder caused by HBV exacerbation is the potential mechanism of HBV-ACLF [Citation3]. Cellular indexing of the transcriptome and T-cell receptor sequencing were combined using spectral flow cytometry. Adamo et al. performed longitudinal profiling of SARS-CoV-2-specific CD8+ T cells in COVID-19 patients from acute infection to 1 year of recovery and identified a signature that recognizes long-lived memory CD8+ T cells [Citation4]. Mahmud et al. rapid response to SARS-CoV-2 by developing immunoepitope-based therapies [Citation5]. Existing drug compounds and SARS-CoV-2 protein sequences were identified for the treatment of COVID-19 by the drug-target interaction prediction method PreDTI [Citation6]. Several studies identified hub genes in disease by constructing PPI [Citation7–9], and developing biosensors for early disease detection [Citation10]. There are also some similarities between different viral infections; however, the integration of multiple viral large-scale transcriptomes has not been studied.
Among patients with chronic kidney disease, those with end-stage renal disease have a higher risk of in-hospital death from COVID-19 [Citation11]. COVID-19 is associated with increased elevated D-dimer levels, thrombotic strength and hyperfibrinogen [Citation12]. Influenza infection could trigger an episode of systemic lupus erythematosus [Citation13]. Transcriptomic analysis was performed to detect common pathways and molecular biomarkers in idiopathic pulmonary fibrosis (IPF), chronic obstructive pulmonary disease (COPD), and COVID-19 to understand the association of SARS-CoV-2 with patients with IPF and COPD [Citation14]. Meantime, SARS-CoV-2 infection had significant responses to human lung epithelial cells and PAH lungs, and was associated with inflammation [Citation15]. The synergistic effect of SARS-CoV-2 on patients with IPF was determined by transcriptomic analysis of patients with SARS-CoV-2 infection and IPF in lung epithelial cell datasets [Citation16,Citation17]. Meantime, previous studies have shown that either influenza or SARS-COV-2 is related to the central nervous system [Citation18], neoplasms [Citation19] and immune-related [Citation20] diseases. Also, most viruses affect tissues such as those from the brain [Citation21], spleen [Citation22] and liver [Citation23]. At the same time, some patients with viral infections will suffer from Alzheimer’s disease [Citation24], cardiovascular disease [Citation25] and other diseases. The transcriptome can well describe the process of viral infection, and identify the expression of altered genes associated with viral infection. Systematically analyze the correlation of viral infections with human complex diseases, which is helpful to find the complications of viral infection, and is of great significance for the treatment of diseases.
To address these questions, we manually curated 6197 blood transcriptomes from 23 studies across a total of 16 respiratory infection viruses. Based on the clinical information of the samples and comprehensive bioinformatics analyses (Figure S1), the molecular markers of the corresponding viruses were identified. These samples are all derived from whole blood or peripheral blood mononuclear cells. They cover patients from different countries, age ranges, and clinical phenotypes, allowing for a comprehensive representation of different patients and viral genetic backgrounds. Since these datasets were derived from different platforms for microarray and RNA sequencing, we considered technical heterogeneity in our analysis. In addition, we identified the robust gene biomarkers that showed transcriptome perturbations in larger number of conditions. Functional analysis revealed that viral infection-related genes were significantly enriched in infection and immune response pathways. Subsequently, based on network proximity analysis, we revealed a comprehensive landscape of the associations among 16 viral infections and 299 complex diseases. Our studies provided valuable resources for viral infections and revealed the robust gene biomarkers, providing novel insights into clinical therapy of viral infections.
Materials and methods
Manually collection of viral infection-related transcriptomes
First, we collected gene expression profiles of 6197 blood transcriptomes of viral infected patients from 23 independent published studies of Gene Expression Omnibus (GEO), ArrayExpress, European Genome-phenome Archive (EGA) and BioSample (Table S1). These datasets were used as discovery cohorts. Most datasets of the microarray were retrieved from different platforms. We downloaded the series matrix TXT files of 20 GEO datasets. Data preprocessing with ‘GEOquery’ [Citation26] in R program was used to extract the probe ID and gene symbols and then merged the probe information. If a gene maps to multiple probe information, the average expression was taken; if a probe maps to multiple genes, the probe was deleted.
There were four datasets (EGAS00001004503, PRJNA507472, GSE152418 and GSE157103) from the RNA-seq platform, including 268 samples. To obtain the gene expression profile in these cohorts, we downloaded the latest GRCh38 genome annotation file from GENCODE [Citation27]. Low-quality sequences were trimmed using ‘Trimmomatic-0.39’ [Citation28] to increase the quality of Fastq files. Moreover, we used ‘hisat2’ software to map the original sequence to the reference genome of GRCh38 and splicing; used ‘samtools’ for sorting conversion [Citation29] and ‘stringtie’ was employed to reconstruct the transcripts and estimate gene expression levels. Finally, we used ‘ballgown’ to combine the expression values. The expression of protein-coding genes was assessed using Fragments Per Kilobase of exon model Per Million mapped reads (FPKM).
Moreover, genes with expression levels =0 in > 70% of samples were excluded from our analysis. In total, the large-scale transcriptomes of 26,234 genes across 5627 samples remained. In addition, 12 additional datasets including 1438 samples were used as the validation cohorts (Table S1).
Identification of viral infection-related genes
There were seventeen of the 23 discovery cohorts measured the transcriptomes between healthy people and infected patients. Differential expression analysis was performed in each viral infection cohort, using healthy people as controls, the DEGs were identified by t-test, and BH correction was performed. Protein coding genes with FDR < 0.01 and FDR < 0.05 thresholds were obtained as DEGs. Among the Rhinovirus, RSV, and Influenza viruses with multiple datasets, we extracted genes that were significantly different in most datasets for analysis.
Dynamic transcriptome analysis during viral infections
Among the collected transcriptomes, there were four datasets (E − MTAB − 5195, GSE101702, GSE157103 and EGAS00001004503) including patients in different infection stages, including normal samples, moderator infected patients and severely infected patients. Two datasets (GSE111368 and GSE152418) included patients during four stages, including normal samples, moderately infected samples, severely infected samples and critically infected samples. To identify protein-coding genes that were dynamically altered during viral infections, we employed the fold change method to calculate the change in expression multiplicity between each disease stage and the previous stage. In this study, genes with FC > 1.1 were defined as up-regulated genes (U) and genes with FC < 1/1.1 as down-regulated genes (D), the other genes were defined as a state of unchanged expression (N). A total of 9 expression patterns were identified in the dataset of virus infection divided into three stages; 27 expression patterns were identified in the data set of virus infection divided into four stages. Genes with different expression pattern clusters were visualized using the ‘Mfuzz’ package [Citation30] in Bioconductor.
Classification of viral-infection patients
In order to verify whether the robust gene markers identified in this study can accurately distinguish infected patients from normal controls. We extracted the expression values of virus-infected markers in the corresponding data sets, performed characteristic curve analysis of virus-infected markers in multiple data sets through the ‘pROC’ [Citation31] package and validated them through independent datasets as the validation cohorts. Independent datasets (GSE53543, GSE71766 and GSE103166) were associated with Rhinovirus infection; GSE80179, GSE105450 and GSE188427 were associated with Respiratory Syncytial Virus (RSV) infection; GSE71766, GSE100160 and GSE166545 were associated with Influenza infection; PRJEB43380, GSE177477 and GSE195894 were associated with SARS-CoV-2 infection.
Viral infection-related PPI network
To further investigate the function of viral infection-related gene markers in the human PPI network, we first collected human protein interaction data from the Human Protein Reference Database (HPRD) [Citation32], which included 8797 human proteins with a total of 33,976 PPIs. We then mapped the DEGs (FDR < 0.01) in 16 viral infections to the HPRD network to extract the interactions between proteins associated with viral infection. Network visualization was performed using Cytoscape [Citation33] software.
Topological characteristics of proteins
We use the ‘igraph’ [Citation34] package to calculate the topological characteristics of proteins. Here, human PPIs were obtained from HPRD. Degree, betweenness, and closeness of each protein were calculated. Next, we compared the topological characteristics of viral interaction proteins with other proteins by Wilcoxon’s rank-sum test. Then, we compared the topological characteristics of proteins interacting with multiple viruses with those interacting with a single virus using Wilcoxon’s rank-sum test.
Functional enrichment analysis
We used the ‘org.Hs.eg.db’ and ‘clusterProfiler’ [Citation35] R packages to perform BP enrichment analysis on DEGs (FDR < 0.01) of 15 viral infections except for the SARS-CoV-2. After filtering out all viruses GeneRatio < 0.01 and p < 0.001, we got 53 common functions of viral infection. At the same time, Metascape [Citation36] was used for GO functional enrichment analysis of the sub-network genes projected by 16 viruses into the HPRD network. The ‘annotation’ app in Cytoscape software was used to cluster and visualize the enriched BP results of SARS-CoV-2.
Functional similarity of viral infections
The Jaccard index, also known as the Jaccard similarity coefficient, is used to compare similarities and differences between finite sets of samples. We used the Jaccard index to assess the similarity of different virus-related genes and enriched BP. The Jaccard similarity coefficient of two sets A and B is defined as the size of the intersection between the two sets divided by the size of the union for the two sets [Citation37]. The larger the Jaccard value, the higher the similarity.
where sets
and
were respectively defined as encoding genes linked to the different virus infections, to judge the similarity of the gene between different viruses (ordinate). At the same time, sets
and
were defined as BP functions related to different virus infections, respectively, to judge the similarity between different virus infection-related functions (abscissa). The ‘ggplot2’ R package was utilized for visualization.
Tissue enrichment analysis of viral infections
Emerging studies have revealed the relationship between disease-disease through the Human Interaction Group [Citation38]. The similarity between disease-related genes and viral infections can be assessed based on the overlap between networks. If two disease modules overlap, local disturbances in one disease may disrupt pathways involved in the other disease module, thereby sharing clinical features.
To reveal the relationships between human tissue and viral infections, we obtained the genes associated with 34 tissues from one of our recent studies [Citation39]. We evaluated the overlap between tissue-associated proteins and the host protein targets (FDR < 0.01) in each virus based on the network. We calculated the metric, which
showed a network-based overlap between proteins associated with tissue
and the viral targets
The formula for calculated
was as follows:
where
compares the shortest average distance between proteins within viral infection-related proteins
or tissue proteins
to the average shortest distances
between proteins encoded by viral infection-related genes and tissue proteins. When
there was no direct overlap between the tissue-associated protein and the virus target.
When
there was a strong correlation between the virus and the tissue. Here, the human PPIs were obtained from PCNet [Citation40], including 2,724,723 interactions between 19,779 proteins.
We then used ‘pubmedR’ package to search and collate the literature between relevant tissues and viral infections. Among them, tissue-virus relationships were identified and validated by the Multi-omics Portal of Viral Infection (MVIP) database [Citation41]. The virus-disease relationship was visualized using the ‘ggplot2’ and ‘ragg’ packages.
Disease comorbidities based on network analysis
In the same way, to reveal the relationships between human complex diseases and viral infections, we first collected disease-related genes from the recent literature [Citation42]. 299 human complex diseases share 3173 genes, which are further clustered into 10 clusters [Citation38]. Next, we sequentially evaluated the network-based overlap between the host protein targets (FDR < 0.01) of each virus extracted and these 299 disease-related genes. We calculated the metric, which
showed a network-based overlap between proteins associated with disease
and the viral targets
The formula for calculated
was as follows:
where
compares the shortest average distance between proteins within viral infection-related proteins
or diseases proteins
to the average shortest distances
between proteins encoded by viral infection-related genes and disease proteins. When
there was no direct overlap between the disease-associated protein and the virus target. When
there was a strong correlation between the virus and the disease.
Results
Large-scale transcriptome landscape of viral infections
To systematically investigate the correlation between respiratory tract infection viruses and virus-infected patients, we extracted target proteins of different viruses from blood transcriptome samples of 6197 patients from 23 public datasets (). We defined a patient who was infected with two viruses as a newly viral-infected patient. After preprocessing of all samples, we obtained 5627 viral-infected samples (Table S1). There were 17 of the 23 datasets studied for healthy people and virus-infected patients, mainly Influenza, Rhinovirus and RSV. We obtained a total of 26,088 DEGs (FDR < 0.05, t-test) for each viral infection by differential expression analysis from each cohort, using healthy individuals as controls.
Figure 1. Large-scale transcriptome analyses reveal viral infection-related genes. (A) Number of DEGs of viral infections in the corresponding dataset. The heatmap shows the number of differential genes identified from different datasets, and the bar chart shows the number of samples in the control and virus-infected groups in each cohort. (B) Heatmap showing the expression profile of Rhinovirus markers in different datasets. (C) Heatmap showing the expression profile of RSV markers in different datasets. (D) Heatmap showing the expression profile of Influenza markers in different datasets.
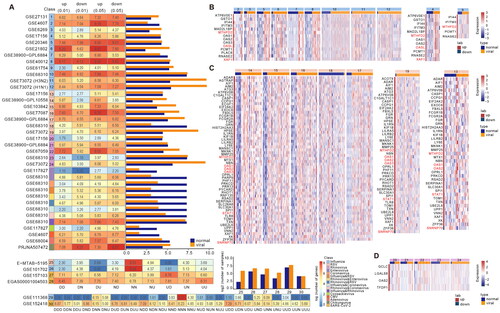
There were six datasets for three viruses containing healthy samples and patients infected at different stages. We identified 9 expression patterns of viral infections based on sample information from three infection states in four datasets (Figure S3). The 27 expression patterns of virus infection were identified based on the sample information in four infection states of two datasets, among which 27 expression patterns of SARS-CoV-2 were visualized (Figure S4). To make the identified markers robust, we screened 10,466 genes with expression that were consistently up-regulated or down-regulated during viral infection (UUU, DDD, UU, and DD).
A total of 8360 (Figure S2, FDR < 0.01, t-test) and 26,088 (FDR < 0.05, t-test) differential genes were identified in 17 discovery cohorts (). Among them, more than half of the differential genes were identified in influenza virus infection, which may be caused by more influenza virus discovery cohorts. Among the 9 expression patterns, 9917 genes of SARS-CoV-2 were continuously up-regulated and down-regulated during the viral infection stage (Figure S3). In addition, among the 27 expression patterns, 1255 genes were continuously up-regulated and down-regulated during infection (Figure S4). We extracted the continuously up-regulated and down-regulated genes in both GSE157103 and EGAS00001004503 cohorts, as well as the continuously up-regulated and down-regulated genes in GSE152418 cohort, and a total of 1820 genes were used for subsequent analysis.
How to effectively identify virus gene markers with multiple datasets was the next primary problem to be solved. First, we calculated the number of datasets that each gene identified in different cohorts of Rhinovirus, RSV and Influenza virus. Because of the heterogeneity among samples of different cohorts, we extracted the genes identified in more than half of the cohorts and considered them as robust gene markers of viral infection. In 12 Influenza cohorts, there were 15,532 DEGs (FDR < 0.01, t-test), but only 14 up-regulated genes were found in more than 6 cohorts. Most of the markers were present in 7 cohorts, and MTHFD2 and OASL were present in 8 cohorts (Figure S5(A)). Meantime, we visualized the expression levels of the identified markers and found that the markers could distinguish virus-infected samples from normal controls (). MTHFD2 is a metabolic checkpoint that controls effectors and regulates T-cell fate and function [Citation43]. OASL is a unique member of the OAS family, lacking enzymatic activity but with a C-terminal domain that shares homology with ubiquinone [Citation44]. Among the 7 cohorts of RSV, 4790 DEGs (FDR < 0.01, t-test) were identified and 58 genes were identified in more than three cohorts. Most of the gene markers were presented in 4 cohorts and STAT1 was presented in 5 cohorts and SNRNP70 was the only down-regulated marker (Figure S5(B)). Most evidence suggests that STAT1 activation acts as a tumour suppressor in cancer cells. However, some experimental and clinical findings suggest that STAT1 also has tumour promoter effects under certain conditions [Citation45]. SNRNP70 is a component of the U1 small nuclear ribonucleoprotein (snRNP) complex [Citation46] (). A total of 3285 DEGs (FDR < 0.01, t-test) were identified in the 5 cohorts of rhinovirus, but only four up-regulated markers, GCLC, LGALS8, OAS2 and TFDP1, were present in all three cohorts (Figure S5(C)). Glutamylcysteine ligase (GCLC) is essential for the antioxidant capacity of cells, and GCLC expression has been implicated in cancer development [Citation47]. Galectin-8 (LGALS8) is a novel factor that regulates neutrophil function associated with transendothelial migration and microbial killing [Citation48]. The 2 '-5′ oligoadenylate synthetase (OAS) family includes interferon-induced antiviral enzymes responsible for the destabilization of virus-derived dsRNA with RNase L function [Citation44]. TFDP1 is a factor regulating the proliferation, apoptosis and differentiation of myeloid cells [Citation49] ().
We found the antiviral interferon-stimulated gene (ISG) OAS2 in the molecular markers of all three viruses mentioned above. At the same time, relevant literature confirmed that OAS2 was up-regulated in the three viruses studied. Zhou et al. showed that OAS3 outperforms OAS1 and OAS2 to significantly inhibit EV71 replication in vitro. And showed that OAS3 could inhibit not only EV71, but also Enterovirus and Coxsackievirus subtypes [Citation50]. Studies by Garcia-Castillo et al. showed increased expression of OAS1 and OAS2, consistent with enhanced RSV clearance [Citation51]. The study by Zhao et al. defined microRNA-340 (miR340) as a repressor of OAS2 and found that miR340 was down-regulated after infection with influenza A virus and other RNA viruses [Citation52]. McDonald et al. found that OAS3 was frequently expressed after RSV infection but had no specified function in RSV control [Citation53]. OAS2 played an important role in airway epithelial cells infected with different subtypes of influenza A virus [Citation54]. And the expression of antiviral signalling molecule OAS1 increased after influenza virus infection [Citation55]. Furthermore, we also found that the tumour suppressor XAF1 was up-regulated in the Influenza analysis [Citation56] (). These results indicated that the antiviral genes OAS1, OAS2 and OAS3 play an important role in the process of virus infection, which also indicated that the identified markers were representative to some extent. We also found that MTHFD2 [Citation43], a metabolic checkpoint that controls effectors and regulates T cell fate and function, was up-regulated during RSV and Influenza infection.
Classification of viral infections based on robust gene biomarkers
Most studies of viral infections have identified clinical indicators, but still lack molecular indicators. To identify whether the identified robust gene markers can accurately distinguish infected patients from normal controls, we performed receiver operating characteristic (ROC) curves analysis based on the expressions of the above gene markers. Genes that were consistently up-regulated and down-regulated during SARS-COV-2 infection had AUC > 0.5 in all three initial collection discovery cohorts and even a higher AUC = 0.83 in the GSE152418 cohort (). Meanwhile, almost all the markers identified during Rhinovirus infection had AUC > 0.72 in the 5 discovery cohorts (), indicating that the gene markers we identified were very representative. The markers in the process of RSV infection could effectively distinguish normal and virus-infected samples (). Notably, the markers identified during Influenza infection had AUC = 1 in both discovery cohorts (), indicating good robustness of the markers we extracted.
Figure 2. Classification of viral infection based on robust gene biomarkers. (A) ROC curves of SARS-COV-2 molecular markers in different datasets. (B) ROC curves of Rhinovirus molecular markers in different datasets. (C) ROC curves of RSV molecular markers in different datasets. (D) ROC curves of Influenza molecular markers in different datasets. (E-H) ROC curves of corresponding viral molecular markers in the validation dataset.
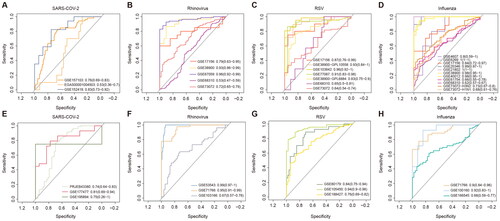
Subsequently, to assess the robustness of the gene markers, we additionally extracted 12 virus-related public datasets from the GEO and BioSample databases as validation cohorts (Table S1). The accuracy of SARS-COV-2 GENE markers in the 3 validation cohorts was almost the same as those in the discovery cohorts (). Rhinovirus markers had a prediction accuracy of 0.99 in the validation cohort (). RSV markers were as predictive in the validation cohorts as in the discovery cohorts (). Although the prediction accuracy of Influenza markers in the verification cohorts was not as accurate as that of the discovery cohorts, it could still accurately classify the virus infection samples (). All these results suggested that the gene markers we identified were robust and could effectively distinguish normal and viral infection samples.
To determine the correlation between different features for the applied datasets. We analyzed gene co-expression in different datasets using Pearson correlation coefficient. This analysis has measured how strongly one feature implies the other. In the training cohorts and the verification cohorts, we separately extracted related gene pairs with Pearson correlation coefficient >0.8 and P value <0.0001, and found that GCLC and TFDP1 were the most correlated (PCCs: 0.89, P: 2.54E-21) in the Rhinovirus cohort. In the Influenza, there were 55 co-expressed gene pairs in 14 biomarkers in the training cohort. IFI44 and XAF1 co-expressed gene pairs and OAS2 and XAF1 co-expressed gene pairs in nine cohorts (Figure S6(A)). And in the validation cohort, there were 26 co-expressed gene pairs, of which 58% were strongly correlated across all three datasets (Figure S6(B)). There were 388 co-expressed gene pairs in 55 biomarkers in the RSV training cohort. OAS1 and OAS2 co-expressed gene pairs and STAT1 and UBE2L6 co-expressed gene pairs in seven cohorts (Figure S6(C)). Meantime, in the validation cohort, there were 657 co-expressed gene pairs (Figure S6(D)). Interesting, there were 9215 co-expressed gene pairs in 1040 biomarkers in the SARS-COV-2 training cohort (PCCs >0.9 and p value <0.0001). So we extracted gene pairs that were correlated across two or three datasets and remained 442 co-expressed gene pairs (Figure S6(E)). And in the validation cohort, there were 200 co-expressed gene pairs but except for PF4 and PF4V1 gene pairs co-expressed in two datasets, other gene pairs were co-expressed in a single dataset (Figure S6(F)). These results indicate that there was a strong correlation between genes and genes in our different datasets.
Network analysis of viral infection-related genes
Increasing evidence of cell-to-cell signalling interactions suggests that signal transduction is a network of interconnected pathways rather than a series of linear pathways that are unrelated to each other [Citation57]. The interactions associated with viral infection can mediate functions related to host immunity. Therefore, we mapped the target genes of 16 viruses into the HPRD to identify molecular signatures of different viruses through the sub-networks. We obtained a protein interaction network associated with viral infection, involving 3479 proteins and 9465 pairs of interaction relationships (Figure S7). We found 2339 proteins were specifically associated with viral infections and 1140 proteins were differentially expressed in multiple viral infections. Subsequently, we extracted the localization of the four viral markers in 16 viral infection-related interaction networks. A sub-network containing 406 proteins and 470 interacting pairs was obtained for display (). There were 167 proteins associated with two viruses, 59 proteins associated with three viruses, and 12 proteins associated with four viruses. In the sub-network, MFN2 and RPS6KA5 were associated with five viruses, and CRIP1 was even associated with six viruses. CRIP1(cysteine-rich intestinal protein 1) has been found in several tumours [Citation58]. It was differentially expressed by multiple viruses in the interaction network we obtained, suggesting that viral infection may trigger a series of disease comorbidities.
Figure 3. Network analysis of respiratory infection viruses-related genes. (A) Protein interactions of four of 16 viral proteins in the HPRD network. The colours of the nodes represent different viruses, including nodes that are associated with multiple viruses. The size of the node is proportional to the number of viruses associated. (B-D) Topological properties of the viral infection-related genes and others in the PPI network. (E-G) Topological properties of genes associated with multiple virus infections and genes associated with single virus infections.
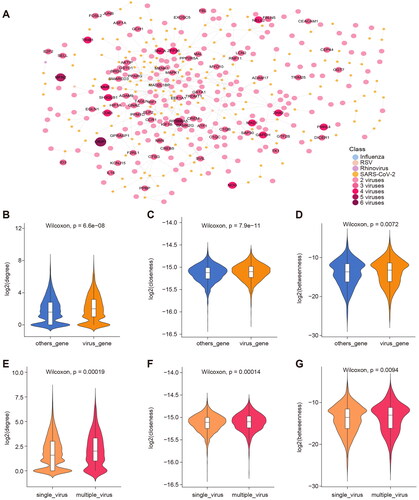
Previous studies on biological networks of multiple species have confirmed the structure of protein interaction networks and found that all known protein networks are scale-free, which means that only a small number of central proteins participate in more interactions in biological networks, while most proteins only have fewer interactions [Citation59]. The function of proteins can also be reflected by their position in the human PPI network [Citation60,Citation61]. We divided all proteins in the PPI network into two groups: the coding proteins associated with viral infection and other proteins, and found that the degree, closeness and betweenness (, all Wilcoxon p-values < 0.01) of viral infection-related proteins in the PPI network were significantly higher than other proteins. These metrics indicate that the network nodes we extracted are located at the centre of the network and play an important role in information spread for replication. Similarly, all proteins in the 16 viral infection interaction networks were further divided into two groups: coding proteins associated with multiple virus infections and specific proteins associated with only one virus infection. It was found that the degree, closeness and betweenness (, all Wilcoxon p-values < 0.01) of the proteins associated with multiple viral infections were significantly higher than those associated with one viral infection, which indicated a strong correlation between viruses.
Functional pathways of viral infection-related genes
To identify functional pathways associated with viral infections, we analyzed the common functions of these viruses (). It was found that most viruses were significantly enriched in positive regulation of immune effector process, negative regulation of lymphocyte activation and antigen processing and presentation. Among them, Rhinovirus, Influenza virus, RSV and patients infected with both Rhinovirus and Influenza virus can cause different degrees of ageing. Rhinoviruses, chikungunya viruses, Influenza viruses, and RSV cause negative regulation of transferase activity. Previous studies have shown that human RSV can trigger early innate immune responses and regulate ubiquitination/deubiquitination processes. The early regulation of the innate immune response includes the expression of hundreds of proinflammatory and antiviral genes that stimulate subsequent innate and adaptive immunity to the host [Citation62]. Histone modifications can induce cytokine storms that lead to disruption of tight junction proteins and the blood-brain barrier. And induces influenza-associated encephalopathy, a potential complication of common Influenza virus infection [Citation63]. We also found that BP such as corresponding genes that regulate inflammation [Citation64], cell killing [Citation65], and enhancement of T-cell activity [Citation66] were enriched in a variety of viral infections. Meantime, we found that genes related to the progression of SARS-COV-2 were significantly enriched in immune system development and regulation kinase of activity pathway (Figure S8). The results of the functional analysis showed that virus infection selectively suppressed the immune response in host-infected cells, which would have an important effect on virus transmission.
Figure 4. Functional pathways of viral infection-related genes. (A) Consensus BP function of respiratory tract infection viruses, * indicates p-value < 0.01. (B) Correlation between different viral BP functions. The x-axis is the BP function of the virus, and the ordinate is the target protein of the virus extracted with a threshold FDR < 0.01. (C) Correlation between different viral BP functions. The x-axis is the BP function of the virus, and the ordinate is the target protein of the virus extracted with a threshold FDR < 0.05. The position of the dot represents the similarity between functions related to viral infection, and the colour of the dot represents the similarity between genes related to viral infection.
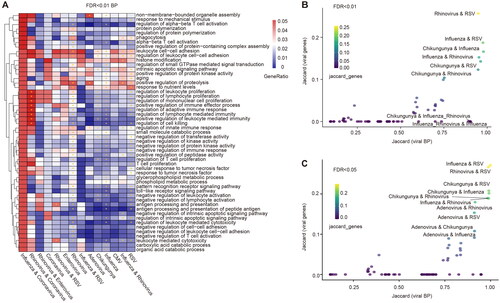
Subsequently, to identify functional similarities between different viruses, we used the Jaccard index to calculate their similarities (). A high degree of similarity was found between Rhinovirus and RSV, Influenza and RSV, and Influenza and Rhinovirus, regardless of the BP function determined in these two thresholds. At the same time, the biomarkers of viruses with high functional similarity also have high similarity, for example, the biomarkers of Influenza virus and RSV have high similarity. Although most patients infected with both viruses will cause similar functions to those infected with either virus, not all patients infected with both viruses will cause similar functions. They may trigger the same functions as in patients with other viral infections, such as functional similarities between patients infected with both Influenza and Rhinovirus and those infected with Chikungunya. It has been shown that IL-17A is a common driver of lung function and immunological impairment caused by influenza virus, rhinovirus, and RSV [Citation67]. Previous clinical studies have revealed similarities between the clinical phenotypes of respiratory viruses by collecting a large number of viral infection samples, which is consistent with our findings [Citation68,Citation69]. These results also indirectly suggest that there is a certain similarity in viral function in respiratory tract infections.
Human tissues associated with viral infections
Viral infections are extremely harmful to people. We further explored the relationship between viruses and specific tissues in the human body. We assessed network-based overlap between 34 tissue-associated proteins and 16 viral protein targets using the metric. The network overlap of each virus and tissue was sorted according to the
value from small to large, and the top 5 tissues corresponding to each virus were extracted. We found 16 tissues associated with virus infection, such as blood, spleen, liver and brain. We also searched and organized the literature between relevant tissues and viral infections using the ‘pubmedR’ package and identified the interactions that were validated in the MVIP database [Citation41] (). For example, many studies have shown that Conavirus and Influenza viruses are strongly related to blood tissue, Enterovirus and Adenovirus also have varying degrees of Influence on liver tissue and brain tissue, and in addition to Coxsackie virus, studies have shown that the remaining 15 kinds of respiratory virus infection will affect spleen tissue.
Figure 5. Human tissues associated with viral infections. (A) Visualization of the literature association of respiratory infection viruses and related tissues. The green dots represent viruses. The pink dots represent tissue, and the larger nodes represent more viruses associated with them. The thickness of the degree is proportional to the amount of relevant literature, and the red line represents the retrieval in the MVIP database. (B) Network visualization showing the PPIs among Influenza viral interacting proteins and brain tissue associated proteins. Orange nodes represent virus-related target proteins, and pink nodes represent brain tissue-related proteins.
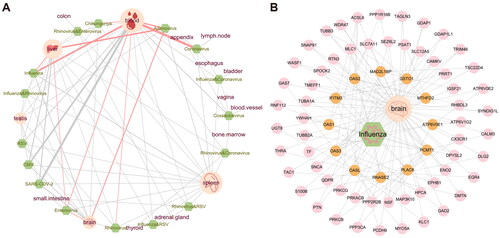
It has been demonstrated that the systemic inflammatory processes caused by viral infection may lead to neuroinflammation, blood-brain barrier dysfunction, neurotransmitter metabolism imbalance and so on [Citation70]. So, we used molecular network visualization to further show the connection between influenza virus-related proteins and the brain (). Previous studies have confirmed that interferon induces the increase of transmembrane 3 (IFITM3) expression in some inflammatory states of the brain [Citation71], and can promote human cytomegalovirus infection in brain tissue [Citation72]. This gene may be a key target for identifying viruses associated with inflammation in brain tissue. All these results suggested the close associations of viral infections and tissue-specific genes.
Diseases comorbidities associated with viral infections
Patients with viral infection often do not suffer from a single disease, and many comorbidities will accompany the virus. At present, limited study has provided the distribution map of complications associated with respiratory virus infection. We also assessed network-based overlap between 299 disease-associated proteins and 16 viral protein targets using the metric (). We found that
of SARS-COV-2 and nervous system diseases, neoplasms, genetic diseases (inborn) and other diseases (). Target proteins related to Influenza infections highly overlap with those of related diseases such as nervous system diseases and metabolic diseases (). We visualized PPI between genes associated with influenza virus infection and genes associated with neurological disease (). The Influenza-interacting proteins can significantly interact with nervous system disease-associated proteins. Studies have shown that OAS3 gene expression in Cerebral cavernous malformation (CCM), a vascular lesion of the central nervous system, is significantly altered compared with normal controls [Citation73]. The OASL gene was strongly expressed in patients with multiple sclerosis (MS), a multifactorial disease of the central nervous system (CNS) that affects young adults [Citation74]. The protein of Influenza can directly interact with OAS3 and OASL, suggesting that they play important roles in mediating viral infection-related nervous system diseases.
Figure 6. Diseases comorbidities associated with viral infections. (A) Disease comorbidity measured by the network overlap between respiratory virus infections-related protein coding genes and 299 diseases. (B) Association of SARS-COV-2 with 299 diseases. The dots represent diseases whose radius reflects the number of associated diseases genes. The diseases closest to the centre, whose names are marked are expected to have higher comorbidity with viral infection. Red labels represent (C) Diseases associations based on Influenza-correlated genes. (D) Network visualization showing the PPIs among Influenza viral interacting proteins and nervous system diseases associated proteins. Orange nodes represent virus-related target proteins, and pink nodes represent brain tissue-related proteins.
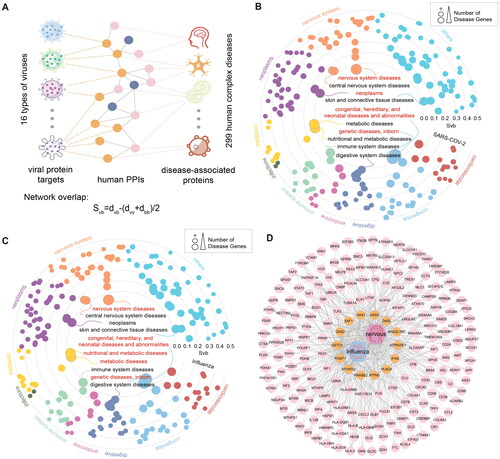
It has been shown that viral diseases such as influenza can enter the central nervous system through the olfactory nerve and lead to neurological diseases [Citation75]. SARS-COV-2 patients with a history of central nervous system complications have a poor prognosis and an increased risk of morbidity and mortality [Citation76, Citation77]. We also analyzed the network-based overlap of the remaining 14 viruses and diseases (Figure S9). The four main respiratory viral infections studied (Rhinovirus, Influenza virus, RSV and SARS-CoV-2), which are most associated with neurological diseases, tumour, metabolic, immune, and skin and connective tissue diseases, Rhinovirus is more likely to cause multiple disease complications than the other three viruses. We found that most of the viruses were found to be strongly associated with neurological diseases, tumours, and metabolism. This finding systematically provides an association between respiratory viral infections and disease comorbidities and provides therapeutic opportunities and effective research directions for the diagnosis and treatment of comorbidity.
Discussion
In this study, we manually collected numerous respiratory infection-related virtual transcriptomes. The protein-coding genes with perturbed expressions in the infection process of each virus were confirmed and further performed the functional enrichment analysis to investigate the pathways of viral infections. Subsequently, we found that robust gene biomarkers can accurately distinguish the infection patients from normal controls, which were further validated in independent cohorts. The Jaccard index showed that viruses such as Influenza, RSA, Rhinovirus and other viruses have high similarity in function, and were related to immune regulation, histone modification, and inflammatory response. At the same time, the process of virus infection has a non-negligible impact on our blood and brain. Finally, we mapped 16 viral infections of 299 complex human diseases and found that many viral infections can lead to nervous system diseases, neoplasms, metabolism and other related comorbidities. Furthermore, Tipiracil, Glutathione and Abacavir were most significant in the treatment of Influenza with proper citations (Table S2). And Bufexamac, Lenalidomide and Alpelisib were most significant in the treatment of SARS-CoV-2 with proper citations. However, we only computationally predicted the candidates and functionally characterized them by computational methods. These candidates need to be explored by web lab in the future.
Antiviral genes OAS1, OAS2 and OAS3 also play important roles during respiratory virus infection [Citation78]. MTHFD2, a metabolic checkpoint that controls effectors and regulates T-cell fate and function [Citation43], was up-regulated during RSV and Influenza infection. Meantime, BP shown as regulating inflammation and enhancement of T-cell activity were enriched in a variety of viral infections. Although we have analyzed numerous datasets of viruses associated with respiratory infections, the prevalence is extremely high because the infectious diseases themselves spread very quickly and mutate easily. However, our study is still a relatively systematic analysis of the functions and similarities among respiratory infection-related viruses and provides insights into multiple viral comorbidities. Consistent with our findings, previous studies have shown that SARS-CoV-1 was closely related to central nervous system diseases and brain diseases [Citation79]. Neurological symptoms and manifestations are associated with SARS-CoV-2 infection [Citation80]. At the same time, we found that RSV, Rhinovirus, Enterovirus and Adenovirus were highly associated with nervous system diseases. Most viruses cause comorbidities such as neoplasms and immune system diseases. Previous studies have prioritized drug candidates based on network proximity metrics to identify potential drugs for disease treatment [Citation81]. We identified a number of drug targets associated with viral infections (Table S2). Such as 171 gene targets of 87 drugs related to SARS-CoV-2 and 159 gene targets of 34 drugs related to Influenza. These drug targets provided potential candidates for the prevention and treatment of patients with respiratory viral infections.
In conclusion, our study reveals key molecular markers in the process of viral infection through transcriptomic data from a variety of respiratory virus infections. By systematically depicting the landscape map between virus infection and disease comorbidity, our study provides new insights into the diagnosis of disease comorbidity. At the same time, molecular markers identified in this study in the process of multiple viral infections could provide a valuable theoretical basis for the prevention of subsequent public health events such as respiratory virus infections.
Authors’ contributions
Yongsheng Li, Xia Li and Yunpeng Zhang came up with the design, conception and methodology. Yongsheng Li, Xia Li, Yunpeng Zhang and Jing Guo wrote the first draft of the manuscript. Jing Guo, Ya Zhang, Yueying Gao and Si Li contributed to material preparation, data collection, analysis and administration. Ya Zhang, Gang Xu, Zhanyu Tian and Qi Xu contributed to visualization, data curation, validation and research summary. Jing Guo and Ya Zhang contributed equally to this study and shared co-first authors. All authors read and approved the final manuscript.
Supplemental Material
Download MS Word (4.4 MB)Supplemental Material
Download MS Excel (49.1 KB)Supplemental Material
Download MS Excel (16.3 KB)Disclosure statement
No potential conflict of interest was reported by the author(s).
Data availability statement
Public gene expression profiles used in this work can be acquired from Gene Expression Omnibus (GEO, http://www.ncbi.nlm.nih.gov/geo/), ArrayExpress (https://www.ebi.ac.uk/biostudies/arrayexpress), European Genome-phenome Archive (EGA, https://ega-archive.org/) and BioSample (http://www.ncbi.nlm.nih.gov/biosample/). The datasets used and/or analyzed during the present study are available from the corresponding authors upon reasonable request.
Additional information
Funding
References
- Grubaugh ND, Ladner JT, Lemey P, et al. Tracking virus outbreaks in the twenty-first century. Nat Microbiol. 2019;4(1):10–19. doi: 10.1038/s41564-018-0296-2.
- Shokri-Mashhadi N, Kazemi M, Saadat S, et al. Effects of select dietary supplements on the prevention and treatment of viral respiratory tract infections: a systematic review of randomized controlled trials. Expert Rev Respir Med. 2021;15(6):805–821. doi: 10.1080/17476348.2021.1918546.
- Li J, Liang X, Jiang J, et al. PBMC transcriptomics identifies immune-metabolism disorder during the development of HBV-ACLF. Gut. 2022;71(1):163–175. doi: 10.1136/gutjnl-2020-323395.
- Adamo S, Michler J, Zurbuchen Y, et al. Signature of long-lived memory CD8(+) T cells in acute SARS-CoV-2 infection. Nature. 2022;602(7895):148–155. doi: 10.1038/s41586-021-04280-x.
- Al Zamane S, Nobel FA, Jebin RA, et al. Development of an in silico multi-epitope vaccine against SARS-COV-2 by precised immune-informatics approaches. Inform Med Unlocked. 2021;27:100781. doi: 10.1016/j.imu.2021.100781.
- Mahmud SMH, Chen W, Liu Y, et al. PreDTIs: prediction of drug-target interactions based on multiple feature information using gradient boosting framework with data balancing and feature selection techniques. Brief Bioinform. 2021;22(5):bbab046. doi:10.1093/bib/bbab046.
- Islam R, Ahmed L, Paul BK, et al. Identification of molecular biomarkers and pathways of NSCLC: insights from a systems biomedicine perspective. J Genet Eng Biotechnol. 2021;19(1):43. doi: 10.1186/s43141-021-00134-1.
- Islam MR, Alam MK, Paul BK, et al. Identification of molecular biomarkers and key pathways for esophageal carcinoma (EsC): a bioinformatics approach. Biomed Res Int. 2022;2022:5908402. doi:10.1155/2022/5908402.
- Islam MR, Abdulrazak LF, Alam MK, et al. Identification of potential key genes and molecular mechanisms of medulloblastoma based on integrated bioinformatics approach. Biomed Res Int. 2022;2022:1776082. doi:10.1155/2022/1776082.
- Patel SK, Surve J, Parmar J, et al. Recent advances in biosensors for detection of COVID-19 and other viruses. IEEE Rev Biomed Eng. 2023;16:22–37. doi: 10.1109/RBME.2022.3212038.
- Twigg HL, 3rd, Khan SH, Perkins AJ, et al. Mortality rates in a diverse cohort of mechanically ventilated patients with novel coronavirus in the urban midwest. Crit Care Explor. 2020;2(8):e0187. doi: 10.1097/CCE.0000000000000187.
- Ranucci M, Ballotta A, Di Dedda U, et al. The procoagulant pattern of patients with COVID-19 acute respiratory distress syndrome. J Thromb Haemost. 2020;18(7):1747–1751. doi: 10.1111/jth.14854.
- Joo YB, Kim KJ, Park KS, et al. Influenza infection as a trigger for systemic lupus erythematosus flares resulting in hospitalization. Sci Rep. 2021;11(1):4630. doi: 10.1038/s41598-021-84153-5.
- Mahmud SMH, Al-Mustanjid M, Akter F, et al. Bioinformatics and system biology approach to identify the influences of SARS-CoV-2 infections to idiopathic pulmonary fibrosis and chronic obstructive pulmonary disease patients. Brief Bioinform. 2021;22(5):bbab115. doi:10.1093/bib/bbab115.
- Taz TA, Ahmed K, Paul BK, et al. Identification of biomarkers and pathways for the SARS-CoV-2 infections that make complexities in pulmonary arterial hypertension patients. Brief Bioinform. 2021;22(2):1451–1465. doi: 10.1093/bib/bbab026.
- Tanzir Mehedi S, Ahmed K, Bui FM, et al. MLBioIGE: integration and interplay of machine learning and bioinformatics approach to identify the genetic effect of SARS-COV-2 on idiopathic pulmonary fibrosis patients. Biol Methods Protoc. 2022;7:bpac013.
- Taz TA, Ahmed K, Paul BK, et al. Network-based identification genetic effect of SARS-CoV-2 infections to idiopathic pulmonary fibrosis (IPF) patients. Brief Bioinform. 2021;22(2):1254–1266. doi: 10.1093/bib/bbaa235.
- Kulaga SS, Miller CWT. Viral respiratory infections and psychosis: a review of the literature and the implications of COVID-19. Neurosci Biobehav Rev. 2021;127:520–530. doi: 10.1016/j.neubiorev.2021.05.008.
- Shakartalla SB, Alhumaidi RB, Shammout ODA, et al. Dyslipidemia in breast cancer patients increases the risk of SAR-CoV-2 infection. Infect Genet Evol. 2021;92:104883. doi: 10.1016/j.meegid.2021.104883.
- Linderman SL, Ellebedy AH, Davis C, et al. Influenza immunization in the context of preexisting immunity. Cold Spring Harb Perspect Med. 2021;11(11):a040964. doi: 10.1101/cshperspect.a040964.
- Brunner R, Min Z, Bhanot N. Brain lesion in a patient with influenza. Clin Infect Dis. 2020;70(2):331–333. doi: 10.1093/cid/ciz314.
- Xiang Q, Feng Z, Diao B, et al. SARS-CoV-2 induces lymphocytopenia by promoting inflammation and decimates secondary lymphoid organs. Front Immunol. 2021;12:661052. doi: 10.3389/fimmu.2021.661052.
- Duchini A, Hendry RM, Redfield DC, et al. Influenza infection in patients before and after liver transplantation. Liver Transpl. 2000;6(5):531–542. doi: 10.1053/jlts.2000.9738.
- Sun X, Zhang H, Yao D, et al. Integrated bioinformatics analysis identifies hub genes associated with viral infection and Alzheimer’s disease. J Alzheimers Dis. 2022;85(3):1053–1061. doi: 10.3233/JAD-215232.
- Imig JD. SARS-CoV-2 spike protein causes cardiovascular disease independent of viral infection. Clin Sci . 2022;136(6):431–434. doi: 10.1042/CS20220028.
- Davis S, Meltzer PS. GEOquery: a bridge between the gene expression omnibus (GEO) and bioconductor. Bioinformatics. 2007;23(14):1846–1847. doi: 10.1093/bioinformatics/btm254.
- Frankish A, Diekhans M, Ferreira AM, et al. GENCODE reference annotation for the human and mouse genomes. Nucleic Acids Res. 2019;47(D1):D766–D773. doi: 10.1093/nar/gky955.
- Bolger AM, Lohse M, Usadel B. Trimmomatic: a flexible trimmer for illumina sequence data. Bioinformatics. 2014;30(15):2114–2120. doi: 10.1093/bioinformatics/btu170.
- Etherington GJ, Ramirez-Gonzalez RH, MacLean D. Bio-samtools 2: a package for analysis and visualization of sequence and alignment data with SAMtools in ruby. Bioinformatics. 2015;31(15):2565–2567. doi: 10.1093/bioinformatics/btv178.
- Kumar L, E Futschik M. Mfuzz: a software package for soft clustering of microarray data. Bioinformation. 2007;2(1):5–7. doi: 10.6026/97320630002005.
- Robin X, Turck N, Hainard A, et al. pROC: an open-source package for R and S + to analyze and compare ROC curves. BMC Bioinf. 2011;12(1):77. doi: 10.1186/1471-2105-12-77.
- Keshava Prasad TS, Goel R, Kandasamy K, et al. Human protein reference database–2009 update. Nucleic Acids Res. 2009;37(Database issue):D767–72. doi: 10.1093/nar/gkn892.
- Doncheva NT, Morris JH, Gorodkin J, et al. Cytoscape StringApp: network analysis and visualization of proteomics data. J Proteome Res. 2019;18(2):623–632. doi: 10.1021/acs.jproteome.8b00702.
- Csardi G, Nepusz T. The igraph software package for complex network research. Int j Complex Syst. 2006;1695:1695.
- Wu T, Hu E, Xu S, et al. clusterProfiler 4.0: a universal enrichment tool for interpreting omics data. Innovation . 2021;2:100141.
- Zhou Y, Zhou B, Pache L, et al. Metascape provides a biologist-oriented resource for the analysis of systems-level datasets. Nat Commun. 2019;10(1):1523. doi: 10.1038/s41467-019-09234-6.
- Levandowsky M, Winter D. Distance between sets. Nature. 1971;234(5323):34–35. doi: 10.1038/234034a0.
- Menche J, Sharma A, Kitsak M, et al. Disease networks. Uncovering disease-disease relationships through the incomplete interactome. Science. 2015;347(6224):1257601–1257601. doi: 10.1126/science.1257601.
- Lv D, Xu K, Jin X, et al. LncSpA: lncRNA spatial atlas of expression across normal and cancer tissues. Cancer Res. 2020;80(10):2067–2071. doi: 10.1158/0008-5472.CAN-19-2687.
- Mohammadi S, Davila-Velderrain J, Kellis M. Reconstruction of cell-type-specific interactomes at single-cell resolution. Cell Syst. 2019;9(6):559–568 e4. doi: 10.1016/j.cels.2019.10.007.
- Tang Z, Fan W, Li Q, et al. MVIP: multi-omics portal of viral infection. Nucleic Acids Res. 2022;50(D1):D817–D827. doi: 10.1093/nar/gkab958.
- Morselli Gysi D, do Valle I, Zitnik M, et al. Network medicine framework for identifying drug-repurposing opportunities for COVID-19. Proc Natl Acad Sci U S A. 2021;118(19):e2025581118. doi:10.1073/pnas.2025581118.
- Sugiura A, Andrejeva G, Voss K, et al. MTHFD2 is a metabolic checkpoint controlling effector and regulatory T cell fate and function. Immunity. 2022;55(1):65–81 e9. doi: 10.1016/j.immuni.2021.10.011.
- Kristiansen H, Gad HH, Eskildsen-Larsen S, et al. The oligoadenylate synthetase family: an ancient protein family with multiple antiviral activities. J Interferon Cytokine Res. 2011;31(1):41–47. doi: 10.1089/jir.2010.0107.
- Zhang Y, Liu Z. STAT1 in cancer: friend or foe? Discov Med. 2017;24(130):19–29.
- Nakaya T. A specific gene-splicing alteration in the SNRNP70 gene as a hallmark of an ALS subtype. Gene. 2022;818:146203. doi: 10.1016/j.gene.2022.146203.
- Jia X, Guan B, Liao J, et al. Down-regulation of GCLC is involved in microcystin-LR-induced malignant transformation of human liver cells. Toxicology. 2019;421:49–58. doi: 10.1016/j.tox.2019.03.010.
- Nishi N, Shoji H, Seki M, et al. Galectin-8 modulates neutrophil function via interaction with integrin alphaM. Glycobiology. 2003;13(11):755–763. doi: 10.1093/glycob/cwg102.
- Saygin D, Tabib T, Bittar HET, et al. Transcriptional profiling of lung cell populations in idiopathic pulmonary arterial hypertension. Pulm Circ. 2020;10(1):1–15. doi: 10.1177/2045894020908782.
- Zhou X, Tian L, Wang J, et al. EV71 3C protease cleaves host anti-viral factor OAS3 and enhances virus replication. Virol Sin. 2022;37(3):418–426. doi: 10.1016/j.virs.2022.04.013.
- Garcia-Castillo V, Tomokiyo M, Raya Tonetti F, et al. Alveolar macrophages are key players in the modulation of the respiratory antiviral immunity induced by orally administered lacticaseibacillus rhamnosus CRL1505. Front Immunol. 2020;11:568636. doi: 10.3389/fimmu.2020.568636.
- Zhao L, Zhang X, Wu Z, et al. The downregulation of microRNA hsa-miR-340-5p in IAV-infected A549 cells suppresses viral replication by targeting RIG-I and OAS2. Mol Ther Nucleic Acids. 2019;14:509–519. doi: 10.1016/j.omtn.2018.12.014.
- McDonald JU, Kaforou M, Clare S, et al. A simple screening approach to prioritize genes for functional analysis identifies a role for interferon regulatory factor 7 in the control of respiratory syncytial virus disease. mSystems. 2016;1(3):e00051-16.doi: 10.1128/mSystems.00051-16.
- Zhou A, Dong X, Liu M, et al. Comprehensive transcriptomic analysis identifies novel antiviral factors against influenza a virus infection. Front Immunol. 2021;12:632798. doi: 10.3389/fimmu.2021.632798.
- Allen IC, Moore CB, Schneider M, et al. NLRX1 protein attenuates inflammatory responses to infection by interfering with the RIG-I-MAVS and TRAF6-NF-kappaB signaling pathways. Immunity. 2011;34(6):854–865. doi: 10.1016/j.immuni.2011.03.026.
- Zhu L, Yang P, Zhao Y, et al. Single-cell sequencing of peripheral mononuclear cells reveals distinct immune response landscapes of COVID-19 and influenza patients. Immunity. 2020;53(3):685–696 e3. doi: 10.1016/j.immuni.2020.07.009.
- Letamendia A, Labbe E, Attisano L. Transcriptional regulation by smads: crosstalk between the TGF-beta and wnt pathways. J Bone Joint Surg Am. 2001;83-A(1):S31–S9.
- Ludyga N, Englert S, Pflieger K, et al. The impact of cysteine-rich intestinal protein 1 (CRIP1) in human breast cancer. Mol Cancer. 2013;12(1):28. doi: 10.1186/1476-4598-12-28.
- Albert R. Scale-free networks in cell biology. J Cell Sci. 2005;118(Pt 21):4947–4957. doi: 10.1242/jcs.02714.
- Shao T, Wang G, Chen H, et al. Survey of miRNA-miRNA cooperative regulation principles across cancer types. Brief Bioinform. 2019;20(5):1621–1638. doi: 10.1093/bib/bby038.
- Li Y, Huo C, Pan T, et al. Systematic review regulatory principles of non-coding RNAs in cardiovascular diseases. Brief Bioinform. 2019;20(1):66–76. doi: 10.1093/bib/bbx095.
- Martín-Vicente M, Resino S, Martínez I. Early innate immune response triggered by the human respiratory syncytial virus and its regulation by ubiquitination/deubiquitination processes. J Biomed Sci. 2022;29(1):11. doi: 10.1186/s12929-022-00793-3.
- Imakita N, Kitabatake M, Ouji-Sageshima N, et al. Abrogated caveolin-1 expression via histone modification enzyme Setdb2 regulates brain edema in a mouse model of influenza-associated encephalopathy. Sci Rep. 2019;9(1):284. doi: 10.1038/s41598-018-36489-8.
- Fabisik M, Tureckova J, Pavliuchenko N, et al. Regulation of inflammatory response by transmembrane adaptor protein LST1. Front Immunol. 2021;12:618332. doi: 10.3389/fimmu.2021.618332.
- Ishikawa H, Sasaki H, Fukui T, et al. Mice with asthma are more resistant to influenza virus infection and NK cells activated by the induction of asthma have potentially protective effects. J Clin Immunol. 2012;32(2):256–267. doi: 10.1007/s10875-011-9619-2.
- Kim HJ, Kwak HW, Kang KW, et al. MERS-CoV spike protein vaccine and inactivated influenza vaccine formulated with single strand RNA adjuvant induce T-cell activation through intranasal immunization in mice. Pharmaceutics. 2020;12(5):441. doi: 10.3390/pharmaceutics12050441.
- Liu X, Nguyen TH, Sokulsky L, et al. IL-17A is a common and critical driver of impaired lung function and immunopathology induced by influenza virus, rhinovirus and respiratory syncytial virus. Respirology. 2021;26(11):1049–1059. doi: 10.1111/resp.14141.
- Hedberg P, Karlsson Valik J, van der Werff S, et al. Clinical phenotypes and outcomes of SARS-CoV-2, influenza, RSV and seven other respiratory viruses: a retrospective study using complete hospital data. Thorax. 2022;77(2):154–163. doi: 10.1136/thoraxjnl-2021-216949.
- Neumann G, Kawaoka Y. Seasonality of influenza and other respiratory viruses. EMBO Mol Med. 2022;14(4):e15352. doi: 10.15252/emmm.202115352.
- Barbosa-Silva MC, Lima MN, Battaglini D, et al. Infectious disease-associated encephalopathies. Crit Care. 2021;25(1):236. doi: 10.1186/s13054-021-03659-6.
- Harmon E, Doan A, Bautista-Garrido J, et al. Increased expression of interferon-induced transmembrane 3 (IFITM3) in stroke and other inflammatory conditions in the brain. Int J Mol Sci. 2022;23(16):8885. doi:10.3390/ijms23168885.
- Wang YS, Luo QL, Guan YG, et al. HCMV infection and IFITM3 rs12252 are associated with rasmussen’s encephalitis disease progression. Ann Clin Transl Neurol. 2021;8(3):558–570. doi: 10.1002/acn3.51289.
- Eren Gozel H, Kok K, Ozlen F, et al. A novel insight into differential expression profiles of sporadic cerebral cavernous malformation patients with different symptoms. Sci Rep. 2021;11(1):19351. doi: 10.1038/s41598-021-98647-9.
- Al-Nashmi M, Taha S, Alsharoqi I, et al. Interleukin 1 receptor antagonist and 2'-5'-oligoadenylate synthetase-like molecules as novel biomarkers for multiple sclerosis patients in Bahrain. Mult Scler Relat Disord. 2017;18:1–7. doi: 10.1016/j.msard.2017.09.001.
- van Riel D, Verdijk R, Kuiken T. The olfactory nerve: a shortcut for influenza and other viral diseases into the central nervous system. J Pathol. 2015;235(2):277–287. doi: 10.1002/path.4461.
- Karuppan MKM, Devadoss D, Nair M, et al. SARS-CoV-2 infection in the central and peripheral nervous system-associated morbidities and their potential mechanism. Mol Neurobiol. 2021;58(6):2465–2480. doi: 10.1007/s12035-020-02245-1.
- Amruta N, Chastain WH, Paz M, et al. SARS-CoV-2 mediated neuroinflammation and the impact of COVID-19 in neurological disorders. Cytokine Growth Factor Rev. 2021;58:1–15. doi: 10.1016/j.cytogfr.2021.02.002.
- Pairo-Castineira E, Clohisey S, Klaric L, et al. Genetic mechanisms of critical illness in COVID-19. Nature. 2021;591(7848):92–98. doi: 10.1038/s41586-020-03065-y.
- Li S, Zhou W, Li D, et al. Comprehensive characterization of human-virus protein-protein interactions reveals disease comorbidities and potential antiviral drugs. Comput Struct Biotechnol J. 2022;20:1244–1253. doi: 10.1016/j.csbj.2022.03.002.
- Harapan BN, Yoo HJ. Neurological symptoms, manifestations, and complications associated with severe acute respiratory syndrome coronavirus 2 (SARS-CoV-2) and coronavirus disease 19 (COVID-19). J Neurol. 2021;268(9):3059–3071. doi: 10.1007/s00415-021-10406-y.
- Zhou Y, Hou Y, Shen J, et al. Network-based drug repurposing for novel coronavirus 2019-nCoV/SARS-CoV-2. Cell Discov. 2020;6(1):14. doi: 10.1038/s41421-020-0153-3.