
 ?Mathematical formulae have been encoded as MathML and are displayed in this HTML version using MathJax in order to improve their display. Uncheck the box to turn MathJax off. This feature requires Javascript. Click on a formula to zoom.
Abstract
Niosomes (NS) are the promising and novel carrier of the drug for effective transdermal delivery. Apigenin (AN) is a natural bioactive compound and has various pharmacological activities. AN is poorly water soluble which directly affects therapeutic efficacy. The aim of this research work was to develop the AN-NS gel to improve transdermal delivery. The thin-film hydration method was used for the development of AN-NS. The optimized AN-NS (AN-NS2) has a vesicle size of 272.56 ± 12.49 nm, PDI is 0.249, zeta potential is −38.7 mV, and entrapment efficiency of 86.19 ± 1.51%. The FTIR spectra of the AN-NS2 depicted that AN encapsulated in the NS matrix. AN-NS2 formulation was successfully incorporated into chitosan gel and evaluated. The optimized AN-NS2 gel (AN-NS2G4) has 2110 ± 14cps of viscosity, 10.40 ± 0.21g.cm/sec of spreadability, and 99.65 ± 0.53% of drug content. AN-NS2G4 displayed significantly (p < 0.05) higher AN released (67.64 ± 3.03%) than pure AN-gel (37.31 ± 2.87%). AN-NS2G4 showed the Korsmeyer Peppas release model. AN-NS2G4 displayed significantly (p < 0.05) higher antioxidant activity (90.72%) than pure AN (64.53%) at 300 µg/ml. AN-NS2G4 displayed significantly (p < 0.05) higher % inhibition of swelling than pane AN-gel in carrageenin-induced paw oedema in rats. The finding concluded that niosomes-laden gel is a good carrier of drugs to improve transdermal delivery and therapeutic efficacy.
Introduction
Various potential therapeutic activities are exhibited by natural bioactive compounds that are extracted from a diverse range of sources, including plants, animals, and marine organisms. Apigenin, luteolin, quercetin, umbilic acid, lutein, naringin, quercetin, naringenin, and curcumin are examples of herbal bioactive compounds used in single or in combination with other therapeutic agent for the cure of several diseases like anticancer, anti-inflammatory, anti-bacterial, anti-oxidant, etc [Citation1]. But they have some limitations, that is, poor solubility and poor bioavailability which directly affect therapeutic efficacy. Apigenin (AN) is an herbal bioactive compound extracted from various sources like vegetables (parsley, onions), and fruits (orange) [Citation2]. AN is a polyphenolic flavonoid in nature and reported various therapeutic activities, that is, anti-microbial [Citation3], anti-oxidant [Citation4], anticancer [Citation5], anti-inflammatory [Citation6], and antidiabetic [Citation7]. The AN has poor aqueous solubility (2.16 µg/ml) and low bioavailability and belongs to BCS class II [Citation8]. After oral administration, the AN compound is rapidly metabolized into several compounds in rats and exhibited a 51% bioavailability [Citation9,Citation10]. The topical delivery system (via skin) is an optimistic alternative route to oral and injectable [Citation11]. It possesses several advantages, that is, avoiding first-pass metabolism, high patient compliance, and providing sustained effect [Citation12]. Several types of nanoformulation incorporated into gel were reported to improve the topical delivery of the therapeutic agents. Ananth and its associate developed solid–lipid nanoparticle gel loaded with Fenugreek Seed Extract for the treatment of Alopecia and displayed a 72.05 ± 0.15% ex vivo skin disposition and good stability for three months without any change [Citation13]. Altamimi et al. formulated the luteolin-loaded nanoemulsion and showed an 8.23-fold higher enhancement ratio than pure luteolin suspension [Citation14]. Okonogi and its associated formulated the nanostructure lipid carrier of lycopene for topical delivery and reported significantly higher antioxidant activity (14.1 ± 0.6 mg/mL) than free lycopene (17.7 ± 0.4 mg/mL) [Citation15]. Mitri and its associates developed lutein lutein-loaded nanostructured lipid carrier. The formulation showed good stability against UV- degradation and significantly higher skin permeation than pure lutein [Citation16]. Due to the tight junction of the stratum corneum layer (barrier) of the skin, the penetration of therapeutic agents is a major challenge. The various drug delivery (polymeric nanoparticle and lipid-based nanoparticles) have been designed to increase the penetration of the drug through the skin or target specific skin conditions. Among them, nano-vesicular (lipid-based) delivery systems are novel carriers used for topical delivery (skin). These carrier systems can transport both lipophilic and hydrophilic therapeutic agents [Citation17]. Vesicular carriers have the capability to reversibly weaken the lipid organization of the stratum corneum and loosen the tight cellular structure. It also promotes drug diffusion through the skin layer and is systemically absorbed through the dermal blood capillaries. Niosomes (NS) are lipid-based vesicular carriers and mainly consist of surfactant (non-ionic) and cholesterol. It enhanced the permeation of drugs to the skin [Citation17]. The incorporation of NS into hydrogel increases the stability, consistency, and transdermal delivery of AN-NS. Presently the chitosan polymer is used as a gelling agent to incorporate the AN-NS for transdermal delivery. Chitosan is a natural polymer derived from chitin and has the ability to form a gel structure. It is a bio-adhesive, biodegradable, and biocompatible polymer. It can be safely used in the body without causing harm or leaving harmful residue behind. Chitosan can help to enhance the permeability of the stratum corneum [Citation18], intestinal mucosa [Citation19], and ocular mucosa [Citation20]. Due to cationic polymer, it interacts with the negative charge of stratum corneum and penetrates the drug to the deeper layer of skin. To date, there are no reports on AN-loaded NS-gel for transdermal delivery reported for anti-inflammatory effects. The present study was to develop the AN-loaded NS-gel for the improvement of transdermal delivery. The NS was prepared by the thin film hydration method and optimized by Box–Behnken design. Further, the optimized AN-NS was incorporated into the chitosan gel and evaluated for physiochemical parameters. Further, the optimized AN-NS-gel was evaluated for in-vitro release, ex vivo permeation, antioxidant, antimicrobial, and anti-inflammatory activity.
Materials
Apigenin (AN) was procured from Sigma Aldrich (St Louis, USA). Cholesterol (CHO), span-60, HPLC grade water, acetonitrile, methanol, and chloroform were procured from Loba Chemie (Mumbai, India). Dialysis membrane (MWCO-12000Da) was procured from the Hi-Media Pvt. Ltd (Mumbai, India). The remaining chemicals used for the experiments are analytical grade.
Experimental
Box–Behnken design for an-NS
Box-Behnken design (BBD, Version 8.0.7.1, Stat-Ease, MN, USA) was employed for the optimization of AN-NS formulation. Based on preliminary screening the span 60 (non-ionic surfactant, A), CHO (B), and hydration time (C) were selected as independent factors in three levels and determined their effects on vesicle size (VS, Y1, nm) and % entrapment efficiency (EE, Y2) (). The response data was applied to various models and analysed the statistical parameters (R2, adjusted R2, and predicted R2). ANOVA of the best-fitted model of each response was analysed to determine the F-value, Lack of fit, P-value, R2, and adequate precision [Citation21]. The polynomial equation and 3D plot were constructed for each response to explore the effect of independent factors on the response. The highest desirability criteria were used to select optimal experimental conditions after model fitting followed by validation of the model at a 95% confidence interval. This was achieved through statistical comparison of the predicted value with the observed value of optimized AN-NS for each dependent variable.
Table 1. Composition of various an-NS batches and experimental & predicted values of responses.
Optimization by numerical optimization technique and validation of RSM
A numerical point prediction optimization method was used for the selection of optimized formulation. The desirability value should be around ‘1′ for acceptance, and near ‘0’ for unacceptable response [Citation22]. The responses (VS, and EE) were analysed at the best optimized independent variables. The prediction error was computed using the following equation to check and validate the response surface methodology [Citation23].
(1)
(1)
Development of AG-NS
A thin-film hydration technique was used for the development of AN-NS [Citation24]. The required quantity of ingredients (span-60, CHO, and AN) were taken into the round bottom flask () and dissolved with organic solvent (methanol and chloroform mixture, 1:1). Then, the flask was fixed on a rotary evaporator to evaporate the solvent at 50○C under reduce pressure. The thin film was formed on the periphery of the round bottom and stored in a desiccator for 24h to remove the moisture. After that thin film was hydrated with phosphate buffer (15 ml, pH 6.5) for 45–75min on the rotary evaporator at 40○C. Then AN-NS dispersion formed and the sonicated for 3 min at 30-s intervals in plus mode using a probe sonicator (Qsonica, CL-18, LLC, CT, USA). The AN-NS was formed, packed in the vial, and stored in cold conditions.
Niosomes characterization
The vesicle size (VS), polydispersity index (PDI), and zeta potential (ZP)
The VS, PDI, and ZP of AN-NS formulations were analysed by zetasizer (Malvern sizer, Malvern, UK). The 100th times diluted AN-NS dispersion was filled into the cuvette and measured at 90○ scattering angle at 25○C.
Entrapment efficiency (EE)
The % EE of AN in AN-NS formulations was determined by the ultracentrifugation technique. The % EE of AN was computed by the given equation
(2)
(2)
Fourier transform infra-red spectroscopy (FTIR)
The FTIR spectra of AN, CHO, Span-60, and optimized AN-NS were analysed by the FTIR instrument (Shimadzu, Japan). Each sample was mixed individually with dried potassium bromide (KBr) in an equal ratio and made the pellet by pressing with hydraulic pressure. Then pellet was placed in a sample holder and scanned between 4000-400 cm−1 at room temperature.
Development of gel
The optimized AN-NS formulation was transformed into a gel by using a chitosan polymer as a gelling agent. The different concentrations of chitosan gel (1–3%w/v) were prepared by dispersing the required quantity of chitosan in 0.5% aqueous acetic acid solution. The dispersion was incubated at 25○C overnight and then stirred for 2h to make a homogeneous gel. Then, the optimized AN-NS (equivalent to 1% AN) was incorporated into chitosan gel and stirred continuously to make a homogeneous distribution of AN-NS. The gels were stored in a glass vail at 25○C for further analysis.
Evaluation of an-NS incorporated gel
Viscosity and pH analysis
The viscosity of all AN-NS gel batches was analysed by using a Brook-filed viscometer (Ametek, DV3T, USA). The sample was filled in a beaker and measured viscosity using the spindle (RT04) at 50 rpm (25○C). For pH measurement, 2 g of the gel of each batch was dispersed into water (50 ml) and stood for 30 min. Then electrode of the digital pH metre was dipped for 2 min, then recorded the pH of the samples.
Spreadability
The spreadability of all AN-NS gels was measured as per the given procedure by Bhalekar et al. 2017 [Citation25]. The one glass slide was fixed with a wooden board and the second slide was moved over the first slide through the thread which is passed by a pulley having weight. The gel was sandwiched between both slides and 100 g of weight was placed over the second slide for 2-3min to remove the air. Then the second slide was subjected to slip by attaching the 40 g weight over thread pully. The slide was moved over the first slide for a remarkable distance (6.5 cm) and recorded time. The spreadability was calculated by the given formula
(3)
(3)
Drug content uniformity test
The AN concentration in AN-NS gels was analysed by taking the gel from different points (top, middle, and bottom). The sample was dissolved in the methanol and sonicated for 20 min. Then centrifuge at 5000 rpm for 20 min and collect the supernatant. Then absorbance was measured by UV-spectrophotometer (Genesys10S UV-Vis, Thermo Scientific, USA) at 270 nm and the AN content was calculated by calibration curve regression equation.
In vitro drug release
The release of AN from optimized AN-NS, optimized AN-NS gel, and AN-gel was analysed by using a dialysis bag. Before the start of the study, the dialysis bag was dipped in distilled water for 24h to open the membrane pore. The 250 ml of phosphate buffer (dissolution medium, pH 6.8) was added to a beaker and placed in a thermostat magnetic stirrer and maintained at 37 ± 1○C during the whole study. The required quantity of each formulation (5 mg of AN) was filled individually into a dialysis bag and tightly bound on both ends. Then immersed it into phosphate buffer release media. The 3 ml of aliquot was withdrawn and simultaneously added fresh buffer into the beaker to maintain the constant volume. The sample was filtered through 0.45-µm membrane filter and absorbance was analysed by UV-spectrophotometry at 270 nm and calculated the % AN release using Microsoft Excel.
Ex vivo skin permeation study
This study was carried out on excised abdominal rat skin using diffusion cells. The abdominal skin was excised after being sacrificed. The hair was removed using hair removal cream, washed, and wiped with wet cotton soaked with isopropanol to eliminate the fatty material. Then placed in 0.9% NaCl for 1h and stored at −20○C until used. The phosphate buffer (pH 6.8) was filled into the acceptor compartment of the diffusion cell (15 ml) and maintained at 37 ± 1○C with stirring at 100 rpm. The excised rat skin was placed between the acceptor and donor parts and the stratum corneum part to the word donor part. The required quantity of each formulation (optimised AN-NS gel, and AN-gel; 3 mg of AN) was filled individually into the donor compartment. The 2 ml of the aliquot was taken at definite time points and added fresh buffer at the same time to maintain the constant volume. The aliquots were filtered through 0.45 µm membrane filter and AN concentration was determined by UV- spectroscopy at 270 nm. The % permeation, flux, and apparent permeability coefficient (APC) were calculated.
(4)
(4)
(5)
(5)
In vitro antioxidant activity
The free radical scavenging potential of pure AN and optimized AN-NS gel was done by the DPPH (2,2-Diphenyl-1-picrylhydrazyl (DPPH) assay method. This assay is based on free radical (electron) transfer. The free radical stable was stable at 25○C and gave a violet colour but in the presence of antioxidant agents, gave a colourless solution due to reduction. The 0.1 mM of DPPH solution was prepared in ethanol. The 0.1 ml of ethanolic DPPH solution was added to each concentration of pure AN and optimized AN-NS-gel dispersion and incubated in a dark place for 60 min. The violet colour changes to colourless indicating a reaction and scavenging activity took place. The absorbance was taken at 571 nm using a UV-spectrophotometer and BTH was used as a control [Citation26]. The antioxidant activity of AN at each concentration was calculated by the given equation.
(6)
(6)
Antimicrobial study
The antimicrobial study of the pure AN, optimized AN-NS gel, and AN-gel was done on the gram-positive (S. aureus), and gram-negative (E. coli) bacteria using the cup plate method. The strains were grown in the nutrient broth medium (5 × 10⁶ CFU/ml). The sterilized melted nutrient agar medium was mixed with microbial stain, filled into sterilized Petri plates, and kept for solidification. The 6 mm cup was made using a sterilized borer and filled with the formulation (pure AN, optimized AN-NS gel, and AN-gel). The plates were stood for 6h in the refrigerator at 8○C to allow pre-diffusion of test samples. Then plats were incubated in an incubator at 37○C for 24h and the zone of inhibition was measured by a graduated scale in centimetres (cm).
Animal handling
All animal experiments were performed as per the Guide for the Care (ARRIVE) and the use of laboratory animals. The study protocol was approved by the institutional ethical committee (1204/PO/Re/S/08/CPCSEA/22/08) of Kharvel Subharti College of Pharmacy. The study was done on the albino Wistar rats. The Rats were in-housed for 2 weeks with free to normal diet and water at 12h/12 light and dark conditions at 23 ± 1○C.
Anti-inflammatory activity
The anti-inflammatory activity of the AN from different AN formulations was assessed in rats by the carrageenan-induced paw oedema method. The carrageenan (0.5w/v, 0.9% NaCl) solution was subcutaneously administered in the left hind paw to rats for induction of oedema before 30 min of the treatment. The rats were divided into four groups. Group A administered with pure AN oral (20 mg/kg) [Citation27]. The optimized AN-NS2-gel and pure AN-gel were administered topically into group B and group C (20 mg/kg). Group D is taken as disease control. At definite time intervals, the paw volume was analysed through plethysmometer, and the anti-inflammatory effect was determined by the given equation [Citation28].
(7)
(7)
Stability study of niosomes gel
This study was done as per ICH guidelines for 3 months. The optimised AN-NS2 gel was packed into vials and placed at 4○C and 25 ○C/60% RH in a stability chamber. The gel was taken at definite time intervals from the stability chambers and the pH, viscosity, spreadability, and drug content were analysed as per the described method in the characterisation section of the gel.
Results and discussion
Experimental design optimization
A total of 13 experimental runs with 1 centre and 12 factorial points (different compositions of NS) were obtained from the BBD. The results of VS and EE of all formulations were expressed in . , represent the 3D response surface graphs showing the effect of selected factors (span-60, CHO, hydration time) on VS and EE. and showed a detailed statistical model summary (p-value, R2, adjusted R2, predicted R2, adequate precision) and ANOVA for the best-fitted model. The linear, 2FI, and quadratic were examined by fitting the values of VS and EE. The results showed that the quadratic model was the best-fitted model for VS, and EE because it is statistically significant (p < 0.0001) fitted. The R2 values of the quadratic model for both responses were > 0.9, indicating a better correlation between the observed and predicted values than other models. Moreover, the lesser difference (<0.2) between the adjusted and predicted R2, insignificant lack of fit (p > 0.05), and high value of adequate precision value (> 4) of the best-fitted quadratic model of both responses assuring the suitability of the statistical models.
Figure 1. 3D response surface plots representing the effects of formulation variable on (A) Particle size and (B) Entrapment efficiency.
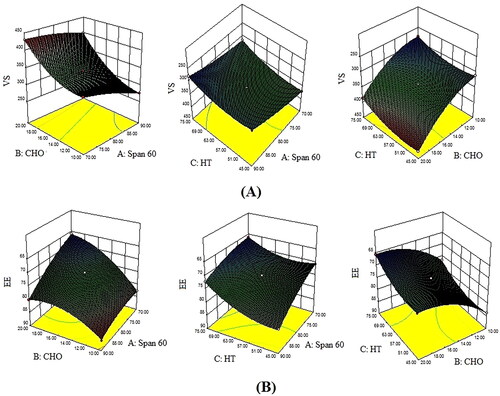
Table 2. Statistical model summary of selected dependent variables.
Table 3. Analysis of variance (ANOVA) test for the experimental response.
Effect of formulation factors on the VS of an-NS
The VS of all AN-NS formulations was in the range of 272.50 ± 12.49 nm (AN-NS2) to 430.21 ± 13.82 nm (AN-NS3) (). The polynomial equation for VS obtained from design expert software is given below
(8)
(8)
The polynomial equation and ANOVA () displayed the VS (Y1) was significantly affected by the Span 60 (A), CHO (B), hydration time (C), and their interaction (AB, AC, & BC), and the square root effect (A2, B2, & C2) at all levels. The positive coefficient of +54.69 for CHO supported a positive relationship with the VS, and the negative coefficients, that is, −23.58 and −18.79 for the span-60 and hydration time express an inverse relationship with the VS of AN-NS. CHO concentration showed a larger coefficient value suggesting that more substantial impact on VS than the span-60 and hydration time. On increasing the span-60 concentration, the VS of AN-NS was decreased because span-60 helps to form a dense network around the CHO and reduces interfacial tension between the lipid and the aqueous phase. These effects help in producing smaller vesicles and prevent their aggregation [Citation29]. CHO displayed a positive impact on the noisome size i.e. increasing the concentration of CHO the VS of AN-NS was increased. CHO is an amphipathic molecule, it imbibed itself into the NS bilayer with its hydrophilic head, oriented near the aqueous surface and aliphatic chain running analogous to the hydrocarbon chains in the bilayer membrane. CHO increases the chain order of the bilayer and strengthens the nonpolar tail of a span-60, thereby VS of AN-NS increased. On decreasing the CHO concentration, the VS of AN-NS decreased, because CHO may have made close packing of surfactant monomers. However, increasing CHO content may increase the hydrophobicity (log p = 7.02) and may impart disorder in the vesicular membrane, as well as establish a thermodynamic stable state [Citation30]. Hydration time increases the VS of NS decreases due to the disruption of the vesicle.
Effect of formulation factors on the EE of an in An-NS
The EE of AN in all AN-NS was in the range of 86.19 ± 1.51% (AN-NS2) to 65.04 ± 1.25% (AN-NS12) (). The polynomial equation for EE obtained from design expert software is given below
(9)
(9)
The polynomial equation revealed that the EE of AN was significantly affected by the Span 60 (A), CHO (B), hydration time (C) as well as interaction effect (AB, AC). Further, the square root of each independent factor (A2, B2, & C2) also showed a significant effect EE of AN in AN-NS. The positive coefficient (+4.22) of span-60 expressed a positive relationship, whereas negative coefficients (-5.59 and 3.32) of the CHO (B) and hydration time (C) showed an inverse relationship with EE of AN in AN-NS. The CHO has a larger coefficient value indicating a more considerable effect on the EE of AN than the span-60 and hydration time. Span-60 displays a positive impact on EE i.e. increasing the span-60 concentration of the EE of AN in AN-NS increased. It might be due to its high hydrophobicity with small critical packing parameters. As a result, only a small amount of CHO is required to achieve the optimal membrane curvature for lamellar (vesicular) structure [Citation30]. The highest % EE was found at 90.0 mg of span-60 and 10 mg of CHO. The second factor CHO displayed a positive effect on the EE of AN up to a certain limit, after that prominent negative effect was observed [Citation31]. These two contrary effects of CHO on EE were based on its amount and could be due to the following two opposing reasons: (a) as CHO concentration increase, the bilayer hydrophobicity and stability was increased, while permeability of vesicle falls, allowing hydrophobic drugs to efficiently trapped in bilayers of vesicles. This effect of CHO is responsible for the increment of EE. But in the present study, this effect was not prominent and displayed up to a certain limit of CHO amount. (b) In contrast, higher concentration of CHO may compete with the drug for packing space within the bilayer, thereby excluding the drug as the amphiphiles assemble into vesicles [Citation30]. This effect was responsible for the decrease of EE with CHO. Another investigation reported that increasing the CHO ratio above a certain limit reduces EE and can disrupt the regular linear structure of vesicular membranes [Citation32]. Increasing the hydration time, the EE of AN decreased, which could be due to drug leakage from the vesicle bilayer [Citation30].
Optimization and validation of RSM
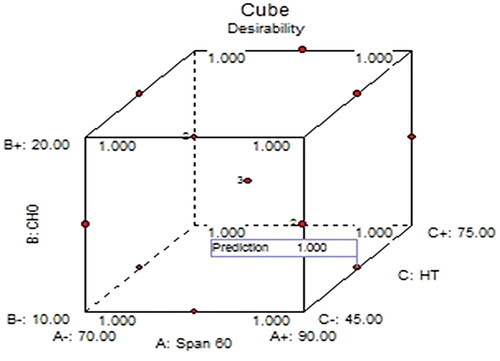
The point prediction method of the software was employed for the selection of optimized AN-NS. The optimized AN-NS (AN-NS2) had Span-60 (90 mg), CHO (10 mg), and hydration time (60 min). The AN-NS2 was prepared and analysed for the VS and EE. The experimental and predicted value of VS was found to be 272.56 ± 12.49 and 275.88 nm, with an acceptable prediction error of 1.2%. However, the experimental and predicted values of EE were found to be 86.19 ± 1.51% and 85.90%, with an acceptable prediction error (-0.33%). By converting all responses into a dimensionless value, BBD provided the desirability function. The value of the desirability function was found to be 1 as shown in . The acceptable value of prediction error (<5%) and desirability function, verified the accuracy, and validity of RSM [Citation33].
Figure 2. Optimisation by BBD showing the cube desirability graphs.
Vesicle size, PDI, zeta potential, and entrapment efficiency
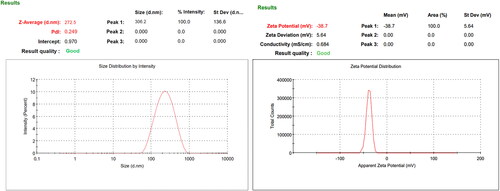
The VS of all AN-NS formulations was found to be 272.50 ± 12.49 nm (AN-NS2)- 430.21 ± 13.82 nm (AN-NS3). The VS and PDI of the AN-NS2 were found to be 272.50 ± 12.49 nm () and 0.249. The zeta potential of the AN-NS2 was found to be highly negative (-38.9 mV) () and revealed the high stability of the vesicle. The EE of the drug in the carrier system has several advantages i.e. increased stability, sustained release, and improved the targeting of drug at the desired site. Additionally, high entrapment can help to reduce the side effects by limiting the amount of release of the drug. The EE of all AN-NS formulations is 65.99 ± 5.27% (AN-NS12) − 86.19 ± 1.51% (AN-NS2). The EE of the AN-NS2 is 86.19 ± 1.51%. The high entrapment of a drug can have a significant impact on its therapeutic performance of the drug.
Figure 3. A) VS distribution graph, B) zeta potential graph of the an-NS2.
Fourier transform infra-red spectroscopy (FTIR)
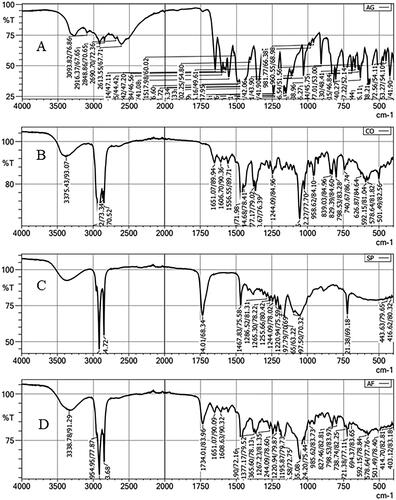
depicts the FTIR of pure AN, CHO, Span-60, and optimized AN-NS (AN-NS2). The pure AN showed the characteristic vibrational band at 3093.82 cm−1 (OH stretching), and 2910 cm−1(CH stretching). The intense stretching vibrational peaks at 1649.14 cm−1 and 1602.85 cm−1 are due to the C = O functional group [Citation34] (). The CHO spectra showed the vibration band at 3375.43 cm−1 (OH stretching), 2933.94 cm-1, 2866.22 cm−1 (CH stretching), 1665.90 cm−1, 1377.17 cm−1 (CH bending), 1244.09 cm−1, 1055.06 cm−1 (C-O bending) respectively (). FTIR spectra of span-60 exhibited the characteristic vibrational peaks at 2916.37 cm−1, 2848.36 (aliphatic -CH stretching), 1734.01 cm−1 (C = O, stretching), 1197.97 cm−1 (-CO-, stretching), and 712.38 cm−1 (-CH2- rocking) (). The AN vibrational band peaks are absent in the FTIR spectra of the AN-NS2 formulation () indicating the AN was encapsulated in the NS matrix. A similar type of observation was reported in diacerein niosomes [Citation35] and in rifampicin and ceftriaxone-encapsulated niosomes [Citation36].
Figure 4. FTIR spectra of A) an, B) CHO, C) sapan-60, D) an-NS2.
Development of the AN-NS incorporated gel
The optimized AN-NS (AN-NS2) was successfully transformed into the gel using different concentrations of chitosan as a gelling agent ().
Table 4. Composition of different an-NS gel and result of evaluation parameters.
Viscosity and pH
The viscosity of all AN-NS2 gel formulations was found to be 742 ± 12cps (AN-NS2G1, 1% chitosan) −3580 ± 25 cps (AN-NS2G5, 3% chitosan) at 50 rpm using spindle 05 at 25○C (). The concentration of chitosan increases the viscosity and strength of the gel was increased. It is due to the formation of a large network of interconnected chitosan molecules and increased hydrogen bonding between these molecules. The pH of the developed AN-NS2 gel formulations was determined by a digital pH metre and found in the range of 6.3 to 6.5 () (within the range of skin pH). It revealed that the formulation was compatible with the skin.
Drug content uniformity
displays the content uniformity of AN in all developed AN-NS2 gels. It was observed that the AN content in the AN-NS2 gel was uniformly distributed throughout the entire gel. The AN-NS2G5 showed lower AN content (97.03 ± 1.21%) than other batches of gels (AN-NS2G1- AN-NS2G4) because of the nonhomogeneous distribution of AN due to the high viscosity of the gel.
Spreadability
The spreadability of the gel over the skin is important over the skin because it affects the ability of the gel to deliver the drug. The spreadability of the gel directly depends upon the viscosity of the gel. A good spreadability of gel improves penetration, increases uniformity, and enhances absorption. The spreadability of the all-developed AN-NS2 gel was determined and the result was given in . The spreadability of the all-developed AN-NS2 gel was found in the range of 17.33 ± 0.25 g.cm/sec (AN-NS2G1, 1% chitosan) −7.74 ± 0.32 g.cm/sec (AN-NS2G5, 3% chitosan). The spreadability of gel decreases with increasing the concentration of gelling agent because it forms a tight physical network. As the concentration of chitosan increases the gel formed which has more crosslinking points making it more rigid and flexible and stiff gel formed.
On the basis of the optimum viscosity, spreadability, and consistency of the drug throughout the gel, the AN-NS2G4 was selected as an optimised NS gel () and used for future evaluation.
In vitro drug release
expresses the release profile of the different formulations (AN-NS2, AN-NS2G4, and AN-gel). The release of AN was found to be 80.02 ± 3.87% from AN-NS2, 67.64 ± 3.03% from AN-NS2G4, and 37.31 ± 2.87% from pure AN-gel respectively in 12h. The order of release of AN from different formulations is AN-NS2 > AN-NS2G4 > AN-gel. The AN-NS2, and AN-NS2G4 formulations showed dual-release behaviour, initial fast release (28.54% and 20.02% in 1h), and later sustained release (80.02 ± 3.87%, and 67.64 ± 3.03% up to 12h). The initial quick release might be due to surface deposited drug and sustained is due to the release of AN from the NS matrix and NS gel matrix. The AN-NS2G4 formulation exhibited significantly (p < 0.05) slow and sustained release than AN-NS2 because of the presence of an additional barrier (gel). AN-NS2G4 showed a significant (p < 0.05) higher release of AN than pure AN-gel because of the presence of CHO and surfactant. The surfactant and lipid increased the solubility of AN and decreased the interfacial tension among the aqueous and lipid phases, thereby more drug diffused from AN-NS2G4 gel than pure AN-gel. A similar type of release profile of the drug was reported in etodolac-loaded NS-gel [Citation37], resveratrol-loaded NS-gel [Citation38], fluconazole-encapsulated NS-gel [Citation39], and lacidipine-loaded NS-gel [Citation40]. The release mechanism of AN from the AN-NS2G4 was determined by fitting the release data in various kinetic release models and the result was shown in . The Korsmeyer-Peppas model is the best-fit model because it has the highest R2 value (R2= 0.9876) as compared to other models. The n = 0.52, (0.45 < n < 0.85), revealed the release of the drug by an anomalous transport mechanism.
Figure 5. A) Invitro release of an from the an-NS2, an-NS2G4, and an-gel, B) kinetic release models for an-NS2G4.
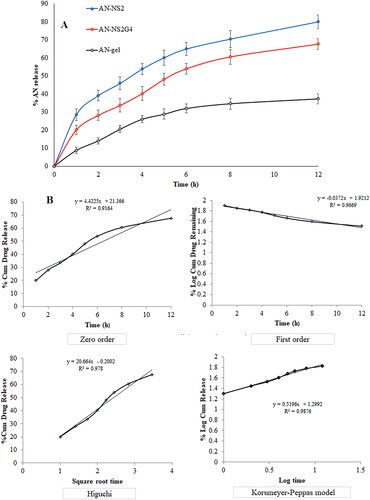
Figure 6. Ex-vivo rat skin permeation profile of an from the an-NS2G4 and an-gel.
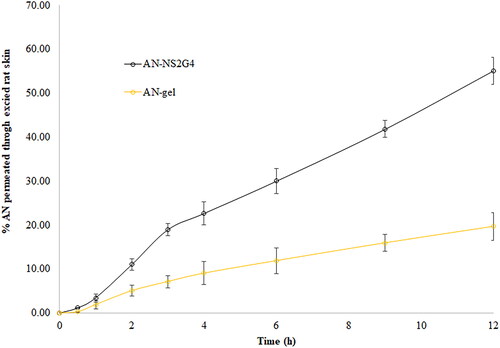
Ex vivo skin permeation study
displays the results of ex-vivo skin permeation of AN from AN-NS2G4 and AN-gel. The % skin permeation of AN form AN-NS2G4 and AN-gel were found to be 55.14 ± 3.10% and 19.68 ± 2.64%, respectively. The permeation flux of AN from AN-NS2G4 and AN-gel was calculated and found to be 218.80 ± 12.32 µg/cm2.h and 78.08 ± 6.60 µg/cm2.h, respectively. The Flux of AN from the AN-NS2G4 is significantly (p < 0.05) 2.80-fold higher than AN-gel. The APC of AN form AN-NS2G4 is 2.50-fold higher (1.09 × 10⁻³ cm/min) than plan AN-gel (4.34 × 10⁻⁴ cm/min). The enhancement ratio (ER) of AN-NS2G4 was found to be 2.50. The higher permeation, flux, and APC of AN from AN-NS2G4 is due to increased solubility of the AN in the NS ingredient (cholesterol and span-60) as well as due to the permeation enhancer property of span-60 [Citation41]. NS altered the lipid arrangement of the stratum corneum by adsorption and union of NS onto the skin surface, which would enhance drug permeation [Citation42,Citation43].
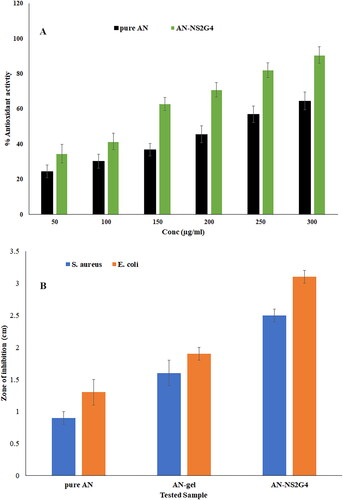
Figure 7. Shows the A) antioxidant graph of pure an and an-NS2G4, (*p < 0.05, **p < 0.001 than pure an), and, B) antibacterial activity of pure an, an-gel, and an-NS2G4 against S. aureus and E. coli.
In vitro anti-oxidant activity
The antioxidant potential of pure AN and AN-NS2G4 was determined and found to be 24.54 ± 3.54% −64.53 ± 5.03% and 34.65 ± 5.21% −90.72 4.74% at 50-300µg/ml (). The pure AN showed significant lesser antioxidant activity than AN-NS2G4 at each concentration. The concentration of AN increases the anti-oxidant potential increases for both formulations (pure AN and AN-NS2G4). AN-NS2G4 exhibited significantly (p < 0.05, p < 0.001) higher antioxidant activity (% inhibition of free radical) at each concentration than pure AN (). At the lower concentrations of AN (50 µg/ml), the pure AN and AN-NS2G4 showed 24.54% and 34.65% activity. However, the maximum anti-oxidant activity of AN from pure AN and AN-NS2G4 is 64.53% and 90.72% at 300 µg/ml. The significant high activity of AN in AN-NS2G4 is due to an increased solubility of AN by the NS ingredient. Similar type of finding was reported in luteolin-loaded nanovesicle [Citation44].
Antimicrobial activity
The anti-bacterial activity of AN-NS2G4 was done using the cup plate method and compared with pure AN and plan AN-gel against S. aureus and E. coli (). The ZOI of pure AN, AN-gel, and AN-NS2G4 against S. aureus was found to be 0.9 ± 0.1 cm, 1.6 ± 0.1 cm, and 2.2 ± 0.2 cm, respectively. However, ZOI of pure AN, AN-gel, and AN-NS2G4 against E. coli was found to be 1.3 ± 0.1 cm, 1.9 ± 0.2 cm, and 2.6 ± 0.1 cm respectively. The AN-NS2G4 showed significantly (p < 0.05) high ZOI as compared to pure AN and plan AN-gel against S. aureus and E. coli. In addition, the AN showed significantly more activity against E. coli as compared to S. aureus. The order of activity against S. aureus and E. coli is AN-NS2G4 > pure AN-gel > pure AN. The high activity of AN in AN-NS2G4 is due to increased solubility of AN in the niosomes ingredients (lipids and surfactant) and stability of NS. In addition, it is also due to the nanosize of the vesicle, which is easily diffused into the cell wall of the microorganism. The surfactant increased the solubility of AN in the AN-NS2G4, which provided a high amount of AN, leading to an increase in activity as compared to pure AN and plan AN-gel [Citation3].
Anti-inflammatory activity
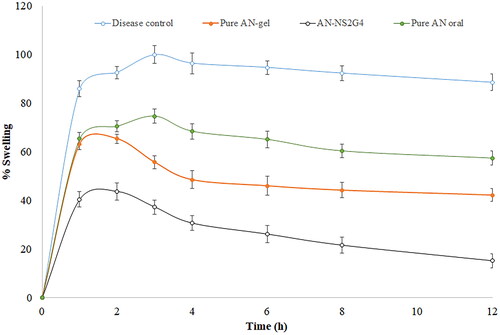
The anti-inflammatory activity of pure AN-oral, AN-gel, and AN-NS2G4 gel in carrageenan-induced inflammation rats was determined and the result was expressed graphically in . The result showed the paw volume (oedema) significantly decreased after treatment with NS formulation, which established the extensive effect of AN. It was found that the disease control group D showed the maximum swelling (inflammation, 99.93 ± 3.65%) after 3h of carrageenan administration. However, the pure AN-oral, AN-gel, and AN-NS2G4-gel treated groups exhibited a significant reduction in swelling (p < 0.001), that is, 74.63 ± 2.87% (3h), 65.34 ± 1.98% (2h), and 43.65 ± 3.54% (2h) respectively as compared to the disease control group. The % swelling (inflammation) of AN-oral, AN-gel, and AN-NS2G4-gel was found to be 57.34 ± 2.92%, 42.21 ± 2.62%, and 15.15 ± 2.86%, respectively in 12h of the study. The AN-NS2G4-gel showed 2.79-fold higher anti-inflammatory activity than AN-gel and 3.78-fold higher than pure AN-oral. It revealed that AN-NS2G4-gel exhibited significantly (p < 0.0001) high inhibition of edoema as compared to AN-oral, AN-gel. The higher activity of AN with NS is due to the nanosize the of vesicle and the presence of permeation enhancers in the NS gel. The NS can easily cross the stratum corneum layer of the skin and reach into the systemic circulation. A similar type of observation was reported in Lornoxicam-loaded NS gel (about 25% swelling reduction) [Citation44] and colchicine-loaded NS gel (about 43% swelling reduction) [,Citation45].
Figure 8. Shows the anti-inflammatory activity of pure an-gel, an-oral and an-NS2G4 in wistar albino rats. Bar showing the SD, **p < 0.001 compared diseases control ***p < 0.0001 compared to pure an-oral.
Stability study of niosomes gel
shows the stability study result of the AN-NS2G4 at 4 ± 1○C and 25 ± 2○C. The AN-NS2G4 did not show any changes in physical appearance and pH (compatibility with skin pH). There is no significant (p > 0.05) variation was detected in viscosity, spreadability, and drug content at both conditions revealing that AN-NS2G4 was stable during the 3 months of study.
Table 5. Storage stability study results of optimised gel (an-NS2G4) at different storage conditions.
Conclusion
The AN-loaded NS was successfully prepared by thin film hydration using cholesterol and span-60. The NS was further optimized by BBD software and the independent variable significantly affected on VS and EE of the AN into AN-NS. NS showed small VS and high EE due to the presence of span-60 because it has a low HLB value and higher hydrophobicity. FTIR study showed AN was encapsulated into the NS matrix. Further optimized AN-NS was incorporated successfully into chitosan gel. AN-NS gel showed excellent viscosity (2110 ± 14cps) and good spreadability (10.40 ± 0.21 g.cm/sec). AN-NS gel showed a sustained release of AN (67.64 ± 3.03% in 12h) followed by the Korsmeyer Peppas kinetic release model with an anomalous transport release mechanism. Ex-vivo permeation study revealed that significantly enhances the permeation of AN from AN-NS gel. The AN-NS gel displayed significant (p < 0.05) improved antioxidant activity as well as the enhanced antibacterial effect of AN. It also displayed a significant (p < 0.0001) high inhibition of inflammation (%) in carrageenan-induced paw oedema in rats than pure AN-gel. So, concluded that NS-based gel can be an effective alternative carrier of the AN for topical delivery to enhance penetration and therapeutic efficacy of the drug.
Author contributions statement
Conception and design: Omar Awad Alsaidan, Ameeduzzafar Zafar, Mohd Yasir; Analysis and interpretation of the data: Omar Awad Alsaidan, Ameeduzzafar Zafar, Lubhan Singh, Mohammad Khalid; Rayan Hamood Al-Ruwaili, Sami I. Alzarea; Drafting of the paper: Ameeduzzafar Zafar, Omar Awad Alsaidan; Mohd Yasir, Rayan Hamood Al-Ruwaili; Revising it critically for intellectual content: Sami I. Alzarea, Mohammad Khalid, Aseel Awad Alsaidan, Lubhan Singh; Final approval of the version to be published; Omar Awad Alsaidan, Ameeduzzafar Zafar, Aseel Awad Alsaidan, and that all authors agree to be accountable for all aspects of the work.
Acknowledgment
The authors extend their appreciation to the Deputyship for Research & Innovation, Ministry of Education, Saudi Arabia for funding this research work through project number 223202.
Disclosure statement
No potential conflict of interest was reported by the authors.
Data availability statement
All the data is present in the manuscript and available on request
Additional information
Funding
References
- Chandrasekara A, Shahidi F. Herbal beverages: bioactive compounds and their role in disease risk reduction - A review. J Tradit Complement Med. 2018;8(4):451–458. doi: 10.1016/j.jtcme.2017.08.006.
- Shukla S, Gupta S. Apigenin: a promising molecule for cancer prevention. Pharm Res. 2010;27(6):962–978. doi: 10.1007/s11095-010-0089-7.
- Imam SS, Alshehri S, Altamimi MA, et al. Formulation of chitosan-coated apigenin bilosomes: in vitro characterization, antimicrobial and cytotoxicity assessment. Polymers (Basel). 2022;14(5):921. doi: 10.3390/polym14050921.
- Telange DR, Patil AT, Pethe AM, et al. Formulation and characterization of an apigenin-phospholipid phytosome (APLC) for improved solubility, in vivo bioavailability, and antioxidant potential. Eur J Pharm Sci. 2017;108:36–49. doi: 10.1016/j.ejps.2016.12.009.
- Yan X, Qi M, Li P, et al. Apigenin in cancer therapy: anti-cancer effects and mechanisms of action. Cell Biosci. 2017;7(1):50. doi: 10.1186/s13578-017-0179-x.
- Hong S, Dia VP, Zhong Q. Synergistic anti-inflammatory activity of apigenin and curcumin co-encapsulated in caseins assessed with lipopolysaccharide-stimulated RAW 264.7 macrophages. Int J Biol Macromol. 2021;193(Pt A):702–712. doi: 10.1016/j.ijbiomac.2021.10.153.
- Jiang J, Tang T, Peng Y, et al. Research progress on antidiabetic activity of apigenin derivatives. Med Chem Res. 2022;31(11):1831–1841. doi: 10.1007/s00044-022-02933-8.
- Zhang J, Liu D, Huang Y, et al. Biopharmaceutics classification and intestinal absorption study of apigenin. Int J Pharm. 2012;436(1-2):311–317. 2012doi: 10.1016/j.ijpharm.2012.07.002.
- Griffiths LA, Smith GE. Metabolism of apigenin and related compounds in the rat. Metabolite formation in vivo and by the intestinal microflora in vitro. Biochem J. 1972;128(4):901–911. doi: 10.1042/bj1280901.
- Chen Z, Kong S, Song F, et al. Pharmacokinetic study of luteolin, apigenin, chrysoeriol and diosmetin after oral administration of flos chrysanthemi in rats. Fitoterapia. 2012;83(8):1616–1622. doi: 10.1016/j.fitote.2012.09.011.
- Ranade VV. Drug delivery systems. 6. Transdermal drug delivery. J Clin Pharmacol. 1991;31(5):401–418. doi: 10.1002/j.1552-4604.1991.tb01895.x.
- El Menshawe SF, Aboud HM, Elkomy MH, et al. A novel nanogel loaded with chitosan decorated bilosomes for transdermal delivery of terbutaline sulfate: artificial neural network optimization, in vitro characterization and in vivo evaluation. Drug Deliv Transl Res. 2020;10(2):471–485. doi: 10.1007/s13346-019-00688-1.
- Ananth P, Koland M. Topical delivery of fenugreek seed extract loaded solid lipid nanoparticles based hydrogels for alopecia. JPRI. 2021;202133(40A):231–241. doi: 10.9734/jpri/2021/v33i40A32239.
- Altamimi MA, Hussain A, Alshehri S, et al. Development and evaluations of transdermally delivered luteolin loaded cationic nanoemulsion: in vitro and ex vivo evaluations. Pharmaceutics. 2021;13(8):1218. doi: 10.3390/pharmaceutics13081218.
- Okonogi S, Riangjanapatee P. Physicochemical characterization of lycopene-loaded nanostructured lipid carrier formulations for topical administration. Int J Pharm. 2015;478(2):726–735. doi: 10.1016/j.ijpharm.2014.12.002.
- Mitri K, Shegokar R, Gohla S, et al. Lipid nanocarriers for dermal delivery of lutein: preparation, characterization, stability and performance. Int J Pharm. 2011;414(1-2):267–275. doi: 10.1016/j.ijpharm.2011.05.008.
- El-Ridy MS, Yehia SA, Mohsen AM, et al. Formulation of niosomal gel for enhanced transdermal lornoxicam delivery: in-Vitro and in-Vivo evaluation. Curr Drug Deliv. 2018;15(1):122–133.
- He W, Guo X, Xiao L, et al. Study on the mechanisms of chitosan and its derivatives used as transdermal penetration enhancers. Int J Pharm. 2009;382(1-2):234–243. doi: 10.1016/j.ijpharm.2009.07.038.
- Thanou M, Verhoef JC, Junginger HE. Chitosan and its derivatives as intestinal absorption enhancers. Adv Drug Deliv Rev. 2001;50(Suppl 1)(1):S91–S101. doi: 10.1016/s0169-409x(01)00180-6.
- Nagarwal RC, Singh PN, Kant S, et al. Chitosan coated PLA nanoparticles for ophthalmic delivery: characterization, in-vitro and in-vivo study in rabbit eye. J Biomed Nanotechnol. 2010;6(6):648–657. doi: 10.1166/jbn.2010.1168.
- Beg S, Hasnain MS, Rahman M, et al. Introduction to quality by design (QbD): fundamentals, principles, and applications. Elsevier: Amsterdam, the Netherlands, 2019; ISBN 9780128157992.
- Zafar A, Awad Alsaidan O, Alruwaili NK, et al. Formulation of intranasal surface engineered nanostructured lipid carriers of rotigotine: full factorial design optimization, in vitro characterization, and pharmacokinetic evaluation. Int J Pharm. 2022;627:122232. doi: 10.1016/j.ijpharm.2022.122232.
- Yadav P, Rastogi V, Verma A. Application of Box–Behnken design and desirability function in the development and optimization of self-nanoemulsifying drug delivery system for enhanced dissolution of ezetimibe. Futur J Pharm Sci. 2020;6(1):7. doi: 10.1186/s43094-020-00023-3.
- Manca ML, Manconi M, Nacher A, et al. Development of novel diolein-niosomes for cutaneous delivery of tretinoin: influence of formulation and in vitro assessment. Int J Pharm. 2014;477(1-2):176–186. doi: 10.1016/j.ijpharm.2014.10.031.
- Bhalekar MR, Padher S, Ladkat S. Paranjape evaluation of carboxymethyl xyloglucan as SPF booster in oxybenzone cream. International Journal of Applied Research. 2017;3(5):813–816.
- Shen PT, Chiu SW, Chang JY, et al. Formation and characterization of hydrogenated soybean lecithin/TPGS nano-dispersions as a potential carrier for active herbal agents. Colloids Surf. A Physicochem. Eng. Aspects. 2021;611:125796. doi: 10.1016/j.colsurfa.2020.125796.
- Sadraei H, Asghari G, Khanabadi M, et al. Anti-inflammatory effect of apigenin and hydroalcoholic extract of dracocephalum kotschyi on acetic acid-induced colitis in rats. Res Pharm Sci. 2017;12(4):322–329. doi: 10.4103/1735-5362.212050.
- Sarigullu Ozguney I, Yeşim Karasulu H, Kantarci G, et al. Transdermal delivery of diclofenac sodium through rat skin from various formulations. AAPS PharmSciTech. 2006;7(4):88. 20doi: 10.1208/pt070488.
- Lee SC, Lee KE, Kim JJ, et al. The effect of cholesterol in the liposome bilayer on the stabilization of incorporated retinol. J Liposome Res. 2005;15(3-4):157–166. doi: 10.1080/08982100500364131.
- Moghddam SR, Ahad A, Aqil M, et al. Formulation and optimization of niosomes for topical diacerein delivery using 3-factor, 3-level Box-Behnken design for the management of psoriasis. Mater Sci Eng C Mater Biol Appl. 2016;69:789–797. doi: 10.1016/j.msec.2016.07.043.
- Akbari V, Abedi D, Pardakhty A, et al. Release studies on ciprofloxacin loaded non-ionic surfactant vesicles. Avicenna J Med Biotechnol. 2015; Apr-Jun7(2):69–75.
- Wagh VD, Deshmukh OJ. Itraconazole niosomes drug delivery system and its antimycotic activity against Candida albicans. ISRN Pharm. 2012;2012:653465. doi: 10.5402/2012/653465.
- Alhalmi A, Amin S, Khan Z, et al. Nanostructured lipid Carrier-Based codelivery of raloxifene and naringin: formulation, optimization, in vitro, ex vivo, in vivo assessment, and acute toxicity studies. Pharmaceutics. 2022;14(9):1771. doi: 10.3390/pharmaceutics14091771.
- Huang Y, Zu Y, Zhao X, et al. Preparation of inclusion complex of apigenin-hydroxypropyl-β-cyclodextrin by using supercritical antisolvent process for dissolution and bioavailability enhancement. Int J Pharm. 2016;511(2):921–930. doi: 10.1016/j.ijpharm.2016.08.007.
- Khan MI, Madni A, Hirvonen J, et al. Ultrasonic processing technique as a green preparation approach for Diacerein-Loaded niosomes. AAPS PharmSciTech. 2017;18(5):1554–1563. doi: 10.1208/s12249-016-0622-z.
- Khan DH, Bashir S, Khan MI, et al. Formulation optimization and in vitro characterization of rifampicin and ceftriaxone dual drug-loaded niosomes with high energy probe sonication technique. J Drug Delivery Sci Technol. 2020;58:101763. doi: 10.1016/j.jddst.2020.101763.
- Shilakari Asthana G, Asthana A, Singh D, et al. Etodolac containing topical niosomal gel: formulation development and evaluation. J Drug Deliv. 2016;2016:9324567–9324568. doi: 10.1155/2016/9324567.
- Negi P, Aggarwal M, Sharma G, et al. Niosome-based hydrogel of resveratrol for topical applications: an effective therapy for pain related disorder(s). Biomed Pharmacother. 2017;88:480–487. doi: 10.1016/j.biopha.2017.01.083.
- Fetih G. Fluconazole-loaded niosomal gels as a topical ocular drug delivery system for corneal fungal infections. J Drug Delivery Sci Technol. 2016;35:8–15. doi: 10.1016/j.jddst.2016.06.002.
- Qumbar M, Ameeduzzafar , Imam SS, Ali J, Ahmad J, Ali A. Formulation and optimization of lacidipine loaded niosomal gel for transdermal delivery: in-vitro characterization and in-vivo activity.Biomed Pharmacother. 2017; 93:255–266. doi: 10.1016/j.biopha.2017.06.043.
- ZaidAlkilani A, Hamed R, Abdo H, et al. Formulation and evaluation of Azithromycin-Loaded niosomal gel: optimization, in vitro studies, rheological characterization, and cytotoxicity study. ACS Omega. 2022;7(44):39782–39793. doi: 10.1021/acsomega.2c03762.
- Qushawy M, Nasr A, Abd-Alhaseeb M, et al. Design. Optimization and characterization of a transfersomal gel using miconazole nitrate for the treatment of candida skin infections. Pharmaceutics. 2018;10(1):26. doi: 10.3390/pharmaceutics10010026.
- Shah HS, Gotecha A, Jetha D, et al. Gamma oryzanol niosomal gel for skin cancer: formulation and optimization using quality by design (QbD) approach. AAPS Open. 2021;7(1):9. 2021). doi: 10.1186/s41120-021-00041-2.
- Imam SS, Alshehri S, Altamimi MA, et al. Formulation and evaluation of Luteolin-Loaded nanovesicles: in vitro physicochemical characterization and viability assessment. ACS Omega. 2022;7(1):1048–1056. doi: 10.1021/acsomega.1c05628.
- Elsewedy HS, Younis NS, Shehata TM, et al. Enhancement of anti-Inflammatory activity of optimized niosomal colchicine loaded into jojoba Oil-Based emulgel using response surface methodology. Gels. 2021;202; 8(1):16. doi: 10.3390/gels8010016.