
 ?Mathematical formulae have been encoded as MathML and are displayed in this HTML version using MathJax in order to improve their display. Uncheck the box to turn MathJax off. This feature requires Javascript. Click on a formula to zoom.
Abstract
A reliability analysis of an automated yogurt production line was carried out for all machines and the entire line level. Trend and serial correlation tests validated the assumption of independence and identical distribution of the failure data was conducted. The determination of the theoretical distribution parameters that had the best fit to the failure data was made. Furthermore, the reliability and failure rate models for the entire production line were developed. The models could prove to be a useful tool, both to assess the current conditions and to predict the reliability for upgrading the operations management policies of the yogurt line. It was found that: (a) the Weibull distribution provided the best fit for the yogurt production line to describe the time between failures, (b) the failure rate of the production line increased implying that the currently applied maintenance strategy is not adequate and must be upgraded in the near future, and (c) to avoid losses related to quality and productivity, the reliability must be improved initially on the pasteurizing boiler, and secondly on the filling machine.
Introduction
The dairy sector is one of the most important in terms of economic growth within the food market. Manufacturers are focusing on applied reliability analysis of their production lines to increase the productivity and the efficiency for improving competitiveness. Although ensuring an adequate reliability level is of great importance for industrial applications on food production lines, reliability itself is quite complex and there are numerous interlocking variables to be taken into account when one has to evaluate and achieve various reliability levels. Inadequate reliability leads to several problems such as high maintenance costs, unsafe conditions, and eventual downgrading of the quality of the products. It takes a long time for a company to establish a reputation for reliability but only a short time for its reputation to be ruined (Croarkin & Tobias, Citation2005).
A number of methods, all with reference to reliability, availability, maintainability, and safety analysis, have been developed and can make a significant contribution to the performance improvement of both industrial and non-industrial complex systems (Regattieri, Manzini, & Battini, Citation2010). The literature includes a huge number of interesting methods, linked for example to preventive maintenance models. These models can determine the best frequency of maintenance actions, or the optimization of spare parts consumption or the best management of their operating costs (Manzini, Regattieri, Pham, & Ferrari, Citation2009).
In this study, a reliability analysis was conducted for the yogurt production line. The best fit of the failure data among the common theoretical distributions was found and the corresponding parameters were identified. Moreover, the reliability and hazard rate models for the entire production line were calculated. The latter can potentially be useful tools to assess the current situation, and, more importantly, to predict reliability for upgrading the operation management of the yogurt production line and other relevant production lines.
The rest of this paper is organized as follows: (a) in Section 2, the literature review was presented, (b) in Section 3, the yogurt production system was described, (c) the research methodology was presented in Section 4, (d) in Section 5, the results with the reliability analysis were reported, (e) in Section 6, the results of the case study are discussed, and finally, (f) the conclusions were drawn in Section 7.
Literature review
There is a vast literature on reliability, maintainability, and maintenance, including many articles and books (Blischke & Murthy, Citation2003; Gupta & Bhattacharya, Citation2007; Jalali & Forouhandeh, Citation2011; Usher, Roy, & Parsaei, Citation1998). Wang, Loman, and Vassiliou (Citation2004) reported that one of the main purposes of reliability and availability analysis is to identify the weaknesses of the system and to quantify the potential impact of failure. Reliability and availability are appropriate approaches for measuring product quality, product performance, and cost effectiveness of the product itself (Goetz & Villa, Citation1998). Tsarouhas (Citation2012) reviewed reliability, availability, and maintainability analysis in the food industries, and identified the critical points of the production systems that should improve the operational performance and the maintenance effectiveness. Hajeeh and Chaudhuri (Citation2000) worked on reliability and availability assessment of reverse osmosis by analyzing its failure behavior and downtime patterns. Markeset and Kumar (Citation2001) discussed the application of reliability, maintainability, and risk analysis methods to minimize the life cycle cost of the system. Kiureghian, Ditlevson, and Song (Citation2007) analyzed the availability, reliability, and downtime of systems with repairable components. Singh and Swaminathan (Citation2002) reported a methodology for determining sample sizes for system availability.
The serial configuration is the most commonly encountered reliability block diagram in engineering practice i.e. industrial systems, production lines, etc. In a serial configuration, all the consisting components of the system should be operating to maintain the required operation of the system (Blischke & Murthy, Citation2000; Dhillon, Citation2006; Meeker & Escobar, Citation1998). Thus, failure of any one component of the system will cause failure of the whole system (Tsarouhas, Citation2010). The system reliability in a series configuration is less than the reliabilities of each component (Stapelberg, Citation2009). Kardon and Fredendall (Citation2002) developed a model that allows consideration of not only the total maintenance cost but also the overall probability of a serial system breakdown when determining the time intervals between preventive maintenance activities. Ruan and Sun (Citation2006) presented an exact method for cost minimization problems in series reliability systems with multiple component choices.
The available literature referring to the food industry is quite limited. Tsarouhas, Varzakas, and Arvanitoyannis (Citation2009) and Tsarouhas, Arvanitoyannis, and Varzakas (Citation2009) developed reliability and maintainability analysis for strudel and feta cheese production line at machine, workstation, and entire line level. Moreover, Tsarouhas, Arvanitoyannis, and Ampatzis (Citation2009) investigated the reliability and maintainability in a Greek juice bottling medium size enterprise. Wang, Hu, and Li (Citation2010) presented a study to determine the buffer capacity in dairy filling and packing lines through transient analysis. Tsarouhas and Arvanitoyannis (Citation2010a) assessed the operation management of a beer-packaging line based on field failure data. Furthermore, Tsarouhas and Arvanitoyannis (Citation2010b) analyzed the reliability and maintainability of a bread-production line. Tsarouhas and Arvanitoyannis (Citation2011) conducted quantitative analysis on the management of a peach-canning production line. They pointed out that the failure times follow the logistic distribution whereas the repair times comply with the Weibull distribution, and the repair rate of failure increases, thereby implying that the maintenance staff expertise increases with time. In a recent study, Tsarouhas and Arvanitoyannis (Citation2012) carried out reliability and maintainability analysis on a limoncello production line by applying statistical techniques on field failure data.
Description of the system
Yogurt production process
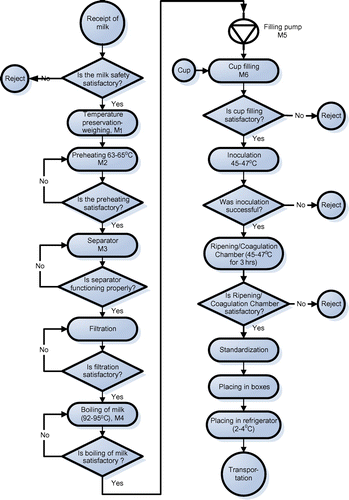
The yogurt production process begins with receiving milk from local or other cooperating regional producers and its transportation in a tank (see Figure ). The milk is weighed and then transferred to an auto-cooling storage tank (M1). The entire process occurs as a continuous flow system. A pre-heating stage follows where the milk is pasteurized within few seconds at 63–65 °C in the heat exchanger (M2) and then moves to a separator (M3) to standardize the fat content using centrifugation. Then, the milk moves to a pasteurizing boiler (M4) – production tank – where it is boiled to kill any contaminating micro-organisms. At the same time, yogurt rennet is added to speed up the coagulation. The filling of plastic containers (cups) in the filler machine (M6) with milk-yogurt takes place using a filling pump (M5). The last step for yogurt production is the ripening-cooling where the filled cups move to the ripening/incubation chamber for three hrs and then to the rapid cooling chamber for two more hours. Once the production run is completed, the cleaning of all machines involved starts automatically using cleaning in place-CIP (M7). The latter lasts for 5–7 min.
Figure 1. Flow diagram of yogurt production line where CIP (M7) is applied for cleaning purposes to all machines involved in this process.
Operation management of the yogurt production line
The yogurt production line contains seven machines in series. In a serial configuration, all machines of the production line should be functioning to maintain the proper operation of the system. Thus, the failure of any machine may potentially cause failure in the entire system. Failure and repair data for the yogurt production line were collected from the files of the maintenance staff (mechanical and electrical) at the end of each shift. The records included the failures occurring per shift, the action taken to repair the failure, the downtime, and the exact time of failure. Apart from the failures occurring, the line stopped whenever alarm signals (related to quality and/or potential safety problem) were recorded. Therefore, the times related to these activities were also included in the failure data.
The failure data for the yogurt production line were also collected from the files of the technical department at the end of each shift, and a total of 759 failures were recorded. The line operates in one eight-hour shift each workday to include 6 h for yogurt production. For the rest of the time (2 h), the line is cleaned and prepared for the following day (i.e. raw materials, packing materials, etc.).
The currently applied maintenance policy of the yogurt line is both corrective (unscheduled and carried out in case of failure) and preventive maintenance (scheduled and performed periodically); this procedure requires immediate action by the maintenance staff to restore the machine into an operational state. This maintenance policy may include any or all the following steps: identification, localization and diagnosis of faults, correction actions (disassemble, remove, replace, reassemble, and adjust), and operation checkout. The corrective maintenance is applied while the line is running.
Methodology
Failures data i.e. time between failures (TBFs) are the backbone of reliability studies because they provide invaluable information to concerned professionals such as reliability engineers, design engineers, and managers (Dhillon, Citation1999). Thus, the statistical analysis to describe the basic features of the failure data for TBFs for all the machines and the entire production line were analyzed with respect to theoretical distributions. The maximum likelihood and goodness-of-fit test was used to determine the best theoretical distribution to represent each machine and line failure data. The TBF of equipment is defined as the time that elapses from the moment the equipment is turned on and starts operating after a failure, until the moment it goes down again and stops operation due to a new failure. The TBFs are recorded in minutes. A quantitative analysis (i.e. descriptive statistics) of the failure data for the production line was obtained. The descriptive statistics have been done using the software package MINITAB. Thus, it is possible to extract the minimum and the maximum value of the sample, mean, standard deviation (StDev), coefficient of variation (CoefVar), skewness, and kurtosis of the failure data at machine and line level. The StDev of the random variable is defined as the square root of the variance, and is often used in place of the variance to describe the distribution spread. Since the CoefVar of a random variable is defined as the ratio of the StDev over the mean of the random variable, it is a dimensionless measure of the variability of the random variable. Skewness and kurtosis are statistics that characterize the shape and symmetry of the distribution. Skewness is a measure of the degree of asymmetry of a distribution while kurtosis is a measure of whether the data appear as peaks or are flat. A normal distribution will have kurtosis and skewness values equal to zero.
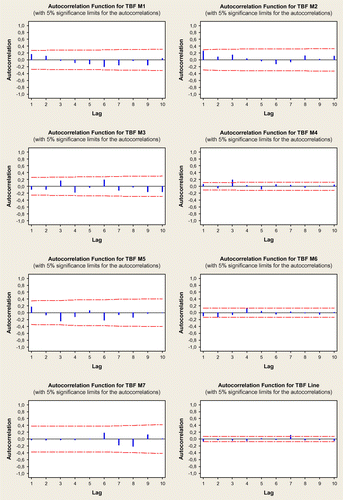
After collection, sorting, and classification of the ‘data’, the validation of the assumption for independent and identically distributed (IID) nature of the TBF data of each machine and the entire line must be checked. The validations of the trend for the TBF at machine and line level are displayed in Table . Moreover, the correlation of the failure data is shown in Figure .
Figure 2. Correlation diagrams for the TBFs at machine and line level for yogurt production line.
Results
Reliability analysis
Reliability is the probability that the machine or the entire line will perform a required function, under specific operating conditions, for a given period of time t. The TBF of the line is defined with T (or machine); T ≥ 0, then the reliability can be expressed as,R(t) = P(T ≥ t). Moreover, the unreliability function, Q(t), is defined as the probability of failure in t, Q(t) = 1 − R(t) = P(T ≤ t). In reliability theory, the hazard or failure rate function is indicated as, where f(t) is the probability density function (PDF) of the failure distribution.
The yogurt production line for TBF follows the Weibull distribution (see Table ), and it is fair to indicate T as the continuous random variable representing the failure time. The PDF of the Weibull distribution is:(1)
(1)
where the parameter β is the shape parameter. A value of β > 1 signifies an increasing failure rate (or hazard rate) function, whereas a value of β < 1 signifies a decreasing failure rate function. When β = 1, the failure rate function is constant and the Weibull distribution is identical to the exponential distribution (Ebeling, Citation1997). The scale parameter of the Weibull distribution, denoted by θ, influences both the mean and the spread of the distribution. As θ increases, the reliability at a given point in time increases, whereas the slope of the hazard rate decreases.
The reliability and the unreliability of the yogurt production line are depicted by Equations (Equation2(2)
(2) ) and (Equation3
(3)
(3) ), respectively
(2)
(2)
(3)
(3)
The hazard or failure rate function of the line is given by(4)
(4)
Consequently, the Equations (Equation2(2)
(2) )Equation(3)
(3)
(3) –(Equation4
(4)
(4) ) are used to calculate the reliability, unreliability, and the failure rate of the yogurt production line based on the Weibull distribution per time t. The parameters β and θ are 1.41453 and 207.909, respectively (see Table ). Therefore, the reliability model and the failure rate model of the yogurt production line from Equations (Equation2
(2)
(2) ) and (Equation4
(4)
(4) ) are as follows:
(5)
(5)
(6)
(6)
Thus, these models were used to determine the operational behavior as a line performance evaluation indicator.
Discussion
To obtain quantitative analysis of the failure data for the yogurt production line, the descriptive statistics of the basic features of the TBF data are given in Table , and the following observations were made: (a) in the yogurt production line, the mean TBF is about 190 min (or approximately 3 h), meaning that about every 3 h of operation there is a failure which occurs on the production line. (b) The coefficient of variance at machine level is around one, whereas at line level it is less than one (.69). In other words, although the machines have the greatest StDevs, the production line has less variability relative to its mean. (c) The minimum mean TBFs are observed at the pasteurizing boiler (M4) with 467.6 min, and at the filling machine (M6) with 650 min. Therefore, the maintenance staff must initially concentrate on these machines, and (d) the distribution of TBF at line level display positive skew values, this indicates that the tail on the right side is longer than on the left side. Thus, many failures in the production line have low values for TBFs, while few failures have high values for TBFs. The distribution of TBF presented borderline mode < median < mean.
Table 1. Descriptive statistics: the minimum and the maximum value of the sample (Count), mean, standard deviation (StDev), coefficient of variation (CoefVar), skewness, and kurtosis of the failure data for TBF (in min) at machine and entire line levels.
In Table , the trend test results for the yogurt production line are shown, with the correlation diagrams for the failure data exhibited in Figure . These show that all machines and the entire line are free from trend and serial correlation. Therefore, the failure data for the yogurt production line are IID.
Table 2. Calculation of the test statistic χ2 for TBFs at machine and line level.
To identify the distributions of the trend-free failure data between several theoretical distributions (i.e. Weibull, lognormal, exponential, normal distribution etc.), the maximum likelihood estimation method was applied per each distribution and assessed using the Anderson–Darling goodness-of-fit test. The Anderson–Darling statistics of several theoretical distributions for TBF based on failure data from all machines and the entire line are summarized in Table . The smallest statistic value indicates the distribution which best fits the data, thereby making clear that the TBF at line level follows the Weibull distribution.
Table 3. The Anderson–Darling statistics for TTB at machine and line level. The smaller the statistic value, the better the model fitting (i.e. in the row for M1, the lowest value is .462 belonging to the loglogistic distribution).
The hazard plots for the yogurt production line at machine and the entire line level are displayed in Figure . An increasing failure rate at the pasteurizing boiler (M4), the filling machine (M6), and at the entire production line was observed. Therefore, this suggests that the maintenance policy should be initially focused on these machines to improve the reliability of the entire production line.
Figure 3. Hazard function for time between failures (TBFs) at machine and line level are shown graphically in conjunction with the appropriate distributions and their statistics.
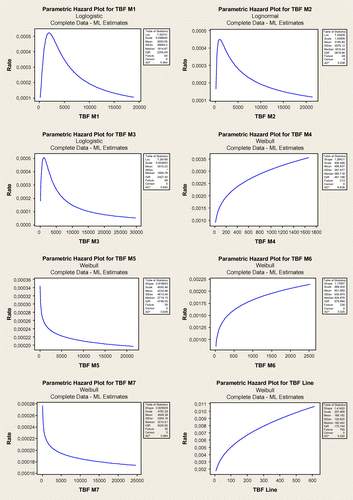
Table displays the results derived for TBF at line level based on Weibull distribution with shape parameter β = 1.41453 and scale parameter θ = 207.909. Quartiles are values that divide the failure data into four equal parts. With them, one can quickly evaluate a data-set’s spread and central tendency. From this table, the following observations were made; (a) 25% of the failures (first quartile, Q1) are less than or equal to 86.16 operating minutes, 75% (third quartile, Q3) of the failures are less than or equal to 261.91 operating minutes whereas the time when it spans the middle 50% of the failures (interquartile range: IQR = Q3 − Q1) is 175.74 operating minutes. (b) From the percentiles with 95% confidence interval, it is evident that 30% of all the failures which are expected to occur amounts to 100 min.
Table 4. Distribution analysis of TBF applying the Weibull distribution for the yogurt production line, with 95% confidence interval (CI).
The reliability diagrams for all the machines and the entire line are shown in Figure . The optimal maintenance interval with the expected reliability level can be estimated, for example to achieve 80% reliability for the heat exchanger (M2), the maintenance must be carried out in less than 720 min, thereby meaning that the maintenance must be carried out every two working days. Moreover, RelLine (240) = .2937 means the probability that the system will not fail in 240 min of operation is .2937.
Figure 4. Reliability diagram for all machines and the entire system for yogurt production line.
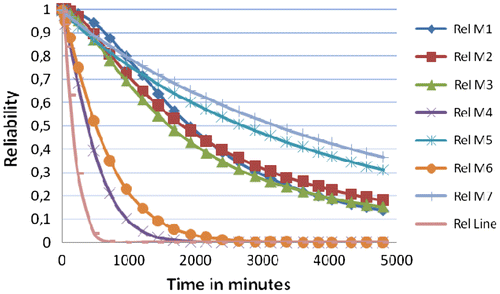
The reliability is calculated for all machines and the entire line at different time intervals in Table . Some conclusions from Table include the following; (a) the reliability of the line after 10 min of operation is 98.64%, after 60 min is 84.16%; whereas after 120 min of operation, it drops sharply to 63.15%; (b) the highest reliability values are recorded for CIP (M7), the filling pump (M5), and the auto-cooling tank (M1); and (c) the lowest reliability values are shown at the pasteurizing boiler (M4), the filling machine (M6), and the separator (M3).
Table 5. Reliability at machine and entire line level for different time intervals.
Conclusions
The main research findings can be summarized as follows:
The Weibull distribution provided the best fit for the yogurt production line to describe the TBFs.
The reliability must be improved both on the pasteurizing boiler (M4), and the filling machine (M6), and the entire production line as well. The importance of these machines is crucial and their maintenance must be meticulous to avoid any losses related to quality, safety, and productivity.
The failure rate of the production line is increasing (β = 1.41453 > 1), implying that the currently applied maintenance strategy is not adequate and must be upgraded immediately.
the highest reliability values were determined for the CIP (M7), the filling pump (M5), and the auto-cooling tank (M1), and
Both reliability and failure rate models at line level were developed, thereby ensuring that line operation forecasting, at least in the short term, is feasible.
In conclusion, it can be claimed that the current maintenance policy is not adequate for the entire yogurt production line and more focused effort is required to improve the line operation management.
References
- Blischke, W. R., & Murthy, D. N. P. (2000). Reliability: Modeling, prediction and optimization. New York, NY: Wiley.10.1002/9781118150481
- Blischke, W. R., & Murthy, D. N. P. (2003). Case studies in reliability and maintenance (pp. 351–445). Hoboken, NJ: Wiley.
- Croarkin, C., & Tobias, P. (2005). NIST/SEMATECH e-Handbook of Statistical Methods. Retrieved from http://www.itl.nist.gov/div898/handbook
- Dhillon, B. S. (1999). Design reliability: Fundamentals and Applications. Boca Raton, FL: CRC Press LLC.10.1201/9781420050141
- Dhillon, B. S. (2006). Maintainability, maintenance and reliability for engineers. Boca Raton, FL: Taylor & Francis Group, LLC.10.1201/9781420006780
- Ebeling, C. E. (1997). An introduction to reliability and maintainability engineering. New York, NY: McGraw Hill.
- Goetz, W., & Villa, S. D. (1998). Reliability improvement through the use of plant operating data and the ORAP database. O&M Conference Modern Power Systems, London.
- Gupta, S., & Bhattacharya, J. (2007). Reliability analysis of a conveyor system using hybrid data. Quality and Reliability Engineering International, 23, 867–882.10.1002/(ISSN)1099-1638
- Hajeeh, M., & Chaudhuri, D. (2000). Reliability and availability assessment of reverse osmosis. Desalination, 130, 185–192.10.1016/S0011-9164(00)00086-2
- Jalali, S. E., & Forouhandeh, S. F. (2011). Reliability estimation of auxiliary ventilation systems in long tunnels during construction. Safety Science, 49, 664–669.10.1016/j.ssci.2010.12.015
- Kardon, B., & Fredendall, D. L. (2002). Incorporating overall probability of system failure into a preventive maintenance model for a serial system. Journal of Quality in Maintenance Engineering, 8, 331–345.10.1108/13552510210448531
- Kiureghian, A. D., Ditlevson, O. D., & Song, J. (2007). Availability, reliability & downtime of system with repairable components. Reliability Engineering and System Safety, 92, 231–242.10.1016/j.ress.2005.12.003
- Manzini, R., Regattieri, A., Pham, H., & Ferrari, E. (2009). Maintenance for industrial systems. London: Springer London Ltd.
- Markeset, T., & Kumar, U. (2001). R&M and risk-analysis tools in product design, to reduce life cycle cost and improve product attractiveness. Proceedings of annual reliability and maintainability symposium (pp. 116–121). New York, NY: IEEE.
- Meeker, W. Q., & Escobar, L. A. (1998). Statistical methods for reliability data. New York, NY: Wiley.
- Regattieri, A., Manzini, R., & Battini, D. (2010). Estimating reliability characteristics in the presence of censored data: A case study in a light commercial vehicle manufacturing system. Reliability Engineering and System Safety, 95, 1093–1102.10.1016/j.ress.2010.05.001
- Ruan, N., & Sun, X. (2006). An exact algorithm for cost minimization in series reliability systems with multiple component choices. Applied Mathematics and Computation, 181, 732–741.10.1016/j.amc.2006.02.001
- Singh, V. P., & Swaminathan, S. (2002). Sample sizes for system availability. Proceedings of annual reliability and maintainability symposium (pp. 51–55). New York, NY: IEEE.
- Stapelberg, F. R. (2009). The handbook of reliability, availability, maintainability and safety in engineering design. London: Springer-Verlag London Limited.
- Tsarouhas, P. (2010). Measuring the efficiency of medical equipment. International Journal of Applied Science, Engineering and Technology, 6, 15–20.
- Tsarouhas, P. (2012). Reliability, availability, and maintainability (RAM) analysis in food production lines: A review. International Journal of Food Science & Technology, 47, 2243–2251.
- Tsarouhas, P., & Arvanitoyannis, I. (2010a). Assessment of operation management for beer packaging line based on field failure data: A case study. Journal of Food Engineering, 98, 51–59.10.1016/j.jfoodeng.2009.12.007
- Tsarouhas, P., & Arvanitoyannis, I. (2010b). Reliability and Maintainability analysis of bread production line. Critical Reviews in Food Science and Nutrition, 50, 327–343.10.1080/10408390802544488
- Tsarouhas, P., & Arvanitoyannis, I. (2011). Quantitative analysis for peach production line management. Journal of Food Engineering, 105, 28–35.10.1016/j.jfoodeng.2010.11.029
- Tsarouhas, P., & Arvanitoyannis, I. (2012). Reliability and maintainability analysis to improve the operation of the limoncello production line. International Journal of Food Science & Technology, 47, 1669–1675.
- Tsarouhas, P., Arvanitoyannis, I., & Ampatzis, Z. (2009). A case study of investigating reliability and maintainability in a Greek juice bottling medium size enterprise (MSE). Journal of Food Engineering, 95, 479–488.10.1016/j.jfoodeng.2009.06.011
- Tsarouhas, P., Arvanitoyannis, I., & Varzakas, T. (2009). Reliability and maintainability analysis of cheese (Feta) production line in a Greek medium-size company: A case study. Journal of Food Engineering, 94, 233–240.10.1016/j.jfoodeng.2009.03.011
- Tsarouhas, P., Varzakas, T., & Arvanitoyannis, I. (2009). Reliability and maintainability analysis of strudel production line with experimental data: A case study. Journal of Food Engineering, 91, 250–259.10.1016/j.jfoodeng.2008.09.002
- Usher, J. M., Roy, U., & Parsaei, H. R. (1998). Integrated product and process development. Hoboken, NJ: Wiley.
- Wang, J., Hu, Y., & Li, J. (2010). Transient analysis to design buffer capacity in dairy filling and packing production lines. Journal of Food Engineering, 98, 1–12.10.1016/j.jfoodeng.2009.11.009
- Wang, W., Loman, J., & Vassiliou, P. (2004). Reliability importance of components in a complex system. In Proceedings of the annual reliability and maintainability symposium (RAMS) (pp. 6–11), Los Angeles, CA.