Abstract
This study examines the awareness, the implementation status, and the results from implementing Lean among small- and medium-sized enterprises (SMEs) in two segments of Virginia’s manufacturing industry. One hundred and eighty responses from a census mail survey (population size 1033) were analyzed and the results confirm previous research that smaller enterprises in these industries are marginally aware of Lean and its potential benefits. Smaller enterprises also have implemented Lean to a lesser degree than have medium or large enterprises. Also, fewer respondents working in small enterprises reported improvements in ‘lead-time,’ ‘on-time delivery,’ ‘inventory turnover,’ ‘cost per unit,’ and ‘sales per employee’ due to the implementation of Lean than respondents from medium and large enterprises. Small enterprises also indicated a lower need for Lean implementation support from third parties than did medium or large enterprises.
Introduction
The financial recession of 2008 has inflicted a challenging business climate in economies around the globe and has impacted industry and society (Dicks, Citation2008; International Monetary Fund, Citation2009; National Bureau of Economic Research, Citation2010; Wessel, Citation2010). However, changes in the US economy are not entirely driven by the past recession, but also by the ongoing globalization of economic activities (Buehlmann & Schuler, Citation2002, Citation2009; Fishman, Citation2005; Forbes, Citation2004; Spence, Citation2011). Over the past decades, increased global trade has caused a dramatic upsurge in imported products entering the US market, prompting stiff competition (Buehlmann & Schuler, Citation2009; Hansen, Panwar, & Vlosky, Citation2014; Umble, Haft, & Umble, Citation2003) and posing formidable challenges for US manufacturers. Indeed, the rapid globalization of economies has brought the comparative disadvantage regarding production costs, labor skills, and regulations of the US economy to the forefront (Spence, Citation2011). As ‘Imports started surging in the late 1990s, manufacturing employment started plunging (McCormack, Citation2010),’ with total US manufacturing employment today being around 12 million from a peak of almost 20 million in 1979 (Bureau of Labor Statistics, Citation2010, Citation2014; Forbes, Citation2004).
The US forest products industries (wood products [NAICS 321], pulp and paper [NAICS 322], and furniture [NAICS 337], respectively) are important contributors to the US economy creating an estimated $362 billion in sales and employing about 1.5 million people in 2007 (U.S. Census Bureau, Citation2009a, 2009b, 2009c). However, over the past decades, large parts of the US forest products industries have lost considerable market share to overseas competitors (Buehlmann & Schuler, Citation2002, 2009; Grushecky, Buehlmann, Schuler, Luppold, & Cesa, Citation2006; Hansen et al., Citation2014; Luppold & Bumgardner, Citation2008; Quesada & Gazo, Citation2006; Schuler, Adair, & Winistorfer, Citation2005; Schuler & Buehlmann, Citation2003). Acknowledging the problem, numerous authors have called for a paradigm shift for US manufacturing industries (Becker, Citation2003; Oh, Yoon, & Shyu, Citation2008; Schuler & Buehlmann, Citation2003), including the adaptation of new strategic business models, increased use of mass customization, creating supply chain alliances, and, embracing Lean (Buehlmann & Schuler, Citation2009; Schuler & Buehlmann, Citation2003).
Small- and medium-sized enterprises (SMEs) are critically important for economic and social welfare (Gibb & Li, Citation2003; Mulhern, Citation1995; Storey, Citation2003). SMEs are ‘… The engine of job growth … (Office of Management & Budget, Citation2014)’ and have supplied 66% of all net new employment since the 1970s and currently provide 55% of total US employment (Small Business Administration, Citation2014). SMEs’ flexibility and ability to grow over time explains their perseverance despite disadvantages in respect to economy of scale and scope, experience effects, and access to capital, to name just a few (Ghemawat, Citation1986; Penrose, Citation1995). Due to their size, operational excellence, innovation, and flexibility to adapt to market conditions are crucial (Achanga, Shehab, Roy, & Nelder, Citation2006). Various authors (Emiliani, Citation1998, 2007; Liker, Citation2003; Womack & Jones, Citation2003) have maintained that Lean management enables enterprises to achieve operational excellence, innovation, and flexibility, resulting in improved organizational performance and increased rates of growth and enterprise survival.
Research has shown that Lean, a management philosophy focused on creating customer value while eliminating waste (Liker, Citation2003; Womack & Jones, Citation2003; Womack, Jones, & Roos, Citation1990) can help small enterprises improve their performance (Achanga et al., Citation2006; Brown & Inman, Citation1993; Lee, Citation1997). However, research has also shown that smaller enterprises typically are more reluctant to implement improvement programs (Achanga et al., Citation2006; Kumar, Antony, Singh, Tiwari, & Perry, Citation2006; Stuart & Boyle, Citation2007). This reluctance may stem from, among other things, unawareness of the benefits of improvement programs, a lack of resources in small organizations, a short-term planning horizon, and lower awareness of the benefits of improvement and training opportunities offered by third-party support organizations (Curran, Blackburn, Kitching, & North, Citation1997; Westhead & Storey, Citation1996).
Lean offers an opportunity for US manufacturers to compete more successfully in US and global markets. To the mostly small- and medium-sized enterprises of US wood products (NAICS 321, 66% have less than 20 employees, U.S. Census Bureau, Citation2010a) and furniture manufacturing (NAICS 337, 80% have less than 20 employees, US Census 2010c) industries, Lean offers the ability to achieve performance improvements while also increasing production flexibility (Achanga et al., Citation2006; Brown & Inman, Citation1993; Lee, Citation1997). While existing data mostly cover efforts of large enterprises implementing Lean (Hon, Citation2010; Merillat-Masco Builder Cabinet Group, Citation2009; Steelcase, Citation2006), only limited research exists investigating the awareness, the implementation, the results, and the need of external implementation support for Lean in small- and medium-sized enterprises. As part of a larger study on Lean awareness and implementation (Fricke, Citation2010; Fricke & Buehlmann, Citation2012a, 2012b), this manuscript presents the results of the investigation on the differences between small, medium, and large enterprises in respect to their Lean awareness and implementation.
Hypotheses
The objective of this research was to gain an understanding of the awareness and the implementation of Lean practices by small and medium-sized enterprises in the wood products (NAICS 321) and furniture manufacturing (NAICS 337) industry in the Commonwealth of Virginia. The following four areas of interest by company size were investigated: Lean awareness, Lean implementation status, business results when using Lean, and the need for external support for Lean implementation, resulting in the following four hypotheses:
Lean awareness
H10: No difference in Lean awareness exists between enterprises with 1–19, 20–49, and 50–499 employees in the wood products (NAICS 321) and furniture manufacturing (NAICS 337) industries in the Commonwealth of Virginia.
Lean implementation
H20: No difference in Lean implementation status exists between enterprises with 1–19, 20–49, and 50–499 employees in the wood products (NAICS 321) and furniture manufacturing (NAICS 337) industries in the Commonwealth of Virginia.
Business results
H30: No difference in business results exists between Lean enterprises with 1–19, 20–49, and 50–499 employees in the wood products (NAICS 321) and furniture manufacturing (NAICS 337) industries in the Commonwealth of Virginia.
Need for support
H40: No difference in need for external support of Lean implementation exists between enterprises with 1–19, 20–49, and 50–499 employees in the wood products (NAICS 321) and furniture manufacturing (NAICS 337) industries in the Commonwealth of Virginia.
Research methods
To assure the acquisition of sufficient data, a census mail survey was chosen and close attention was paid to proper survey design (Dillman, Smyth, & Christian, Citation2009; Ott & Longnecker, Citation2010; Rea & Parker, Citation2005).
Survey population
According to the US Census, wood products (NAICS 321) includes enterprises categorized in ‘sawmills and wood preservation (NAICS 32111),’ ‘veneer, plywood, and engineered wood product manufacturing (NAICS 32121)’ including trusses, ‘millwork (NAICS 32191)’ including windows, doors, and flooring, ‘wood container and pallet manufacturing (NAICS 32192),’ and ‘all other wood product manufacturing (NAICS 32199)’ including manufactured and prefabricated homes (U.S. Census Bureau, Citation2010b). Furniture manufacturing (NAICS 337) includes enterprises categorized in ‘wood kitchen cabinet and countertop manufacturing (NAICS 33711),’ ‘household and institutional furniture manufacturing (NAICS 33712),’ ‘office furniture (including fixtures) manufacturing (NAICS 33721),’ and ‘blind and shade manufacturing (NAICS 33792, U.S. Census Bureau, Citation2010c)’. According to the Quarterly Census of Employment and Wages (Virginia Workforce Connection, Citation2010), the total number of establishments in the Commonwealth of Virginia in these industries in 2009 was 1033 (513 NAICS 321 and 520 NAICS 337).
Due to a lack of a statewide address list containing the enterprises of interest, address data were collected from Manta’s online business listings (Manta, Citation2010), the 2009 Virginia industrial directory (DandB, Citation2009), the Wood Products Manufacturers Association (Wood Products Manufacturers Association, Citation2010), and the Architectural Woodwork Institute (AWI, Citation2010). After correcting for surveys that could not be delivered, enterprises out of business, or enterprises that were not involved in wood products or furniture manufacturing, the final sample size for this survey was 1193, which was used for a Census survey (Alreck & Settle, Citation1995; Dillman, Citation2006).
Questionnaire design
A mail questionnaire, where the first part consisted of nine questions to gather basic enterprise information, the second part asked questions regarding the enterprise’s Lean practices, the third part asked questions assessing the respondents’ need for external support, and a fourth part consisted of product and market related questions. Two types of questions were used: (1) categorical and (2) open-ended (Fink, Citation2003; Rea & Parker, Citation2005).
This study used a set of 29 widely used Lean elements categorized in four categories (Czabke, Hansen, & Doolen, Citation2008; Kirby & Greene, Citation2003; Liker, Citation2003) as proxies for Lean awareness and implementation levels (Table ), as Kirby and Greene (Citation2003) found a direct positive relationship between the number of Lean elements (Table ) implemented and the level of an organization’s Lean maturity.
Table 1. The 29 Lean elements used as proxies to establish Lean awareness and Lean implementation status.
The questionnaire was reviewed by Virginia Tech faculty, specialists at the US Forest Service, and experts at the Lean Management Instituut, Netherlands. A pretest with 25 industry participants randomly selected from the address list was also conducted. Seven responses were received and minor changes were made to the mail questionnaire to increase clarity (Rea & Parker, Citation2005).
Data collection
In July 2010, the revised questionnaire was sent to all remaining addresses (N = 1168). Each questionnaire contained a personalized cover letter addressed to corporate-level decision-makers, a questionnaire printed on colored paper with a unique tracking number for accurate response monitoring, and a first-class, prepaid return envelope (Biemer & Lyberg, Citation2003; Rea & Parker, Citation2005). A reminder postcard, a second survey (including cover letter, questionnaire with tracking number, and prepaid return envelope), and a second reminder postcard were sent out to all non-respondents one, four, and seven weeks after the initial mailing, respectively. Ten weeks after the original mailing, 30 non-respondents were contacted by telephone and fax and asked three demographic questions for use in the determination of non-response bias (Dillman et al., Citation2009; Rea & Parker, Citation2005). All data received were entered into a coded MS Excel data analysis spreadsheet (Microsoft, Citation2007).
Data analysis
JMP 8.0 statistical software (SAS, Citation2008) was used for statistical analysis. Survey data from questions pertaining to industry demographics, market structure, and Lean practices were tested using non-parametric statistics. Unless noted otherwise, statistical tests were conducted at the 95% of significance level.
Non-response bias was tested using the data from the 30 contacted non-respondents after closing of the survey (Rea & Parker, Citation2005). To assess non-response bias, two demographic questions were asked (which industry segment the respondent’s enterprise belongs to and how many employees are currently working in the respondent’s enterprise). Additionally, one question regarding the respondent’s awareness of Lean terms was asked. Results were analyzed using Fisher’s exact test to account for potential small sample sizes (Ott & Longnecker, Citation2010). No significant (α = .05) differences between respondents and non-respondents were found (p = .90, .19, and .67, respectively).
Definitions
The following definitions were used in this study:
Small- and medium-sized enterprise
Depending on the source, industry, and country, different definitions exist as to what constitutes a small- and medium-sized enterprise (Australian Bureau of Statistics, Citation2002; European Commission, Citation2012, Citation2010; SME; Small Business Administration, Citation2010). This study uses the following enterprise size classifications (based on individual enterprise location, not corporate-wide employment): 1–19 employees (small-size enterprise), 20–49 employees (medium-size enterprise), and 50–499 employees (large-size enterprise; only one response from an enterprise with more than 500 employees was received and discarded).
Lean awareness
Survey participants were considered ‘aware of Lean’ if respondents knew at least one of five Lean terms (Lean Management, Lean Manufacturing, Lean Production, Lean Thinking, or Toyota Production System (TPS)).
Lean implementation status
To classify a respondent’s operation as having ‘implemented Lean,’ the respondent needed to check at least one of the 29 Lean elements listed (Table ) as ‘already in use.’
Need for implementation external support
To evaluate the need for external Lean implementation support, the survey participants were asked to answer the question ‘Do you have a need for external support in order to improve your organization’s performance.’ All affirmative answers were used to conclude a need for external Lean implementation support.
Limitations
The feedback received may not reflect the views or opinions of the enterprise or of other management level employees as the survey is most likely filled out by only one individual. Also, failure to answer all questions by respondents might lead to misclassification of results.
A Fisher’s exact test was conducted to test the distribution of the population and the respondents to compare industry sub-segment representation. The test showed a significant difference (p = .01016) in that enterprises from ‘other wood product manufacturing (NAICS 3219)’ including ‘millwork (NAICS 32191),’ ‘wood container and pallet manufacturing (NAICS 32192),’ and ‘manufactured home (mobile home) manufacturing (NAICS 32199)’ were overrepresented, while enterprises from ‘office furniture (including fixtures) manufacturing (NAICS 3372)’ were underrepresented.
The survey’s questionnaire asked respondents if there is ‘… A need for external support …’ in their quest to implement Lean. This question may have caused bias by respondents having become concerned about unwanted soliciting external Lean implementation support from third parties.
Lastly, this survey asked questions about a specific topic (Lean). Arguments can be made that individuals knowledgeable about Lean tend to be more likely to respond to the survey. However, the results obtained appear to be consistent with previous research (Achanga et al., Citation2006; Kumar et al., Citation2006; Pirraglia, Saloni, & van Dyk, Citation2009; Stuart & Boyle, Citation2007; Westhead & Storey, Citation1996). Thus, if bias is present, it should be low.
Results and discussion
Results from this research are presented and discussed in the following paragraphs. The mail survey resulted in 180 responses for an adjusted response rate of 17%.
Respondent profiles
Eighty-seven percent of the survey respondents worked for corporate management, operating management, or were the owners or presidents of the enterprise. Seven percent of the respondents were part of production management, while the rest either worked for marketing and sales (2%), engineering (1%), or another function (3%, respectively).
A majority (61%, N = 112) of the responding enterprises in the Commonwealth of Virginia employed less than 20 employees, 20% employed between 20 and 49 employees, while 19% employed between 50 and 499 employees. Figure gives an overview of respondents’ enterprise size as measured by number of employees for all respondents (Figure , N = 178), for the wood products Industry, Figure , N = 113), and for the furniture manufacturing Industry (Figure , N = 65).
Figure 1. Number of employees by responding enterprise, overall (left), for the wood products (center), and for the furniture manufacturing industry (right).
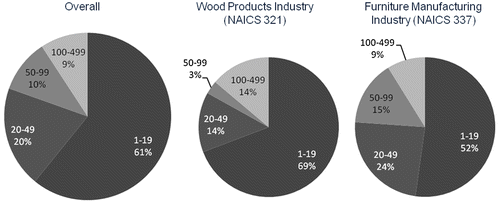
The wood products industry (NAICS 321) has a larger share of enterprises with less than 20 employees (69%, N = 45) than does the furniture manufacturing industry (NAICS 337, 52%, N = 59, Figure ). The wood products industry segment, however, has fewer enterprises with 20–49 and with 50 to 499 employees (14 and 17%, respectively) than the furniture manufacturing industry (24 and 24%, respectively).
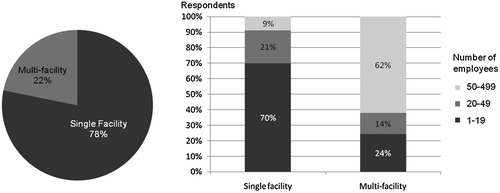
More than three-fourths (78%) of the survey participants operate in a single facility (Figure ). Seventy percent of the single facility operations employ between 1–19 employees, 21% employ 20–49 employees, and 9% employ 50–499 employees. Sixty-two percent of enterprises belonging to a multi-facility corporation employ between 50–499 employees, 14% employ 20–49, and 24% employ 1–19 employees at their site in Virginia (Figure ).
Figure 2. Survey respondents’ working in single facility and multi-facility operations (left) and enterprise size distribution by single facility and multi-facility operations (right).
Survey participants were also asked if their employees were ‘… Organized in unions.’ Ninety-nine percent of the respondents negated this question.
Lean awareness
Lean awareness of respondents was measured by respondents answering positively to having heard one of the following five terms: Lean Management, Lean Manufacturing, Lean Production, Lean Thinking, and Toyota Production System (TPS). Seventy-two percent of the respondents indicated that they are aware of at least one of the terms (Figure ). Awareness of Lean, however, differed by size of enterprise for which the respondent worked. Only 65% of respondents from the small enterprise size group (N = 112) were aware of at least one of the Lean terms while 82 and 86% of the respondents from medium-sized (N = 33) and from large-sized enterprises (N = 35), respectively, were familiar with at least one term (Figure ).
Figure 3. Lean awareness of respondents as measured by knowing at least one of the five Lean terms overall and by enterprise size (1–19, 20–49, and 50–499 employees).
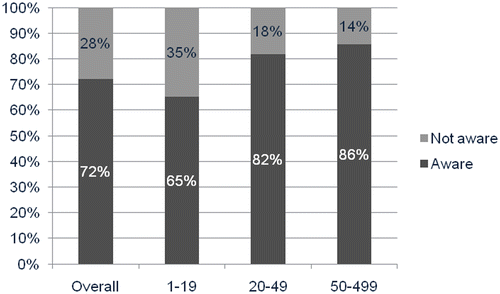
Based on the data, Hypothesis one (No difference in Lean awareness exists between enterprises with 1–19, 20–49, and 50–499 employees in the wood products (NAICS 321) and furniture manufacturing (NAICS 337) industries in the Commonwealth of Virginia.) was rejected (p = .02504, Fisher’s exact test). Thus, Lean awareness differs between enterprises with 1–19, 20–49, and 50–499 employees. Conducting pairwise comparisons, evidence was found that respondents working for enterprises with 1–19 employees and respondents working for enterprises with 50–499 employees do not share the same level of Lean awareness (p = .0210, Fisher’s exact test). However, when applying the Bonferroni correction (corrected α = .01667), known to result in conservative conclusions (Hsu, Citation1996), no significant differences were found.
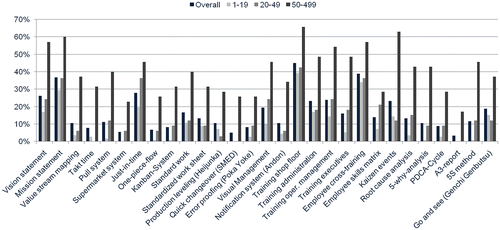
When measuring Lean awareness using the 29 Lean elements listed in Table , the average level of Lean awareness was low. On average, each of the 29 Lean elements was known by only 25% of the respondents. However, large differences in awareness of individual elements exist. Lean elements such as, for example ‘“mission statement,” “just-in-time,” “training shop floor employees,” “employee cross-training,” or “vision statement” (63, 56, 49, 48, 42% awareness, respectively)’ were more widely known than more Lean-specific elements such as, for example, ‘A3-report,’ ‘quick changeover (SMED),’ ‘error proofing (Poka Yoke),’ ‘notification system (Andon),’ or ‘PDCA-cycle (6, 8, 12, 12, and 13% awareness, respectively, Figure ).’
Figure 4. Awareness of Lean elements by survey respondents overall and by enterprise size (1–19, 20–49, and 50–499 employees).
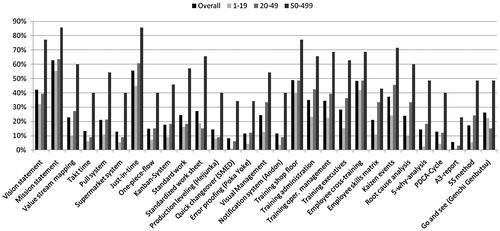
Larger enterprises were found to be more aware of individual Lean elements than were smaller enterprises. The overall average awareness of Lean elements by respondents from smaller enterprises is below average (16 vs. 25%), while awareness of Lean elements by respondents from large enterprises is higher than the overall average (54 vs. 25%).
Enterprises with 1–19, 20–49, and 50–499 employees were aware of, on average, 4.68, 7.03, and 15.36 Lean elements, respectively. Statistical testing using a Kruskal–Wallis test on the data for the three enterprise sizes, Hypothesis one was rejected (p < .0001), indicating that differences in Lean awareness between enterprises with 1–19, 20–49, and 50–499 employees exist. Significant differences were found between enterprises with 50–499 employees and both, 20–49 (p = .0007, Wilcoxon Rank-Sum) and 1–19 employees (p = .0001). However, no statistically significant difference was detected between 1–19 and 20–49 employees (p = .1012). The difference between the pairs identified remained significant after applying the Bonferroni correction (corrected α = .01667).
Lean implementation status
Fewer enterprises exist that have actually implemented Lean elements than enterprises that are aware of them. On average of all respondents and all enterprise sizes, each individual Lean element is implemented by 16% of the responding enterprises (Figure ). By enterprise size, the awareness is 9% for small enterprises (1–19 employees), 16% for medium enterprises (20–49 employees), and 40% for large enterprises (50–499 employees, Figure ).
However, these average numbers are misleading as the implementation frequency of Lean elements (Table ) varies greatly depending on individual elements. Lean elements such as, for example, ‘training shop floor [employees],’ ‘employee cross-training,’ ‘mission statement,’ ‘just-in-time,’ or ‘vision statement’ (overall implementation frequencies of 45, 39, 37, 28, and 26%, respectively) were implemented more frequently than the average (16%). This may not be much of a surprise, as these elements are concepts employed by other management practices. However, the response frequency for elements that are more uniquely associated with Lean such as ‘“A3-report,” “quick changeover (SMED),” supermarket system, “one-piece-flow,” “takt time,” Kanban system, or error proofing (Poka Yoke),’ is, with implementation frequencies of 3, 5, 6, 7, 8, 8, and 8%, respectively, much lower.
Hypothesis two, ‘No difference in Lean implementation status exists between enterprises with 1–19, 20–49, and 50–499 employees in the wood products (NAICS 321) and furniture manufacturing (NAICS 337) industries in the Commonwealth of Virginia,’ was rejected (p < .0001, KruskalWallis). Figure shows the distribution of total number of Lean elements implemented by individual enterprises clustered according to enterprise size (1–19, 20–49, and 50–499 employees).
Figure 6. Distribution of Lean implementation by enterprise size (1–19, 20–49, and 50–499 employees).
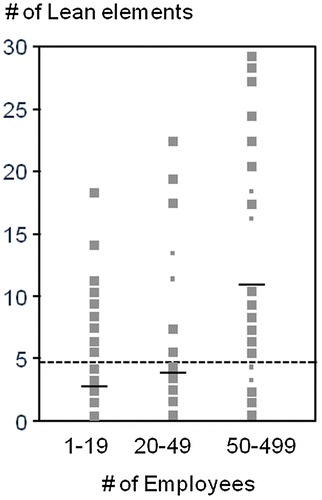
While all three enterprise sizes (1–19, 20–49, 50–499 employees) have representatives with zero Lean elements implemented, only the large enterprise size group had representatives with more than 25 elements implemented (N = 7). On average, the three different enterprise size groups) have implemented 2.74, 3.94, and 11.31 Lean elements, respectively. Conducting pair wise comparisons for number of Lean elements implemented by enterprise size group, significant differences between enterprise groups with 50–499 and 20–49 (p = .0030, Wilcoxon Rank-Sum), and 50–499 and 1–19 (p ≤ .0001) employees were found. No significant difference was found between enterprises with 1–19 and 20–49 employees (p = .3751). The differences of the two pairs remain significant after applying the Bonferroni correction (corrected α = .01667).
Business results from implementing Lean
To evaluate the benefits obtained from implementing at least one of the 29 Lean elements (Table ), participants were asked to provide information by checking ‘… The key performance indicators that are implemented …’ and by specifying ‘… The degree of improvement.’ Five typical Lean key performance indicators (Parmenter, Citation2009) were listed in the questionnaire: ‘lead time, on-time delivery, inventory turnover, cost per unit, and sales per employee (Emiliani, Citation2007).’ Twenty-three percent of all survey participants answered these questions (N = 44). ‘On-time delivery’ was tracked by 19% of the respondents (N = 35), ‘lead time’ by 16% (N = 31), ‘cost per unit’ by 16% (N = 31), ‘inventory turnover’ by 15% (N = 29), and ‘sales per employee’ by 12% (N = 23). Figure provides an overview of the results.
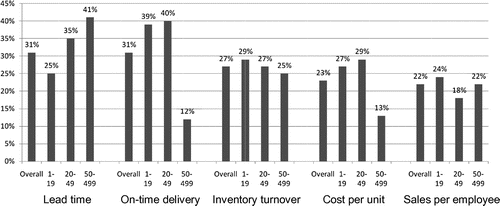
Figure 7. Survey respondents’ answers to improvements made through Lean implementation efforts by enterprise size group.
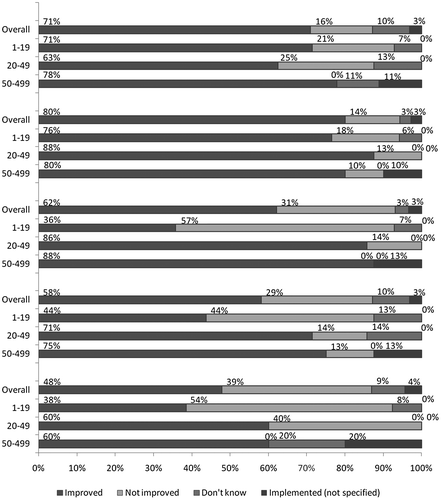
Seventy-one percent (N = 10) of the respondents with 1–19 employees, and having implemented Lean, answered to have improved their ‘lead-time’ thanks to the implementation of Lean elements. Conversely, only 63% (N = 5) of the enterprise with 20–49 employees (N = 8) indicated improvements in ‘lead-time.’ However, 78% (N = 7) of the respondents working for enterprises with 50–499 employees (N = 9) answered to have improved their ‘lead-time.’
Respondents reported better success with ‘on-time delivery.’ Overall, 80% of all respondents improved their delivery performance. By enterprise size, 76, 88, and 80% of enterprises with 1–19 employees (N = 13), 20–49 employees (N = 8), and 50–499 employees (N = 8), respectively, reported improvements with ‘on-time delivery’ due to the implementation of Lean elements.
Respondents working for enterprises in the employee size groups with 20–49 and 50–499 employees also reported an improvement in ‘inventory turnover.’ Eighty-six percent (N = 6) and 88% (N = 7), respectively, answered to have improved ‘inventory turnover’ thanks to the implementation of Lean elements. However, only 36% (N = 5) of the respondents working for an enterprise with 1–19 employees made improvements regarding their ‘inventory turnover.’
Seventy-one percent (N = 5) and 60% (N = 3) of the respondents with 20–49 employees and 75% (N = 6) and 60% (N = 3) of the respondents with 50–499 employees improved their ‘cost per unit’ and ‘sales per employee,’ respectively. However, only 44% (N = 7) and 38% (N = 5) of the respondents with 1–19 employees indicated to have improved their costs per unit and ‘sales per employee,’ respectively.
Respondents indicating improvements in one of the five categories (‘lead time, on-time delivery, inventory turnover, cost per unit, and sales per employee,’ Figure ) were also asked about the size of the average improvement achieved. Overall, respondents reported improvements of 31, 31, 27, 23, and 22%, respectively, for ‘lead time, on-time delivery, inventory turnover, cost per unit, and sales per employee,’ (Figure ).
The size of improvement varied depending on the enterprise size group (e.g. the number of employees of a given facility) and the category. For example, the average ‘lead-time’ improvement for respondents in the small enterprise size group with 1–19 employees was 25, 35, and 41%, respectively, for the medium enterprise and large enterprise size group. Interestingly, the large enterprises with 50–499 employees made only relatively small improvements in ‘on-time delivery’ and ‘cost per unit’ (12 and 13%, respectively), while the small- and medium-sized enterprises improved the same KPIs by 39 and 41 and 27 and 29%, respectively.
Need for external Lean implementation support
Eighty percent or more of the respondents from the small and medium enterprise size groups (1–19 and 20–49 employees, respectively) indicated that they have no need for external Lean implementation support. However, more than 40% of respondents from the large enterprise size group (50–499 employees) indicated a need for external Lean implementation support (Figure ).
Figure 9. Need for external Lean implementation support overall and for the three different enterprise size categories.
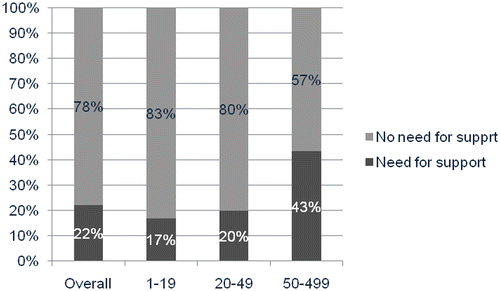
Thus, Hypothesis four, ‘No difference in need for external support of Lean implementation exists between enterprises with 1–19, 20–49, and 50–499 employees in the wood products (NAICS 321) and furniture manufacturing (NAICS 337) industries in the Commonwealth of Virginia,’ was rejected (p = .01231, Fisher’s exact test), concluding that there is a significant difference in the need for external Lean implementation support by enterprise size group. When performing pairwise analysis of the three enterprise size categories, a significant difference (p = .0053, Fisher’s exact test) in need for external Lean implementation support was found only between small and large enterprise size groups. No significant differences were found between enterprise size groups with 1–19 and 20–49 (p = .7984) and 20–49 and 50–499 employees (p = .0598). The outcome of these statistical tests did not change when the Bonferroni correction was applied (corrected α-value of .01667).
The case for Lean
Womack and Jones (Citation2003) and Liker and Meier (Citation2005), among others, have made the case that Lean has a positive influence on the success of enterprises, a notion that has been confirmed by this study. In particular, this study has found a benefit from Lean implementation to small enterprises (1–19 employees), as small enterprises that have implemented Lean reported improvements in business results (71, 76, 36, 44, and 38% of small enterprises indicated improvements in ‘lead-time,’ ‘on-time delivery,’ ‘inventory turnover,’ ‘cost per unit,’ and ‘sales per employee’, Figure ). Unfortunately, in times when continuous improvement in enterprise performance (a central tenet of Lean) is essential for survival, only 65% of all small enterprises responding to this survey were aware of Lean (Figure ) and only 50% of small enterprises had at least one of the 29 Lean elements (Table ) implemented (Figure ). Such rates are unfortunate, as small enterprises fail to take advantage of a powerful tool to be more competitive in markets where they compete against larger and often international enterprises (which, as this study revealed, are more aware of and have implemented more Lean elements). This lack of understanding of Lean and the potential benefits of Lean by small enterprises is also expressed by a significantly lower need for external Lean implementation support. Only minor performance improvements through Lean implementation, if any, can be expected when no trained resources are used to properly implement Lean. Therefore, additional efforts are required to explain the benefits of Lean to small enterprises, to train personnel from small enterprises, and to support these enterprises in properly implementing Lean.
Summary and conclusions
The results of this study are consistent with previously published findings that smaller enterprises tend to have lower awareness of the benefits of operational improvement programs (Westhead & Storey, Citation1996). Smaller enterprises are also more reluctant to implement such improvement programs (Achanga et al., Citation2006; Kumar et al., Citation2006; Stuart & Boyle, Citation2007). A census mail survey targeting the wood products and furniture manufacturing industries (NAICS codes 332 and 337, respectively) in the Commonwealth of Virginia investigated the level of Lean awareness, the status of Lean implementation, the business results from Lean implementation, and the need for external Lean implementation support in small (1–19 employees), medium (20–49 employees), and large (50–499 employees) enterprises.
Sixty-five percent of the small enterprises responding to this survey were aware of Lean. However, on average of all respondents in the small enterprise size category, only 3 Lean elements of a total of 29 had been implemented. Eighty-two percent of respondents from enterprises with 20–49 employees were aware of Lean and had implemented an average of 4 Lean elements from the 29 elements identified. Of the largest enterprise strata investigated (e.g. enterprises with 50 to 499 employees), 86% were aware of Lean and had implemented, on average, 11 Lean elements.
Fewer respondents working in small enterprises reported improvements in ‘lead-time,’ ‘on-time delivery,’ ‘inventory turnover,’ ‘cost per unit,’ and ‘sales per employee’ due to the implementation of Lean than did respondents for medium- and large-sized enterprises. However, responding small enterprises reported an overall improvement from Lean implementation and 71, 76, 36, 44, and 38% indicated improvements in ‘lead-time,’ ‘on-time delivery,’ ‘inventory turnover,’ ‘cost per unit,’ and ‘sales per employee.’ For medium and large enterprises, these numbers were, respectively, 63, 88, 86, 71, and 60% and 78, 80, 88, 75, and 60%.
The need for external Lean implementation support was found to be low by respondents in the small enterprise size group, (17%). Respondents from the medium and large enterprise size groups, however, signaled a larger need for external Lean implementation support (20 and 43% of respondents indicated a need), despite being more aware of Lean and having implemented Lean more extensively than the small enterprise size group.
Disclosure statement
No potential conflict of interest was reported by the authors.
Funding
The work upon which this research is based was funded, in part, through a grant awarded by the Wood Education and Resource Center, Northeastern Area State and Private Forestry, US Forest Service [grant number 10-DG-11420004-151], by Virginia Cooperative Extension, and Virginia Tech, Blacksburg, VA.
References
- Achanga, P., Shehab, E., Roy, R., & Nelder, G. (2006). Critical success factors for Lean implementation within SMEs. Journal of Manufacturing Technology Management, 17, 460–472.
- Alreck, P. L., & Settle, R. B. (1995). The survey research handbook (2nd ed.). Chicago, IL: Irwin.
- Australian Bureau of Statistics. (2002). Small business in Australia, 2001. Author. Retrieved November 15, 2010, from http://www.abs.gov.au/Ausstats/[email protected]/0/97452F3932F44031CA256C5B00027F19?Open
- AWI. (2010). Find a member. Author. Retrieved September 8, 2010, from http://www.awinet.org/FindaMember/tabid/167/Default.aspx
- Becker, D. (2003). The fight to furnish, about 7,000 North Carolina furniture workers have lost their jobs in the past three years as U.S. furniture companies are left with few options amid the continuing influx of Chinese imports. Greensboro, NC: Greensboro News and Record.
- Biemer, P., & Lyberg, L. E. (2003). Introduction to survey quality. Hoboken, NJ: Wiley.10.1002/0471458740
- Brown, K. L., & Inman, R. A. (1993). Small business and JIT: A managerial overview. International Journal of Operations and Production Management, 13, 57–66.10.1108/01443579310026032
- Buehlmann, U., & Schuler, A. (2002). Benchmarking the wood household furniture industry in a global market. Wood Digest, 52–57.
- Buehlmann, U., & Schuler, A. (2009). The US household furniture industry: Status and opportunities. Forest Products Journal, 59, 20–28.
- Bureau of Labor Statistics. (2010). Employees on nonfarm payrolls by major industry sector, 1960 to date. Author. Retrieved November 27, 2010, from ftp://ftp.bls.gov/pub/suppl/empsit.ceseeb1.txt
- Bureau of Labor Statistics. (2014). Industries at a glance – Manufacturing: NAICS 31-33. Author. Retrieved May 1, 2014, from http://www.bls.gov/iag/tgs/iag31-33.htm
- Curran, J., Blackburn, R., Kitching, J., & North, J. (1997). Small firms and workforce training: Some results, analysis and policy implications from a national survey. In M. Ram, D. Deakins, & D. Smallbone (Eds.), Small firms: Enterprising futures (pp. 73–90). London: Paul Chapman Press.
- Czabke, J., Hansen, E., & Doolen, T. (2008). A multisite field study of Lean thinking in U.S. and German secondary wood products manufacturers. Forest Products Journal, 58, 77–85.
- DandB. (2009). 2009 Virginia industrial directory. Twinsburg, OH: Dun and Bradstreet.
- Dicks, G. (2008). The US recession. Economic Outlook, 4(10), 1–4.
- Dillman, D., Smyth, J. D., & Christian, L. M. (2009). Internet, mail, and mixed-mode surveys : The tailored design method (3rd ed.). Hoboken, NJ: Wiley.
- Dillman, D. A. (2006). Mail and internet surveys: The tailored design method (2nd ed.). Hoboken, NJ: Wiley.
- Emiliani, B. (2007). Better thinking, better results (2nd ed.). Wetherfield, CT: The Center for Lean Business Management, LLC.
- Emiliani, M. (1998). Lean behaviors. Management Decision, 36, 615–631.10.1108/00251749810239504
- European Commission. (2010). Small and medium sized enterprises (SME) – Definition. European Commission – Enterprise and Industry. Retrieved November 15, 2010, from http://ec.europa.eu/enterprise/policies/sme/facts-figures-analysis/sme-definition/index_en.htm
- European Commission. (2012). Evaluation of the SME definition – Final report (132 pp.). Kent: Centre for Strategy and Evaluation Services. Retrieved February 25, 2014, from http://ec.europa.eu/enterprise/policies/sme/files/studies/evaluation-sme-definition_en.pdf
- Fink, A. (2003). How to ask survey questions (2nd ed.). Thousand Oaks, CA: Sage.10.4135/9781412984393
- Fishman, T. C. (2005). China Inc: How the rise of the next superpower challenges America and the world (p. 368). New York, NY: Scribner.
- Forbes, K. J. (2004, July). U.S. manufacturing: Challenges and recommendations. Business Economics, 39, 30–37.
- Fricke, C. (2010). Lean management: Awareness, implementation status, and need for implementation support in Virginia’s wood industry (Master thesis). Virginia Tech, Blacksburg, p. 170.
- Fricke, C., & Buehlmann, U. (2012a). Lean and Virginia’s wood industry – Part I: Awareness and implementation. BioResources, 7, 5074–5093.
- Fricke, C., & Buehlmann, U. (2012b). Lean and Virginia’s wood industry – Part II: Results and need for support. BioResources, 7, 5094–5108.
- Ghemawat, P. (1986). Sustainable advantage. Harvard Business Review, 64, 53–58.
- Gibb, A., & Li, J. (2003). Organizing for enterprise in China: What can we learn from the Chinese micro, small, and medium enterprise development experience. Futures, 35, 403–421.10.1016/S0016-3287(02)00089-7
- Grushecky, S., Buehlmann, U., Schuler, A., Luppold, W., & Cesa, E. (2006). Decline in the US furniture industry: A case study of the impacts to the hardwood lumber supply chain. Wood and Fiber Science, 38, 365–376.
- Hansen, E., Panwar, R., & Vlosky, R. (2014). The global forest sector: Changes, practices, and prospects (p. 478). Boca Raton, FL: CRC Press – Taylor & Francis Group.
- Hon. (2010). HON company – News and media center. Retrieved October 18, 2010, from http://www.hon.com/About-HON/Press-Media/Press-Releases/The-HON-Company-Backgrounder.aspx
- Hsu, J. (1996). Multiple comparisons: Theory and methods (1st ed.). New York, NY: Chapman and Hall/CRC.10.1007/978-1-4899-7180-7
- International Monetary Fund. (2009). World economic outlook. Washington, DC: Author. Retrieved October 18, 2010, from http://www.imf.org/external/pubs/ft/weo/2009/01/
- Kirby, K. E., & Greene, B. M. (2003). How value stream type affects the adoption of lean production tools and techniques. Proceedings of the 2003 Industrial Engineering and Research Conference, May 18–20, 2003, Portland.
- Kumar, M., Antony, J., Singh, R. K., Tiwari, M. K., & Perry, D. (2006). Implementing the Lean Sigma framework in an Indian SME: A case study. Production Planning and Control, 17, 407–423.10.1080/09537280500483350
- Lee, C. Y. (1997). JIT adoption by small manufacturers in Korea. Journal of Small Business Management, 35, 98–108.
- Liker, J. K. (2003). The Toyota way (1st ed.). New York, NY: McGraw-Hill.
- Liker, J. K., & Meier, D. (2005). The Toyota way field book (1st ed.). New York, NY: McGraw-Hill.
- Luppold, W., & Bumgardner, M. (2008). 40 years of hardwood lumber consumption: 1963 to 2002. Forest Products Journal, 58, 5–12.
- Manta. (2010). Company profiles and company information on Manta. Manta. Retrieved September 8, 2010, from http://www.manta.com/
- McCormack, R. (2010). The economic think tanks were wrong: Imports have destroyed American jobs. Manufacturing and Technology News, 17(15). Retrieved April 30, 2014, from http://www.manufacturingnews.com/news/newss/houseman930.html
- Merillat-Masco Builder Cabinet Group. (2009). About Merillat. Merillat. Retrieved January 17, 2010, from http://www.merillat.com/company/index.aspx
- Microsoft. (2007). MS Excel. Redmond, WA: Microsoft Corporation.
- Mulhern, A. (1995). The SME sector in Europe: A broad perspective. Journal of Small Business Management, 33, 83–87.
- National Bureau of Economic Research. (2010). Determination of the December 2007 peak in economic activity. Cambridge, MA: Author.
- Office of Management and Budget. (2014). Supporting small businesses and creating jobs. The White House. Retrieved February 25, 2014, from http://www.whitehouse.gov/omb/factsheet/supporting-small-businesses-and-creating-jobs.
- Oh, H., Yoon, S., & Shyu, C. (2008). How can virtual reality reshape furniture retailing? Clothing and Textiles Research Journal, 26, 143–163.10.1177/0887302X08314789
- Ott, L., & Longnecker, M. T. (2010). An introduction to statistical methods and data analysis (6th ed.). Belmont, CA: Brooks/Cole Cengage Learning.
- Parmenter, D. (2009). Key performance indicators: Developing, implementing, and using winning KPIs. Hoboken, NJ: Wiley.
- Penrose, E. (1995). The theory of the growth of the firm (3rd ed.). Oxford: Oxford University Press. 272 pp.10.1093/0198289774.001.0001
- Pirraglia, A., Saloni, D., & van Dyk, H. (2009). Status of Lean manufacturing implementation on secondary wood industries including residential, cabinet, millwork, and panel markets. BioResources, 4, 1341–1358.
- Quesada, H., & Gazo, R. (2006). Mass layoffs and plant closures in the US wood products and furniture manufacturing industries. Forest Products Journal, 56, 101–106.
- Rea, L., & Parker, R. A. (2005). Designing and conducting survey research : A comprehensive guide (3rd ed.). San Francisco, CA: Jossey-Bass.
- SAS. (2008). JMP 8.0. Cary, NC: SAS Institute.
- Schuler, A., Adair, C., & Winistorfer, P. (2005). Challenge and response, strategies for survival in a rapidly changing forest products industry. Engineered Wood Journal, Fall 2005, 23–25.
- Schuler, A., & Buehlmann, U. (2003). Identifying future competitive business strategies for the U.S. Residential Wood Furniture Industry: Benchmarking and paradigm shifts. Newton Square, PA: USDA Forest Service. Retrieved January 17, 2010, from http://www.fs.fed.us/ne/newtown_square/publications/technical_reports/pdfs/2003/gtrne304.pdf
- Small Business Administration. (2010). Table of small business size standards. Department of Commerce, Small Business Administration (SBA). Retrieved February 2, 2010, from http://www.sba.gov/content/table-small-business-size-standards
- Small Business Administration. (2014). Small business trends. Department of Commerce, Small Business Administration (SBA). Retrieved February 25, 2014, from http://www.sba.gov/content/small-business-trends
- Spence, M. (2011). Globalization and unemployment. Foreign Affairs, June 2. Council on Foreign Relations.
- Steelcase. (2006). Steelcase receives Shingo prize for manufacturing excellence. Steelcase. Retrieved October 18, 2010, from http://ir.steelcase.com/releasedetail.cfm?releaseid=371341
- Storey, D. J. (2003). Entrepreneurship, small and medium sized enterprises and public policies. In J. Zoltan, B. David, & B. Audretsch (Eds.), Handbook of entrepreneurship research: An interdisciplinary survey and introduction (pp. 473–514). New York, NY: Springer Science+Business Media.
- Stuart, I., & Boyle, T. (2007). Advancing the adoption of ‘Lean’ in Canadian SMEs. Ivey Business Journal Online. Retrieved October 26, 2010, from http://proquest.umi.com.ezproxy.lib.vt.edu:8080/pqdlink?index=39anddid=1399135151andSrchMode=1andsid=1andFmt=3andVInst=PRODandVType=PQDandRQT=309andVName=PQDandTS=1288063234andclientId=8956
- Umble, E. J., Haft, R. R., & Umble, M. M. (2003). Enterprise resource planning: Implementation procedures and critical success factors. European Journal of Operational Research, 146, 241–257.10.1016/S0377-2217(02)00547-7
- U.S. Census Bureau. (2009a). Detailed statistics NAICS 321. 2007 Economic Census. Retrieved November 27, 2010, from http://factfinder.census.gov/servlet/IBQTable?_bm=yand-ds_name=EC0700CADV1and-NAICS2007=321and-_lang=en
- U.S. Census Bureau. (2009b). Detailed statistics NAICS 322. 2007 Economic Census. Retrieved November 27, 2010, from http://factfinder.census.gov/servlet/IBQTable?_bm=yand-ds_name=EC0700CADV1and-NAICS2007=322and-_lang=en
- U.S. Census Bureau. (2009c). Detailed statistics NAICS 337. 2007 Economic Census. Retrieved November 27, 2010, from http://factfinder.census.gov/servlet/IBQTable?_bm=yand-ds_name=EC0700CADV1and-NAICS2007=337and-_lang=en
- U.S. Census Bureau. (2010a). Detailed statistics SME NAICS 321. American Fact Finder. Retrieved November 30, 2010, from http://factfinder.census.gov/servlet/IBQTable?_bm=yand-ds_name=EC0731SG2and-NAICS2007=321and-_lang=en
- U.S. Census Bureau. (2010b). Industry statistics sampler – NAICS 321. Author. Retrieved September 8, 2010, from http://www.census.gov/cgi-bin/naics/index.cgi
- U.S. Census Bureau. (2010c). Industry statistics sampler – NAICS 337. Author. Retrieved September 8, 2010, from http://www.census.gov/cgi-bin/naics/index.cgi
- Virginia Workforce Connection. (2010). Quarterly census of employment and wages (QCEW). Commonwealth of Virginia. Retrieved March 2, 2010, from http://www.vawc.virginia.gov/analyzer/searchAnalyzer.asp?cat=HST_EMP_WAGE_INDandsession=IND202andsubsession=99andtime=andgeo=andcurrsubsessavail=andincsource=andblnStart=True
- Wessel, D. (2010). Did great recession live up to the name? The Wall Street Journal. Retrieved October 24, 2010, from http://online.wsj.com/article/SB10001424052702303591204575169693166352882.html
- Westhead, P., & Storey, D. (1996). Management training and small firm performance: Why is the link so weak? International Small Business Journal, 14, 13–24.10.1177/0266242696144001
- Womack, J. P., & Jones, D. T. (2003). Lean thinking: Banish waste and create wealth in your corporation (1st ed.). New York, NY: Free Press.
- Womack, J. P., Jones, D. T., & Roos, D. (1990). The machine that changed the world: Based on the Massachusetts Institute of Technology 5-million dollar 5-year study on the future of the automobile. New York, NY: Rawson Associates.
- Wood Products Manufacturers Association. (2010). Manufacturer index of WPMA members. Wood Products Manufacturers Association (WPMA) – The Association of Choice for the Secondary Wood Products Industry. Retrieved September 8, 2010, from http://www.wpma.org/member_links.asp

