
 ?Mathematical formulae have been encoded as MathML and are displayed in this HTML version using MathJax in order to improve their display. Uncheck the box to turn MathJax off. This feature requires Javascript. Click on a formula to zoom.
ABSTRACT
The control rooms of organizations such as bus rapid transports and automated railroad systems have changed from conventional systems with analogue equipment to modern systems with digital equipment. These changes have necessitated adaptations in the responses and habits of operators carrying out tasks. Although enhancing the system from conventional to modern is intended to improve the system performance, it often exerts the opposite effect. Therefore, the risk of decreased operator performance needs to be evaluated. This research develops a design framework incorporating comprehensive dimensions for evaluating operator performances in digital control rooms. The evaluation is based on the theory of ergonomics and is implemented by the analytical hierarchical process and fuzzy set theory. The framework has been empirically tested in digital control room for bus rapid transport and thus, it can be customized and implemented to design the work and workplace of digital control rooms for public transport design.
1. Introduction
The control room is the main control unit of a system. In an automatic railroad system, the control room is where dispatchers control the road signals and stop the train directly. These tasks were previously performed by machine operators. In other systems such as Bus Rapid Transit, the operator in the control room oversees all bus operational activities, including the number of departing buses, the bus routes, passenger pick-up times and arrangements for passenger accumulation at stops. As errors occurring in the control room can be fatal, the performance of the control room operator must be assured.
Conventional control rooms rely on analogue instruments and control systems, but modern control rooms have replaced this antiquated equipment with digital equipment (Boring et al., Citation2018). The digitized systems in modern control rooms increase the automation level of the system. All information is collected and analyzed by computers and all or several complex decisions and actions are automatically made by computers. Consequently, modern control rooms are more complex than conventional control rooms (Salo et al., Citation2006). Such complexity influences the safety, operational, engineering, regulatory and financial performances of the system. Even small changes to board layouts can largely affect the control technology behind the boards (Liu & Li, Citation2016).
Automation influences the way in which operators interact with control systems, with possible negative effects on performance (Coupat et al., Citation2016; Meshkati, Citation2006; O’Hara & Brown, Citation2002). Although the assistance provided by modern control systems can enhance the operator performance (Ha et al., Citation2007; Salo et al., Citation2006) other studies have reported that the complexity of modern control systems increases the workload burden of the operator, which is especially problematic in emergencies (Coupat et al., Citation2016). This occurs when the role of the operator overtakes that of the control system in automatic decision making (Tsao et al., Citation2007). Especially in an emergency situation, the control system displays much information that can compromise the speed and correctness of the operator’s decision. The operator’s reaction time decreases when many data are available because the operator is placed under high pressure (Boring et al., Citation2018). Therefore, automation and digitization do not always positively impact on the user performance. In fact, performance is affected by many factors, including adaptation ability to the new system.
Many studies have evaluated operator performance in control rooms, using many dimensions of human performance (Chang & Yeh, Citation2010; McLauglin, Citation2007; Salo et al., Citation2006; Wang et al., Citation2018). However, the dimensions of human performance are interrelated (Jung & Jung, Citation2001; Wilson, Citation2014). Performance relates not only to the type of work, but also to how the work is done or work design, and the location of the work (Naumann et al., Citation2013). Poor workplace design is one of the many work environment issues found in developing countries (Abeid, Citation2015). Further, in 2015, Abeid stated that work environment problems are among the main factors that cause low performance and health problems for workers (Abeid, Citation2015). Digitization in a control room alters both the role of the operator and the operator’s work design, including the task division, workload, position at work and others. It also changes the design (layouts, displays and many other facets) of the control room workplaces.
The above background highlights the need for an integrated performance evaluation of control room operators. The evaluation system must assess each dimension of human performance and each aspect of the workplace, including the type of work, the work design and the workplace itself. An integrated evaluation will be more optimal than an evaluation that considers specific aspects only. Inappropriately designed tasks and workplaces increase the error and accident rates, the sick time, number of faulty judgements and productivity losses (Fang et al., Citation2015).
Previous research on the control rooms of train traffic, air traffic, nuclear power plants and various other industries have evaluated the dimensions of human performance separately (Edwards & Martin, Citation2017; Kyriakidis et al., Citation2018; McLauglin, Citation2007; Salo et al., Citation2006; Thomas et al., Citation2001; Truschzinski et al., Citation2018; Xu et al., Citation2018). Other studies have integrated the dimensions of human performance but have not comprehensively covered these dimensions (Boring et al., Citation2018; J Lee et al., Citation2015; Wilson, Citation2014; Yang et al., Citation2017; Zou et al., Citation2017). We are unaware of any human performance evaluation that directly leads to both work design recommendations and workplace design. To fill this research gap which can be seen in , the present study develops a design framework that evaluates the operator performance in digital control rooms by considering all dimensions and all aspects that can affect the operator performance, with the aim of providing more appropriate design recommendations.
Table 1. Variables and measurement tools
2. Methodology
In 2007, Mock-McLaughlin proposed a mathematical model for the risk level of human performance considering the workload (the amount of work), fatigue (tiredness or exhaustion because of lack of energy or strength) and stress (emotional or physical tension generated due to demands in one’s job; McLauglin, Citation2007). This mathematical model is based on a case study of a NASA Control Room and excludes other scenarios such as the Air Traffic Control Room or the Power Plant Main Control Room. Mock-McLaughlin’s model includes four out of five fatigue variables and six stress variables. Although the fatigue and stress scores are significant in control rooms, they are not independent (J Lee et al., Citation2015). Therefore, this framework may not emphasize the characteristics of the control room itself.
On the contrary, study on a Railway Control Room considers fatigue as the main influencer of operator functionality (Grozdanovic & Janackovic, Citation2018). This study also evaluated the efficiency and suitability of the control room design, especially the placement of displays, control desks and other aspects of workers’ workstations. However, as this study did not consider specific tasks, it could not assess the workload and stress of workers incurred by the work design of the organisation.
The present framework modifies the model of Mock-McLaughlin based on the three main factors affecting the operator’s performance as seen in . The variables of each factor are selected based on a literature review and the opinions of two experts from different backgrounds (an ergonomist and an operator in the digital control room of a Bus Rapid Transit).
Figure 1. Proposed model.
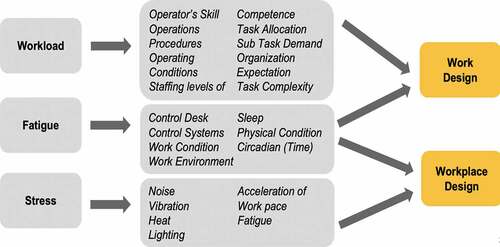
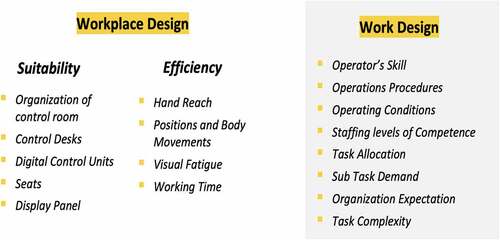
Figure 2. Variables of workplace design and work design.
The modern control room increases the eye movement, risking eye fatigue which was not considered as a main concern in the previous study of human factors theory and industrial field conditions. In 2004, Naser developed a guideline for control room design based on human factors and ergonomics (Naser, Citation2004). There are several things that need to be considered, such as display information, management and interface interactions, control systems, alarm systems, computer-based procedure systems, computerized systems supporting operators, communication systems, as well as work stations and workplaces (Naser, Citation2004).
The variables selected in the present study consider the multiple main characteristics of a complex control room. The experts also rated the weights assigned to the three human performance factors based on analytical hierarchical process (AHP) procedures. The data retrieval was based on the variables selected for each factor. The methods will be explained in the next sub-section. The retrieved data were the recordings of all work completed by the control room operator (Balfe et al., Citation2015; Thomas et al., Citation2001; Xu et al., Citation2018; Zou et al., Citation2017). Of course, the operator’s personal data such as gender, age, physical condition, job position, length of employment and work experience cannot be ignored.
The non-important variables to be eliminated were determined by linear regression. Variables with a high p value were removed from the equation, and re-entered if their removal increased the mean squared error (MSE). If additional variables needed to be removed, the Durbin–Watson statistic was also applied. Variables were removed until the MSE increased or no other factors had large p values (p > 0.005).
2.1. Direct performance
Human performance is generally defined as the ability of a human to complete a required task. Operators in a control room must monitor the situation, identify problems and make decisions. Errors interfere with the completion of the task level in the required time. In Mock-McLaughlin’s study, the operator performance was improved by repeated performance, problem identification, problem resolution and effective communication (McLauglin, Citation2007). In other studies, operator performances in the control rooms of various industries were evaluated by human error measured by the human error assessment and reduction technique, the error of commission or the Cochran–Weiss–Shanteau index (Thomas et al., Citation2001; Wang et al., Citation2018; Yang et al., Citation2017). Many studies also regard situation awareness, which governs the operator’s decision making in the control room, as a variable (Boring et al., Citation2018; SW Lee et al., Citation2016; Sethumadhavan, Citation2011). Situation awareness is usually measured subjectively by operators using the situation awareness rating technique. In this study, performance appraisal was carried out by an expert in the control room, who assessed the work quality, motivation, problem solving and decision making on a scale of 1–4.
2.2. Workload
The measurement of various stresses which influence the performance and responses of a human operator is called the workload (Weiner, Citation1982). The workload is commonly measured by the validated NASA task load index (TLX). In the NASA TLX, the workload variables are mental demand, physical demand, temporal demand, effort, performance and frustration. In the railway control room case, several measures were developed specifically for railway control-room operators (traffic dispatchers), such as the OCC controller workload and the integrated workload scale (Balfe et al., Citation2015; Fang et al., Citation2015). Several studies have assessed the operator’s workload by the perceived workload based on the operator’s self-assessments and their pupillary responses (Edwards & Martin, Citation2017; Truschzinski et al., Citation2018). In this study, the operators’ workloads were evaluated from the variables of the NASA LTX. Various problems were also considered in this study.
2.3. Fatigue
Mock-McLaughlin used the five fatigue variables in the Swedish Occupational Fatigue Inventory: lack of motivation, sleepiness, physical discomfort, physical exertion and lack of energy. She also measured the total body fatigue, the heart rate, tone task reaction time, level of tiredness, a number of mental fatigue symptoms and various physical symptoms (McLauglin, Citation2007). Another study used variables defined in the Multidimensional Fatigue Inventory (MFI–20) – general fatigue, physical fatigue, mental fatigue, reduced motivation and reduced activity – as fatigue factors in operator control rooms (McLauglin, Citation2007). Other studies evaluated the fatigue factors in control-room cases by eye fatigue, because visual fatigue is influenced by the screen-based information and displays in modern control rooms that were absent in conventional control rooms*(Bazazan et al., Citation2019). Eye fatigue is characterized by perceived tired eyes, irritation and reduced eye accommodation (flickering in front of the eyes and blurred vision) assessed in questionnaires, along with eye movements, eye fixations and pupil dilation measured by an Eye Tracker (Boring et al., Citation2018; Grozdanovic & Janackovic, Citation2018). In this study, the operator’s fatigue was measured by the MFI–20 and a visual fatigue questionnaire.
2.4. Stress
Work stress has been described as an incompatibility between the individual and his or her work environment. Stress has a proven negative effect on human performance, especially in decision making (David, Citation1996; Ickens et al., Citation2000; Klein, Citation1996). Stress is usually measured by blood pressure, heart rate and job satisfaction (Ickens et al., Citation2000; McLauglin, Citation2007). Job satisfaction, stress level and sense of control can be measured by the Job Descriptive Index. The Job Stress and Turnover Tendency Questionnaire was developed specifically for measuring job stress in the control-room environments of air traffic control. This questionnaire evaluates seven factors: workload, role conflict, human relations, family factors, work environment, job satisfaction and tendency to change employment (Jou et al., Citation2013). To characterize the digital control-room environment, the present study combined blood pressure measurements with the job stress and turnover tendency questionnaire.
The data were collected from a Bus Rapid Transit control room in Indonesia, commonly called the Command Centre, which has the authority to regulate and control route assignments and bus operational times and to respond directly to emergencies and unexpected events. The Command Centre oversees 13 corridors, 155 routes and 1300 buses carrying approximately 144.27 million passengers per year (~663,000 passengers per day).
Each operator is responsible for one bus corridor. Operators are expected to monitor the speed of each bus, arrange buses to reduce the buildup of passengers at bus stops, monitor bus stops by a closed-circuit television system during emergencies and report on the corridor conditions once every hour. The daily performance of the operators is measured by the suitability of reports based on customer complaints entering the Command Centre.
Data collection was carried out for three days, on Monday when the load was assumed to be the highest, Sunday when the load was assumed to be the lowest and Friday when the load was assumed to be high. Each day the data was collected twice, once in each morning shift at 06.00–14.00 and once in the afternoon shift at 14.00–22.00.
The respondents were Command Centre officers on morning and evening shifts (up to 10 personnel per shift). The average age of the officers is 35 years (± 7 years). Officers have worked in the Command Centre for 1–6 years. All officers had previously been field officers for 2–11 years. Field officers must report incidents that cannot be monitored from the Command Centre, and arrange the field directly as instructed by the Command Centre. Officers with a medical history of cardiovascular disease, chronic stress and chore fatigue were eliminated from the study.
2.5. Multiple regression backward elimination
Backward Elimination is a variable selection algorithm for multiple linear regression that involves starting with all candidate variables, testing the elimination of each variable using the selected model fit criteria, removing the variable (if any) whose loss provides the least statistically significant regression of the model fit, and repeats this process until no further variables can be removed without losing a statistically significant match. Backward Elimination method is an economical procedure. It tries to check only the ‘best’ regressions containing a number of variables. This process was done to choose what variables are important or affect a factor. In this study there are three factors; workload, fatigue, and stress (Draper & Smith, Citation2014).
All variables measured by their respective measuring instruments were removed by multiple regression backward elimination. All variables and their measurement tools are listed in . The selected workload factors were the mental load, time, business, frustration and number of problems (MSE = 24.331). The selected fatigue factors were general fatigue, mental fatigue, eye fatigue, physical fatigue and decreased activity (MSE = 96.031). Finally, the selected stress factors were effort, mental load, mental fatigue, eye fatigue, tendency to change employment and blood pressure (MSE = 892.089).
2.6. Analytic hierarchy process
The Analytic Hierarchy Process (AHP) was introduced by Thomas Saaty (1980), AHP is an effective tool as a complex decision-making method, and can help users to set priorities and provide the best decision-making reference. AHP reduces the complexity of a decision by turning it into a series of pairwise comparisons and then synthesizing the results. AHP can accommodate subjective and objective aspects of a decision. In addition, AHP has a useful technique for checking the consistency of decision-makers’ evaluations, so as to reduce bias in the decision-making process (Saaty, Citation1987).
The main objective of AHP is to weight each variable and factor, and calculate the performance risks of the Command Centre officers (which can reduce their performance). The performance risk consists of three factors at the first level (workload, fatigue and stress), and sub-criteria based on the previous regression results at the next level.
The first step in AHP is to create a hierarchy that is sufficient to describe the situation at hand. The hierarchy consists of the focus to be addressed, the existing criteria, and the sub-criteria that make up the criteria, and are usually included with the available alternatives. Pairwise comparison is the basis of AHP. The next step, parliamentarians or more commonly referred to as experts assess the main criteria by comparing each criterion with other criteria in pairs to get the importance value of each criterion and a pairwise comparison matrix. The next step is for the experts to compare each sub-criteria included in each main criterion. Each dimension has some question items with a Likert scale of 1 (agree) to 5 (disagree). More detailed scale of values are shown in .
Table 2. AHP values interpretation
The AHP was assessed by two subject-matter experts, an ergonomics and human factors expert and an expert working at the Transportation Command Centre. The AHP results are shown in .
Table 3. AHP results
2.7. Fuzzy set theory
Fuzzy modeling is the use of fuzzy set theory to represent the status of an entity, or its parameters, in a particular situation or environment. The fuzzy set A is indicated by the membership function A(x). Unlike conventional (crisp set theory), where objects either inside or outside the set it is possible to have partial membership and this development aptly represents the way in which cumulative trauma disorder develops. Fuzzy modeling is more compatible than random probabilistic modeling when representing the occurrence of CTD risk factors or the development of injury (Zimmermann, Citation2011).
Fuzzy set theory considers the impact of each variable on the system and the interactions among the variables. Fuzzy set theory is applicable to human performance factors and to variables with connections to other variables. Because the fatigue, workload and stress interact, these variables can involve the same factors. At this stage, each variable is assessed for its linguistic risk level and its membership degree is calculated for each of its values. Finally, each value is normalised to the range 0–1. The closer to lift 1, the greater the value of the existing risk level.
2.8. Mathematical model
After determining the variables of each factor based on the expert assessments and linear regressions, a mathematical model was developed using the AHP and fuzzy set theory. The combination of these two techniques is suitable for classifying risk levels of human performance.
The general mathematical model is formulated as follows:
where the functions F, S and W refer to fatigue, stress and workload, respectively. The variables of these functions are rated by experts through AHP procedures. The coefficients a1 – an of the fatigue factors depend on the numbers of variables selected in the study. The coefficients b1 – bn and c1 – cn are the coefficients of the stress and workload factors, respectively. Each variable is then measured and transformed into a fuzzy number. The x–is are the fuzzy values of the variables obtained by fuzzy set theory and AHP.
Each score is classified into one of five risk levels, as described in .
Table 4. Risk levels
The model was validated in two ways: by comparing the fuzzy results with the results of calculations commonly used in industry, and by comparing the generated risk with the performances of individuals in the field. The final mathematical model is formulated as follows:
F = weight of fatigue; x1 – xi = variable weight of fatigue
S = weight of stress; y1 – yi = variable weight of stress
W = weight of workload; z1 – zi = variable weight of workload
3. Results
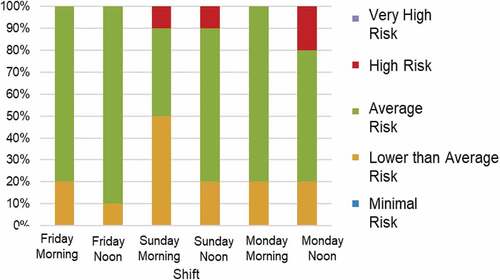
As shown in , most of the individuals fitted into the average risk category, meaning that they probably experience one or more subcomponents of the main factors that can affect their work performance. A few individuals were assessed as high risk, implying that their work performance is greatly affected by one or more subcomponents of the main factors. Meanwhile, individuals in the lower risk levels are only slightly compromised by one or more sub-components of the main factors.
Figure 3. Classification of risks by shift and severity level.
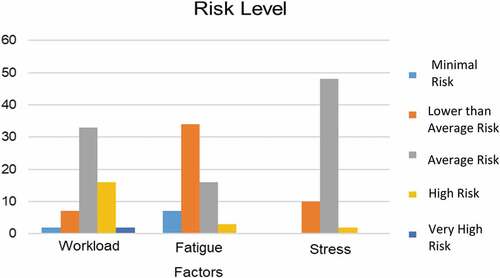
shows the numbers of individuals in the various risk levels of the main factors affecting work performance. The workload tended to score more highly than other factors, with 16 high-risk individuals; however, because most of those individuals did not score highly on the other two factors, their overall risk was average. Three individuals scored a high total risk dominated by fatigue, and one individual assessed at very high risk reported a high workload and high risk of stress. The analysis cannot be performed by simply examining the final scores, because this overall picture would ignore the 16 individuals with a high total risk and two individuals with a very high workload risk, but who scored a low risk of the other factors.
Figure 4. Classification of risks by category and severity level.
The workload can be influenced by the ability of the operator, operating procedures, compatibility between placement and competence level, work allocation, additional burden of certain tasks, organizational expectations and the complexity of the task. Regarding the ability of operators, Command Centre officers are not offered specialised training in tasks requiring decision making, controlling the field and negotiation with drivers who violate the rules. The training provided by the organisation is limited to basic computer training. Only five personnel have a bachelor’s diploma and two have a D3 diploma; the remainder graduated only with a high school or vocational diploma.
The second influencing variable is organizational expectations. Before working at the Command Centre, the officers worked as controllers in the field. The observations suggest that the organisation considers the Command Centre as an easier and lighter work environment than working in the field, which involves more physical activity. However, some officers consider that working in the Command Centre is more difficult than field work because it requires thinking, counting, remembering and decision-making skills that are not needed in the field. To clarify, the tasks are divided between the field officers (reporting events in the field) and central officers (ensuring the running of the system, making decisions and documenting events). The field officers then carry out the decisions made at the Command Centre. In addition, 50% of the officers reported a lack of support from their superiors in their Job Satisfaction questionnaire. Thus, organizational and individual expectations need to be equated and achieved together.
4. Discussions
In 2007, Jessica Lynn Mc Lauglin made a mathematical model for the level of risk of human performance from the aspect of workload, fatigue, and stress (McLauglin, Citation2007). This mathematical model is based on the NASA Control Room case study where the use of the model does not include other cases such as the Air Traffic Control Room or the Power Plant Main Control Room. The results of that research indicated that workload contributed most to a change in human performance. Fatigue was shown to contribute least to human performance. Same as the previous research, it can also be seen that in this study the workload has a tendency to be at a high score compared to other factors.
For the workload factor, the variables that were not eliminated were mental burden, time burden, effort, and frustration. Slightly different from previous studies where the variables of physical load and blood pressure were variables that were not eliminated. However, other variables that became the results of this study were the same as those of previous studies. In the opinion of the officers, there is no significant physical burden that becomes a burden for them. The demands of work do not require physical use such as pushing, pulling, lifting, or controlling heavy objects. The only tool needed is a computer with 3 screens.
The literature has revealed that limited research has been carried out to analyze the psychological aspects of any given task due to the subjectivity on the part of the workers. Multiple results suggest that this is a different perception of cognitive demands on workers. The console observations are mostly mental in nature, and as such can help to explain the large contribution of workloads to human performance. By assessing tasks to understand how they impact workers, management can use the results to reassign workers to fit into the task more effectively.
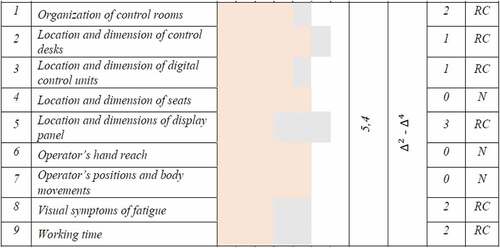
Based on the evaluation chart shown in , the following recommendations are suggested for specific workplaces. The location and dimensions of the display panel (5), symptoms of visual fatigue (8) and working time (9) have the highest ergonomic standard margins among the ergonomic parameters. Along the display-panel dimension, only one of the five display panels on the front screen is clean; the other four are blurry because their images are projected by a projector. This can exacerbate the second ergonomic parameter, eye fatigue, because the officer must watch three screens at once at the desk, and another large screen at the front of the room, with rather dim lighting. In one observation, the officers’ eyes became red after continuous viewing of the screen. Further eye examinations may be needed because few of the officer wear glasses. The third parameter is work time. The shifts in the Command Centre have been arranged so that each shift has only one rush hour. However, the time differences of shift work usually disturb the workers’ rest periods, regardless of whether they rise early or sleep later.
Figure 5. Workplace evaluation results.
5. Conclusion
This study proposed a design framework for digital control room by measuring the risk of human performance and it has been empirically tested in a bus rapid transport problem. This framework considers how the designs of the control room and its work allocation influence the operators. All designs affected the workload, stress and fatigue experienced by the operators, providing a benchmark for measuring the human performance risk of operator control rooms. Using various theories and ergonomic methods, the evaluation measures the workload, fatigue and stress factors by selecting variables that accord with the characteristics of modern control rooms, which greatly differ from those of conventional control rooms. The calculation gives a single score that classifies the risk level of the control room, and an individual score for each of the three main factors that contribute to overall performance risk.
The developed framework demonstrates how the risk level of human performance in a control room system is based on a combination of workload, fatigue and stress risks. With the single score and classification scores, users can easily understand the current condition of the control room. The model also clarifies the most influential aspects and the risk factors that degrade human performance. By acknowledging the gaps in their systems, users can efficiently and effectively improve the work environment of their control rooms in future.
Although guidance for designing a harmonious system for control rooms is already available, identifying points of concern that immediately degrade the performance of the operator will improve the precision and economy of addressing those concerns.
Due to the nature of the research, in this study, the measurement of workload, fatigue, and stress is still mostly using a questionnaire that is assessed by the individual himself. Future research can consider more physiological measurements as a comparison and validation for the results of self-questionnaire measurements.
This study does not pay attention to the internal system or software used by officers to control operational conditions, further research can take internal systems and software into consideration in evaluating human performance in the control room.
Disclosure statement
No potential conflict of interest was reported by the author(s).
Additional information
Funding
References
- Abeid, A. (2015). Investigation of workplace environment: the case of selected micro and small manufacturing enterprises in tanzania International Journal of Engineering Research and Technology (IJERT), 4(6), 74–81. ISSN 2278–0181 .
- Balfe, N., Sharples, S., & Wilson, J. R. (2015). Impact of automation: measurement of performance, workload and behaviour in a complex control environment. Applied Ergonomics, 47(1), 52–64. https://doi.org/10.1016/j.apergo.2014.08.002
- Bazazan, A., Dianat, I., Mombeini, Z., Mohammad, A., Ignacio, H., & Castellucci, H. I. (2019). Effect of a posture correction. Based Intervention on Musculoskeletal Symptoms and Fatigue among Control Room Operators, 76(1), 12–19. https://doi.org/10.1016/j.apergo.2018.11.008
- Boring, R. L., Ulrich, T. A., Lew, R., Kovesdi, C. R., Al Rashdan, A. (2018). A comparison study of operator preference and performance for analog versus digital turbine control systems in control room modernization. Nuclear Technology, 205(4), 1–17 https://doi.org/10.1080/00295450.2018.1509593
- Chang, Y., & Yeh, C. (2010). Human performance interfaces in air traffic control. Applied Ergonomics, 41(1), 123–129. https://doi.org/10.1016/j.apergo.2009.06.002
- Coupat, R., Philippot, A., Annebicque, D., Gellot, F., & Riera, B. (2016). Automation for improve of mental workload of the systems engineer. IFAC-PapersOnLine, 49(19), 555–560. https://doi.org/10.1016/j.ifacol.2016.10.624
- David, W. (1996). Stress and performance in complex domains: a psychophysiological field study of a command-and-control system.
- Draper, N. R., & Smith, H. (2014). Selecting the “ Best ” Regression. Applied Regression Analysis, 2(I), 327–368. https://doi.org/10.1002/9781118625590.ch15
- Edwards, T., & Martin, L. (2017). The relationship between workload and performance in air traffic control. H-WORKLOAD: International Symposium on Human Mental Workload: Models and Applications June 2017. 28–30. 726 Switzerland: 2017 Springer International Publishing AG. Dublin, Ireland. 120–139 https://doi.org/10.1007/978-3-319-61061-0_8.
- Fang, W., Liu, Y., Guo, B., & Zhang, Y. (2015). OCC controller workload evaluation model and application. Procedia Manufacturing, 3(1), 3246–3253. https://doi.org/10.1016/j.promfg.2015.07.876
- Grozdanovic, M., & Janackovic, G. L. (2018). The framework for research of operators’ functional suitability and efficiency in the control room. International Journal of Industrial Ergonomics, 63(1), 65–74. https://doi.org/10.1016/j.ergon.2016.10.009
- Ha, J. S., Seong, P. H., Lee, M. S., & Hong, J. H. (2007). Development of human performance measures for human factors validation in the advanced MCR of APR-1400. IEEE Transactions on Nuclear Science, 54(6), 2687–2700. https://doi.org/10.1109/TNS.2007.907549
- Ickens, C. D., Hollands, J. G., Hall, P., Wickens, C. D., & Hollands, J. G. (2000). Engineering Psychology and Human Performance. Prentice-Hall.
- Jou, R., Kuo, C., & Tang, M. A. (2013). Study of job stress and turnover tendency among air traffic controllers: the mediating effects of job satisfaction. Transportation Research Part E: Logistics and Transportation Review, 57(1), 95–104. https://doi.org/10.1016/j.tre.2013.01.009
- Jung, H. S., & Jung, H. (2001). Establishment of overall workload assessment technique for various tasks and workplaces. International Journal of Industrial Ergonomics, 28(6), 341–353. https://doi.org/10.1016/S0169-8141(01)00040-3
- Klein, G. (1996). The effect of acute stress on decision making. Eds. James E. Driskell, Eduardo Salas. In Stress and human performance. Erlbaum 311.
- Kyriakidis, M., Majumdar, A., & Ochieng, W. Y. (2018). The human performance railway operational index — a novel approach to assess human performance for railway operations. Reliability Engineering & System Safety,170(1), 226–243. https://doi.org/10.1016/j.ress.2017.10.012
- Lee, S. W., Kim, A. R., Park, J., Kang, H. G., & Seong, P. H. (2016). Measuring situation awareness of operating team in different main control room environments of nuclear power plants. Nuclear Engineering and Technology, 48(1), 153–163. https://doi.org/10.1016/j.net.2015.09.008
- Lee, J., Lee, H. K., & Cho, J. H. (2015). A study on the relationship between stress and fatigue and the musculoskeletal symptoms experienced by Korean radiation workers. Journal of Physical Therapy Science, 27(2), 427–431. https://doi.org/10.1589/jpts.27.427
- Liu, P., & Li, Z. (2016). Comparison between conventional and digital nuclear power plant main control rooms: a task complexity perspective, part I: overall results and analysis. International Journal of Industrial Ergonomics, 51(1), 10–20. https://doi.org/10.1016/j.ergon.2014.06.011
- McLauglin, J. L. (2007). Stress, fatigue and workload: determining the combined effect on human performance. University of Central Florida.
- Meshkati, N. (2006). Safety and human factors considerations in control rooms of oil and gas pipeline systems: conceptual issues and practical observations. International Journal of Occupational Safety and Ergonomics: JOSE, 12(1), 79–93. https://doi.org/10.1080/10803548.2006.11076669
- Naser, J. U.S. Department of Energy (2004) Palo Alto, California: Electric Power Research Institute, Inc. Human factors guidance for control room and digital human-system interface design and modification.
- Naumann, A., Grippenkoven, J., Giesemann, S., Stein, J., & Dietsch, S. (2013). Rail human factors-human-centred design for railway systems. IFAC, 46(15) 330–332. https://doi.org/10.3182/20130811-5-US-2037.00095
- O'Hara, J. & Brown, W. United States Nuclear Regulatory Commission. (2002). The effects of interface management tasks on crew performance and safety in complex, computer-based systems. Washington, DC: U.S. Nuclear Regulatory Commission.
- Saaty, R. W. (1987). The analytical hierarchy process - what and how it is used. Mathematical Modelling, 9(3), 161–176. https://doi.org/10.1016/0270-0255(87)90473-8
- Salo, L., Savioja, P., & McAllen, R. M. (2006). Operator experiences on working in screen-based control rooms. Clinical and Experimental Pharmacology & Physiology, 33(12), 1255–1258. https://doi.org/10.1111/j.1440-1681.2006.04520.x
- Sethumadhavan, A. (2011). Effects of first automation failure on situation awareness and performance in an air traffic control task proc. Proceedings of the Human Factors and Ergonomics Society Annual Meeting, 2007(1), 350–354. https://doi.org/10.1177/1071181311551072
- Thomas, R. P., Willems, B., Shanteau, J., Raacke, J., & Friel, B. (2001). Measuring the performance of experts: an application to air traffic control. The Journal of Biological Chemistry, 276(5), 3408–3416. https://doi.org/10.1074/jbc.M002884200
- Truschzinski, M., Betella, A., Brunnett, G., & Verschure, P. F. M. J. (2018). emotional and cognitive influences in air traffic controller tasks: an investigation using a virtual environment. Applied Ergonomics, 69(1), 1–9. https://doi.org/10.1016/j.apergo.2017.12.019
- Tsao, L., Chang, J., & Ma, L. (2007). Fatigue of Chinese railway employees and its in fl uential factors: Structural equation modelling. Applied Ergonomics,62(1), 131–141. https://doi.org/10.1016/j.apergo.2017.02.021
- Wang, W., Liu, X., & Qin, Y. A. (2018). Modified heart method with FANP for human error assessment in high-speed railway dispatching tasks. International Journal of Industrial Ergonomics, 67(1), 242–258. https://doi.org/10.1016/j.ergon.2018.06.002
- Weiner, J. S. (1982). The measurement of human workload. Ergonomics, 25(11), 953–965. https://doi.org/10.1080/00140138208925057
- Wilson, J. R. (2014). Fundamentals of systems ergonomics/human factors. Applied Ergonomics, 45(1), 5–13. https://doi.org/10.1016/j.apergo.2013.03.021
- Xu, J., Anders, S., Pruttianan, A., France, D., Lau, N., Adams, J. A., & Weinger, M. B. (2018). Human performance measures for the evaluation of process control human-system interfaces in high-fidelity simulations. Applied Ergonomics, 73(1), 151–165. https://doi.org/10.1016/j.apergo.2018.06.008
- Yang, J., Kim, T., & Kim, J. (2017). Analysis of errors of commission for a ce type plant with the advanced control room in the full power condition. Annals of Nuclear Energy, 10(1), 184–195. https://doi.org/10.1016/j.anucene.2017.03.019
- Zimmermann, H. J. (2011). Fuzzy set theory—and its applications. Springer Science & Business Media.
- Zou, Y., Zhang, L., Dai, L., Li, P., & Qing, T. (2017). Human reliability analysis for digitized nuclear power plants: case study on the Lingao II nuclear power plant. Nuclear Engineering and Technology, 49(2), 335–341. https://doi.org/10.1016/j.net.2017.01.011