ABSTRACT
The digitalisation trend is affecting the manufacturing industry by adopting several emerging technologies that can increase the efficiency and output of production processes and operations. A growing body of literature shows that this trend demands a structural rethink of how companies do business. However, there is a lack of holistic contributions describing how aspects of manufacturing digitalisation align with the Business Model Innovation process. This study uses a bibliometric mapping approach to analyse the literature on manufacturing digital transformation through the Integrated Business Model (IBM) lens. The results identify the major research topics discussed in the analysed domain and propose an enriched IBM framework with specific descriptions and connections among the components and their relative strengths. Holistically, the resulting enhanced model may ultimately assist practitioners in understanding the innovation process of the BM triggered by technological shifts in their manufacturing, enabling an alignment of the manufacturing strategy with IBM’s components.
1. Introduction
The manufacturing industry is currently experiencing profound changes. In particular, the digitalisation trend is affecting the manufacturing domain, bringing several emerging digital technologies that deeply affect a manufacturing company’s operations and production processes in terms of increased efficiency and flexibility (Björkdahl, Citation2020; Pereira & Romero, Citation2017). These emerging digital technologies, such as the Internet of Things (IoT), Cloud Computing, and Big data and Analytics (Paschou et al., Citation2017), are considered the main technological enablers of the fourth industrial transformation labelled as Industry 4.0 (I4.0). In detail, I4.0 embraces these emerging digital technologies leading to the digitalisation of the current industrial domain, i.e. a digitalised and automatised production (Pereira & Romero, Citation2017) as well as a more integrated value chain (Björkdahl, Citation2020). Thus the full implementation of I4.0 strictly depends on the successful adoption of emerging digital technologies (Micheler et al., Citation2019).
Digitalisation is one of the first technological trends at the base of the fourth industrial revolution (Zangiacomi et al., Citation2020) by driving substantial changes in the production systems that are mainly IT-driven (Lasi et al., Citation2014). Literature thus shows that I4.0 is primarily based on the technology-push innovation in the application-based context and related operational domain (Frank et al., Citation2019). This work moves away from this trend and aims to support the investigation of the long-term impact of digitalisation in the challenge-driven research context. The such objective involves strategical considerations and results in radical changes in the mechanisms of creating, delivering, and capturing value (Björkdahl, Citation2020; Mugge et al., Citation2020), i.e. the holistic view of the Business model (BM).
The concept of BM in technical literature is often associated with the interfacing economic activity supporting the transaction: pay-per-use, subscription, lease, and ownership. This view is suitable for predictive research efforts connected with the operational dimension. On the other hand, the digitalisation of manufacturing cannot be analysed through such an interpretation of the BM concept. As previously mentioned, manufacturing digitalisation is a technology trend at the base of I4.0. The technology demands an application, i.e. how to propose, create and capture the embedded value in the technology to create innovation (Chesbrough, Citation2002). The adoption of digital technologies in manufacturing represents thus a challenge that involves a structural rethink of how companies do business (McKinsey, Citation2015), i.e. finding the proper application for the technology. Strategic literature presents a holistic concept of BM as a synthesis of this application process. In view of the above, the present work leverages a holistic understanding of the business model described in strategy-related research (Teece, Citation2010) and not with a specific set of processes related to value capturing, as seen in application-driven literature. In particular, this paper uses the concept of BM as a descriptive framework composed of several aspects that reflect how firms create, deliver, and capture value. Among the existing BM frameworks, the Integrated BM (IBM) introduced by (Wirtz et al., Citation2016) is a generic model that provides a comprehensive picture of the essential sub-models, i.e. the components of a BM, divided into strategy, customer and market, and value creation aspects. The IBM provides thus a baseline for discussing the different BM’s components in the analysed domain, and it is taken as a reference BM framework in this work.
In view of the above, the manufacturing industry’s digital transformation can be seen as a dynamic transition process that initiates the transition between two stable BM states – the current state and a future state (Maffei et al., Citation2019). The study of this dynamic process requires a comprehensive characterisation of the BM in all aspects to describe the future BM state. However, the literature in the focal domain lacks a complete description of the BM. On the one hand, there is abundant contribution focusing on the application of digital technologies in the context of manufacturing. On the other hand, the related description of the underpinning BM in manufacturing, is fragmented. The lack of a shared understanding of the BM prevents authors from building upon each other’s contributions. This work addresses such a knowledge gap by analysing the vast and fragmented body of literature through the lenses of a holistic understanding of the BM concept and extracting the valuable patterns in it that are presented through a shared framework enabling an increment of knowledge in the domain. The resulting framework thus proposes a vertical characterisation of the BM development domain based on state-of-the-art research, given the recent manufacturing trend towards digitalisation.
Given the identified gap and the aim of this work, the following research questions will be addressed:
How are the IBM components embodied in current literature on digital manufacturing transformation? And how such contributions can be used to vertically enrich IBM in such an area of investigation?
What relations can be identified among the IBM components within the analysed domain? And what is their strength?
A semantic analysis of the literature related to the digitalisation of the manufacturing industry was performed using a bibliometric mapping approach to address the research questions. The results of the analysis highlight the major research topics discussed in the area being investigated. These topics are classified according to the IBM framework providing a twofold outcome. On the one hand, the organised topics enrich the existing descriptions of IBM’s components with details regarding the domain of manufacturing digital transformation. This, in turn, provides a more vertical coverage of the IBM framework.On the other hand, the classified topics highlight which IBM component the research effort in the analysed domain is focused on. This, in turn, provides indications of the current research pattern contributing to the display of an explanatory model that includes aspects of the digital transformation process of manufacturing. Moreover, the semantic analysis highlights the relations among the components and the relative strengths of such connections.
2. Theoretical background
2.1. BM and Business Model Innovation (BMI) definitions
The definitions of BM and BMI are presented here because they are the basis of the whole literature section. Furthermore, the clarified description of BM and BMI converge in the framework proposed by (Maffei et al., Citation2019). This framework is the main reference for understanding those concepts, and it is used in this article to discuss the manufacturing industry’s digital transformation.
According to (Teece, Citation2010), the BM is an ‘architecture of the firm’s value creation, delivery, and appropriation mechanisms’. The extant literature has investigated which elements reflect the value creation, delivery, and capture of a BM (e.g. (Foss & Saebi, Citation2017; Hamel, Citation2001; Osterwalder et al., Citation2010; Osterwalder, Citation2004)); thus, a content-related perspective of the BM emerges (Wirtz et al., Citation2016). Building on the BM definition, (Foss & Saebi, Citation2017) define BMI as ‘designed, novel, and non-trivial changes to the key elements of a firm’s business model and/or the architecture linking these elements’. Given the above, the main difference between the concept of BM and BMI can be described as follows. On the one hand, the BM is a static concept that represents the layout of the designed elements at a specific moment. On the other hand, the BMI is a dynamic concept where the focus shifts depending on how a BM evolves (Demil & Lecocq, Citation2010), i.e. how the BM elements change to accommodate technology-driven (push) or challenge-driven (pull) innovation (Maffei et al., Citation2019).
2.2. Digital transformation processes and the BM transformation
The current digitalisation trend has radically affected companies’ business processes by pushing toward adopting and exploiting digital technologies (Zangiacomi et al., Citation2020). Digital technologies such as the IoT, Cloud Computing, and Big Data and Analytics (Paschou et al., Citation2017) applied specifically in manufacturing bring substantial changes to traditional production systems where inter-company connectivity among different stakeholders in the supply chain (Mueller et al., Citation2018) and process integration are introduced (Khan & Turowski, Citation2016), thus increasing the company’s overall efficiency. The changes brought by I4.0 are mainly IT-driven (Lasi et al., Citation2014), meaning that such digital technologies are the enablers of a digital industrial transformation that is often defined as the fourth industrial revolution or I4.0. Implementing I4.0 leads to process optimisation resulting in improved operations for the whole organisation. This is considered the main advantage of supporting the decision towards I4.0 implementation (Sony, Citation2020).
In view of the above, the digitalisation trend has initiated I4.0 (Zangiacomi et al., Citation2020), and it can be considered a technological push for I4.0 (Frank et al., Citation2019; Maffei et al., Citation2019). The implementation of digital technologies pushed in manufacturing is thus adding value to the company’s internal processes, mainly in terms of efficiency, for instance, reduced costs, greater flexibility, and increased productivity (Frank et al., Citation2019). However, it has been argued in the literature that the effect of such a technological push on manufacturing companies is not only related to achieving greater efficiency in production processes and operations (Björkdahl, Citation2020), and the adoption and exploitation of digital technologies also demand a significant transformation of a company’s BM as it changes the current way value is created, delivered, and captured (Björkdahl, Citation2020; Frank et al., Citation2019; Mugge et al., Citation2020). Such a technology-push innovation thus implies a radical BMI for manufacturing companies (Müller, Citation2019). In their literature review, (Agostini & Nosella, Citation2021) highlights that the innovation of the BM triggered by digitalisation is a broadly examined topic. The emergence of new BMs as an effect of I4.0 is one of the main topics of investigation in the existing literature (Kraus et al., Citation2018). As a result, business and strategic facets of the manufacturing industry’s digital transformation are now capturing the attention of scholars and practitioners by going beyond mere technological advancement (Agostini & Nosella, Citation2021).
However, how the BM of a manufacturing company engaging in digitalisation efforts is transformed remains poorly explored. The adoption of digital technologies impacts the company’s BM by transforming the current one into the desired one, including the new conditions arising from the technology shift. Such a BM transformation process can be modelled according to the framework proposed by (Maffei et al., Citation2019). The transformation can happen in two alternative ways. First, firms can change single components of their BM (Agostini & Nosella, Citation2021), i.e. they can make modular changes, and the current BM is thus modified to accommodate the newly introduced factor. In this case, a BMI is seen as a minor perturbation of the current BM (Maffei et al., Citation2019). Second, firms can change the whole BM (Agostini & Nosella, Citation2021), i.e. they can make structural changes, and in this case, the perturbation of the current BM requires a total re-alignment of the BM’s elements. The BMI is triggered in this case by a specific desired BM (Maffei et al., Citation2019).
In view of the above, the digital transformation of the manufacturing domain is a dynamic transition process that initiates the transition between the current BM state and the future BM (Maffei et al., Citation2019). Investigating this dynamic process asks for an in-depth characterisation of all the structural aspects of a BM to successfully describe the future BM.
2.3. BM frameworks
Scientific contributions in the BM domain have extensively investigated the structural aspects of a BM that have been referred to in different ways, such as the building blocks (Osterwalder et al., Citation2010), sub-models (Wirtz et al., Citation2016), elements (Chesbrough, Citation2002), and components (Morris et al., Citation2005). The latter is the preferred notation in this work. Scholars have presented the BM aspects using several descriptive frameworks reported in the following paragraphs.
In (Chesbrough, Citation2002) the authors describe the BM’s elements by listing the primary functions a BM should fulfil: to formulate a competitive strategy, which is the principal source of competitive advantage; to identify the firm’s position within the value network; to define the value proposition; to select the market segment; to structure the defined value chain, and to determine the cost structure and profit potential. This suggests a more operational definition of the elements. The major BM components presented by (Morris et al., Citation2005) are described by addressing the following six fundamental questions: the competitive strategy that delineates the competitive position of a firm in the market; the market factors that identify the customer target; the offerings created and delivered; the firm´s internal capabilities; the economic factors that highlight the revenue mechanisms; and the investor factors defining time, scope, and size objectives. In (Demil & Lecocq, Citation2010) the authors present three core components of the BM framework: resources and competencies, organisational structure (i.e. value chain activities and value network), and value propositions to be delivered to customers. The main aim of (Osterwalder et al., Citation2010) was to standardise the existing frameworks by presenting the so-called BM Canvas, based on previous work by (Osterwalder, Citation2004), i.e. the BM ontology. The BM Canvas is a comprehensive framework encompassing four business areas: customers, offers, infrastructure, and financial viability. These areas unfold in the following nine building blocks: customer segments, value propositions, channels, customer relationships, revenue streams, key resources, key activities, key partnerships, and cost structures. Likewise, (Wirtz et al., Citation2016) contributes to the state-of-the-art by introducing the IBM, which provides a comprehensive view of the sub-models, i.e. the components of a BM, as a result of an extensive literature analysis and identifies external and internal factors. The external factors are customers and market components, which are included in the customer model, market offer model, and revenue model. The internal factors, i.e. the manufacturing model, procurement model, and financial model, are part of the value-creation components. Lastly, the strategic components include the resource model, network model, and strategic model.
Among the frameworks mentioned above, the IBM by (Wirtz et al., Citation2016) is a generic model that provides a comprehensive picture of the BM’s essential components divided into strategy, customer and market, and value creation aspects. The IBM offers a baseline for discussing the different BM’s components in the analysed domain. In view of this, the IBM is taken as a reference in this work.
To summarise, this study builds upon IBM and presents a vertically enriched characterisation of each of the IBM components and the relations among them by analysing the literature related to the digitalisation of the manufacturing industry. The proposed framework enriches the existing descriptions of IBM’s components and contributes to displaying an explanation model that includes aspects of the process of digital transformation of manufacturing.
3. Methodology
The gap presented in the introduction is addressed in this work by referencing the IBM framework and through a semantic analysis of the literature related to digital transformation in manufacturing. The semantic analysis was performed using a bibliometric mapping approach that provides tools and methods to graphically visualise a map of the state-of-the-art of a given knowledge area (van Eck, Citation2011). VOSviewer was the software selected to perform the analysis because of its main feature of handling large maps and its ability to present the results in an easy-to-interpret way. This software implements a new bibliometric mapping technique called VOS (Visualisation Of Similarity), as proposed by (van Eck & Waltman, Citation2010). Such a technique constructs a two-dimensional map whose attributes are nodes and arcs. The nodes are the objects of interest (e.g. journals, researchers, keywords) that, in this work, are keywords. The arcs are connections (e.g. co-authorships, co-occurrences) between nodes that reflect their similarity. In this paper, the arcs are the co-occurrences. The closer the nodes are to each other, the higher their similarity, and the further apart the nodes, the lower their similarity (van Eck & Waltman, Citation2007). The methodology proposed for the literature analysis is detailed in the following paragraphs.
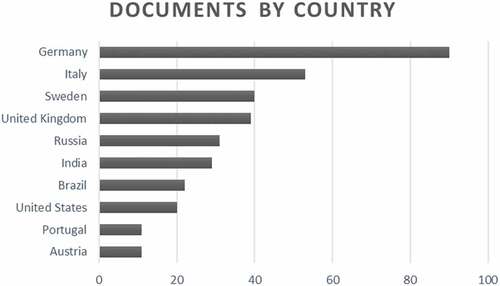
The first step consists of creating the dataset used as input in VOSviewer. The key search terms used to extract the scientific papers are combined in the following search string (digitalisation OR digitalisation OR digital transformation OR industry 4.0) AND (business model* OR business model innovation) AND (manufacturing OR production). This string was then used to search the Scopus and Web of Science (WoS) databases. These databases were chosen because they cover the most relevant available literature regarding the unit of analysis of this study. A total of 294 publications were obtained from Scopus, and 329 were obtained from WoS. This body of literature was further analysed with a focus on coherence and consistency. After 2016, the literature started to include a stable and growing number of contributions indicating a consolidation of the topic in the scientific community. For this reason, the initial dataset was reduced by eliminating the 30 contributions before 2016. Additional filters are applied to include only journal, conference, and review papers. This selection contains all types of documents, from conceptual to empirical and technical contributions, given the holistic nature of our investigation. The resulting articles from Scopus and WoS were merged, and duplicates were removed, resulting in a final dataset of 507 articles (see Appendix 4 additional statistics).
The final dataset was input in VOSviewer to create a keywords map. The objects displayed in the map were (1) nodes representing the keywords and (2) arcs representing the co-occurrence of two connected keywords. presents the terminology associated with nodes and arcs that will be used in the text.
Table 1. Terminology characterising Nodes and Arcs.
The analysis of the keyword map was structured as follows. First, the focus was on assessing the nodes to characterise the IBM´s components. Second, the arcs were investigated to identify the relations among the components and the strengths of such connections. The following paragraphs explain the details of these two steps.
3.1. Node analysis
The node analysis consisted of two stages: screening the nodes and associating the keywords to the IBM components. First, screening the 2312 nodes included in the map highlighted the need to reduce the analysis’s dimension and standardise the keywords. Those terms with an occurrence value lower than 6 were removed, and a thesaurus file was used to manage synonyms and the conversion from plural to singular. After these steps, the map included 90 keywords associated with the corresponding IBM components. Second, the association process was performed during a brainstorming session among the authors and was based on semantic association criteria that reflected the description of the components given by (Wirtz et al., Citation2016). The associated keywords gave an overview of the central topics discussed in the literature, and these major topics provided a detailed description of the IBM components. It was assumed that the more keywords associated, the higher the research activities in that area and, in turn, the higher the importance in the domain. The associated topics provided a vertical description of every single component.
3.2. Arcs analysis
The whole arc analysis was based on a core assumption: if an arc connects two keywords that are assigned to two different components, the components are linked. Given this assumption, the analysis of the arcs consisted of two steps. The first stage is identifying and representing the connections among components through specific matrixes in which the rows are the keywords of the focal component while the columns are the keywords of connected components. The second stage is characterising the co-occurrence values to establish the strengths of the links. The filled cells in the matrixes represent the arcs and contain the link strength value, which is the number of co-occurrences of the linked keywords. The co-occurrence values were further analysed to characterise the relations among the components highlighted in the matrixes. These values may show the strength of a specific relation: the lower the value, the weaker the relation, and the higher the value, the stronger the relation. An in-depth analysis of these values was carried out and is presented in the following paragraphs.
A screening of the co-occurrence values was necessary to highlight the more relevant ones. For this purpose, the co-occurrence values were plotted on a histogram to show their distribution over the top three components with the highest number of associated keywords, i.e. MM, RM, and SM. The chart in shows an uneven distribution, and values 1 and 2 account for about 80% of the total.
Figure 1. Histogram of the co-occurrence values divided by component in focus. The trend line highlights a cut-off point in correspondence with value 3.
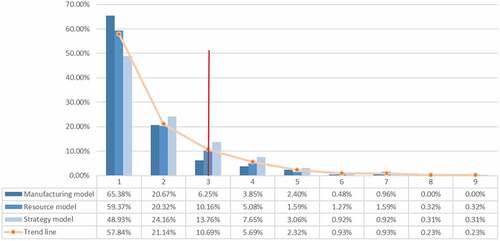
The superimposed trend line showed an elbow that allowed the definition of a cut-off point corresponding to a value of 3:
The left side of the cut-off point included lower co-occurrence values than the right side. There is a lack of pattern in the association with the keywords involved. Therefore, such values were irrelevant for the whole analysis as they did not reveal any semantic association.
The right side of the cut-off point included higher co-occurrence values than the left side. These values showed a pattern in the association of the keywords involved; thus, these links were relevant for the whole analysis because they revealed a semantic association.
For the reasons explained above, the analysis focused on higher co-occurrence values on the right side of the cut-off point (values of 4–9), including the cut-off point itself (3). As a result, the matrixes presented contain cells filled with values from 3 to 9.
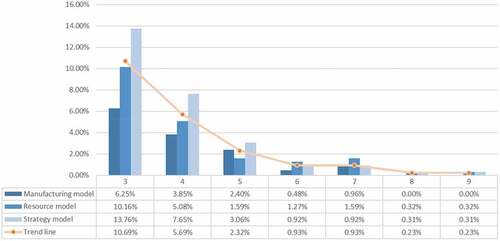
The co-occurrence values may indicate the strength of the relations among components. In particular, the histogram in shows higher co-occurrence values distributed over the MM, RM, and SM. The trend line shows a relatively sharp drop until 6, and after this point, it settles down. The critical point is thus 6, which distinguishes two nuances:
Weak co-occurrence values (3–5) corresponded to a weak relation. These were considered novel connections with potential association patterns.
Strong co-occurrence values (6–9) corresponded to a strong relationship. These were more established connections with recurring association patterns.
Figure 2. Zoom-in on the distribution of the co-occurrence values from 3 (the cut-off point).
To summarise, the nodes analysis highlighted the central topics discussed within the digitalisation in the manufacturing domain and, in turn, the most discussed IBM components in the field. Moreover, the arcs analysis identified relations among the components represented by creating matrixes. The co-occurrence values in the matrixes´ cells indicate the strength of such relations. Further investigation of the co-occurrences led to an in-depth characterisation of the connections identified with the matrixes, specifying weak and strong relations.
4. Results
4.1. Nodes analysis results
shows the keywords map used as the basis for the nodes analysis. This map was reduced to include 90 keywords with a minimum occurrence value of 6 as a result of the nodes screening phase. The reduced keywords map is displayed in . The keywords included in this map are listed in , and they were used during the association process. Furthermore, displays in grey the 56 keywords that were associated with one of the IBM´s components, while the other 34 were excluded from the analysis because they could be related to more than one component, e.g. ‘industry 4.0’, ‘circular economy’, and ‘digital economy’. These keywords expressed broad concepts that may not bring value-added information to this work.
Figure 3. Keywords map extracted from VOSviewer. The map includes 2312 nodes. The larger the nodes, the higher the occurrence value. The colour indicates the cluster to which the node belongs. The arcs indicate whether two keywords co-occur.
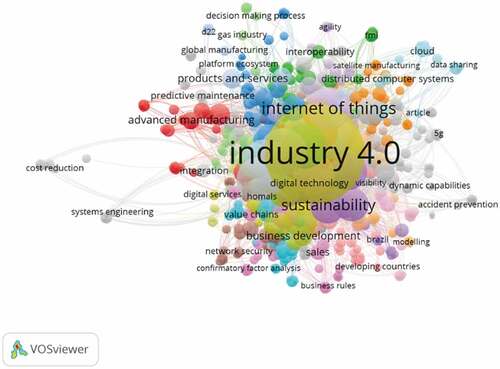
Figure 4. Reduced keywords map as a result of the screening of the nodes step. The map includes 90 nodes with a minimum occurrence value of 6.
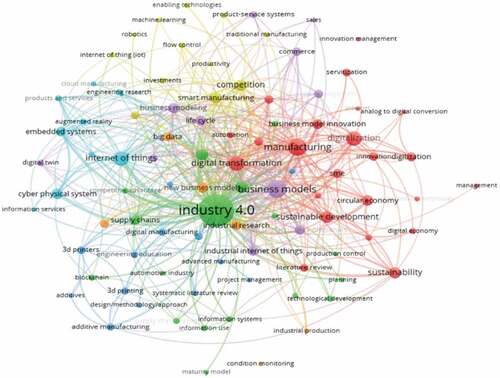
Table 2. List of the 90 keywords. The grey rows are the keywords associated with IBM´s components. The remaining rows are not considered in this analysis.
4.1.1. Characterisation of the IBM’s components
display the list of associated keywords for each IBM component. These terms provide an overview of the central topics discussed in the analysed literature, presenting a characterisation of the IBM´s components. The already existing description of the IBM components is therefore enhanced with specific characterisations in all its components.
Strategy model (SM) includes keywords such as ‘digital transformation’, ‘digitalisation’, ‘business models’, ‘business model innovation’, and ‘sustainability’. These terms suggest that digital transformation should drive a company’s strategic plan. This strategic plan contributes to designing a coherent BM that embraces digital transformation and, in turn, sustains the company´s competitive advantage. A BMI might be needed if the BM changes substantially. Additionally, sustainability considerations must be made when formulating the strategic plan.
Resource model (RM) highlights the competencies and capabilities that a company should develop or acquire for a digital transformation. In detail, terms such as ‘artificial intelligence’, ‘big data’, ‘machine learning’, ‘digital twin’, ‘IoT’, and ‘cyber-physical systems’ identify the most-used technologies in digital transformation. These technologies require adequate competencies and capabilities that a company needs to develop or acquire to implement such technologies. Furthermore, complementary skills may be necessary, for instance, ‘innovation management’ and ‘industrial management’.
Manufacturing model (MM) includes keywords such as ‘manufacturing process’, ‘planning’, ‘production control’, ‘advanced manufacturing’, ‘additive manufacturing’, ‘cloud manufacturing’, ‘digital manufacturing’, ‘smart manufacturing’, and ‘smart factory’. These keywords describe the MM as the processes and operations that contribute to transforming the inputs into outputs. Several digital technologies have enabled new ways of manufacturing and possibly new paradigms. This is visible from keywords such as ‘additive’, ‘advanced’, ‘cloud’, ‘smart’, and ‘digital manufacturing’. As the end goal of the digitalisation of manufacturing, the concept of a ‘smart factory’ aims to re-conceptualise the traditional shop floor as a fully integrated and collaborative manufacturing system making the operations flexible and adaptable. The result is a highly digitised shop floor that collects and shares data through connected devices and production systems.
Market offer model (MOM) is related to the keywords ‘life cycle’, ‘product and services’, ‘product design’, and ‘product-service systems’. The focus of this component is thus on the value proposition (products and/or services) and its whole life cycle. The value proposition should be created to make consistently successful offerings. The keyword ‘product-service systems’ (PSS) indicates an emerging way of delivering a bundle of products and services. The PSS can be realised by employing smart and connected products that use digital technologies to enable awareness and connectivity in the products that, in turn, allow one to create and deliver accompanying services. The products are thus sold as functions to the customers.
Network model (NM) includes the keywords ‘ecosystems’, ‘supply chain’, and ‘supply chain management’. This component points out a network of suppliers and partners in which the focal company is involved. Such a network aims to create and deliver goods and services to the target market in collaboration with external partners. A supply chain will be designed to coordinate all the core activities required to make the final product available for the customer. The material flow through and out of the focal company is coordinated by supply chain management to maximise the value from all activities. Digital transformation has enhanced supply chain and supply chain management processes, making them faster, more flexible, and more accurate using digital technologies. The need to include digital technologies in the company´s operations has given birth to the concept of ‘ecosystem’. In detail, the company can be part of an ecosystem of partners from several industries that contribute to creating elements of the value proposition or contribute with the necessary capabilities to deliver the offering to the market.
Revenue model (RevM) is related to the keyword ‘sales’. This component points out the company´s capability to capture the created value with coherent revenue mechanisms, i.e. how a product or service is offered to the customer. ‘sales’ represents the most widely understood revenue stream. In detail, products and/or services are sold to generate an economic income.
Procurement model (PM) is characterised by the keyword ‘information management’. Procurement is a data and information-intensive process from recognising goods and services to order management. Thus, data and information are exchanged between the company and the suppliers to procure the necessary items or resources. Digitalisation has digitised such data and information introducing new ways of organising and storing data, e.g. using cloud services, and new ways for processing and extracting information from the data, e.g. using data analytics methods to improve decision-making.
Financial model (FM) includes the keyword ‘investments’. This term highlights the need for different kinds of investments to embrace a digital transformation. For instance, the digitalisation of manufacturing operations entails investment in technologies such as the IoT and capabilities such as big data analytics.
Table 3. Characterisation of Strategy model, Resource model, and Network model. The number of keywords associated with each component is specified at the bottom of the table. BM framework adopted from (Wirtz et al., Citation2016).
Table 4. Characterisation of Customer model, Market offer model, and Revenue model. The number of keywords associated with each component is specified at the bottom of the table. BM framework adopted from (Wirtz et al., Citation2016).
Table 5. Characterisation of Manufacturing model, Procurement model, and Financial model. The number of keywords associated with each component is specified at the bottom of the table. BM framework adopted from (Wirtz et al., Citation2016).
The number of associated keywords is 19 for RM, 15 for SM, 12 for MM, 4 for MOM, 3 for NM, and 1 for RevM, PM, and FM. Therefore, the RM, SM, and MM are the three IBM components on which the research effort in the investigated domain is focused, given the high number of associated keywords.
4.2. Arcs analysis results
The arcs analysis identified connections among the IBM´s components as well as the strengths of the links. The results are summarised in the matrixes in (see supplementary material). In these matrixes, the filled cells have a two-fold purpose. On the one hand, the total number of filled cells, i.e. the arcs, identifies the connections for each pair of components. On the other hand, each filled cell represents the arc that links the corresponding keywords. The filled cells contain a co-occurrence value that marks each arc. This value indicates the strength of the connections that can be weak or strong based on the analysis of . If the total number of weak connections is higher than that of strong connections, the link among the components is weak. If the number of strong links is higher than the weak ones, the link among the components can be defined as strong. The following sub-section (§2.1) lists and explains the identified connections and their relative strengths.
4.2.1. Characterisation of the links and their strengths
4.2.1.1. MM and RM
The connection between the MM and RM reveals the competencies and capabilities needed to re-conceptualise the traditional shop floors as fully digitised, integrated, and collaborative manufacturing systems. This connection is characterised by 3 strong and 7 weak co-occurrence values ().
Figure 5. Matrix representing the connections identified between MAnufacturing Model and Resources Model. The bottom part summarises the total number of filled cells for each component pair and the number of weak and strong co-occurrence values.
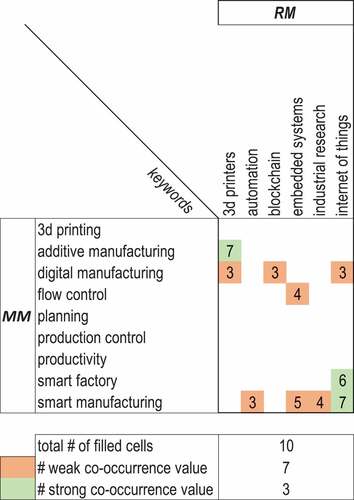
The strong values identify established associations in the literature. In detail, the terms ‘3D printers’ and ‘additive manufacturing’ suggest that skills in handling 3D printers should be developed or acquired to implement the additive manufacturing process. The keywords ‘smart factory’, ‘smart manufacturing’, and ‘IoT’ suggest that capability in handling the IoT should be developed to shift from traditional to smart manufacturing because IoT is the driving technology for the digitalisation paradigm.
The weak values identify novel connections in the literature. In detail, ‘digital manufacturing’ co-occurs with ‘3D printers’, ‘blockchain’, and ‘IoT’. Digital manufacturing exploits I4.0 technology to enable interconnectivity (e.g. IoT is the primary enabler), automation, and data analysis within production systems. In particular, 3D printers have been used in product design in the prototyping phase to shorten the process. In addition, blockchain technology tries to enhance security, traceability, integrity, and transparency within the exchanged data, guaranteeing that all systems are resilient. Therefore, competencies in 3D printers, blockchain, and IoT are necessary for implementing digital manufacturing.
Overall, the weak co-occurrence values prevail over the strong ones. This suggests that the link between MM and RM is mainly a weak connection characterised by novel association patterns.
4.2.1.2. MM and SM
The connection between the MM and SM reveals that there should be an alignment between a company’s strategic plan and its manufacturing strategy and operations. This connection is characterised by 17 weak co-occurrence values ().
Figure 6. Matrix representing the connections identified between MAnufacturing Model and Strategy Model. The bottom part summarises the total number of filled cells for each component pair and the number of weak and strong co-occurrence values.
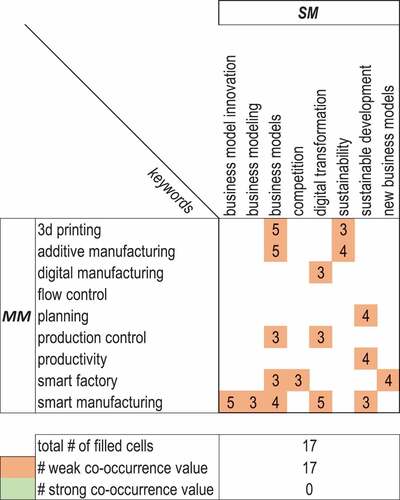
The keywords ‘additive manufacturing’ and ‘3D printing’ co-occur with ‘business models’ and ‘sustainability’. These associations highlight that additive manufacturing and 3D printing are manufacturing processes that require the design of proper BMs to sustain their competitive advantage. As for the association with ‘sustainability’, additive manufacturing and 3D printing may potentially impact the sustainability dimensions. Significant benefits can be identified in reducing new product development time, logistics, production, and inventory costs. The keyword ‘digital manufacturing’ is associated with ‘digital transformation’. The digital transformation of manufacturing has brought fundamental changes in the manufacturing industry by opening the way toward a digitalised manufacturing environment. This may be considered an expected association. The terms ‘productivity’ and ‘sustainability’ co-occur, highlighting that efficiency in productivity can directly affect sustainability. The link between ‘planning’ and ‘sustainable development’ means that production planning should consider sustainable development. The keyword ‘production control’ co-occurs with ‘business models’ and ‘digital transformation’. Digital transformation pushes digital technologies into manufacturing that would support production control. Integrating these technologies and production control systems may in turn have an impact on the BM. The following are two expected associations: ‘smart manufacturing’, ‘business models’, and ‘business model innovation’; ‘digital transformation’, ‘business models’, and ‘business models innovation’. These associations suggest that striving for smart manufacturing implies a digital transformation strategy that, in turn, has implications for the BM, leading to a possible BMI. The term ‘smart factory’ co-occurs with ‘new business models’ and ‘business models’, thus focusing on the possibility of new emerging BMs and, therefore, on the role of BMs in smart factories. The keyword ‘smart manufacturing’ co-occurs with ‘sustainable development’ highlighting that smart manufacturing may influence the company’s sustainable development.
Overall, the weak co-occurrence values are dominant in the MM-SM connection. This suggests that novel keyword associations with novel association patterns characterise the link.
4.2.1.3. MM and NM
The connection between the MM and NM shows that there should be an alignment between a company’s network of suppliers and partners and its manufacturing strategy and operations. This connection is characterised by one weak co-occurrence value ().
Figure 7. Matrix representing the connections identified between Manufacturing Model and Network Model. The bottom part summarises the total number of filled cells for each component pair and the number of weak and strong co-occurrence values.
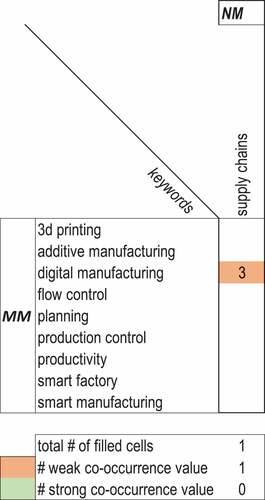
The keyword ‘digital manufacturing’ is associated with ‘supply chains’, highlighting that companies undergoing a digital transformation must rethink and redefine their supply chains to fulfil the new conditions introduced by the transformation.
Overall, the weak co-occurrence value is dominant in the MM-NM connection. This suggests that novel keyword associations with potential association patterns characterise the link.
4.2.1.4. MM and MOM
The connection between the MM and MOM reveals that there should be an alignment between the market offer, i.e. the value proposition of a company and the whole life cycle, and its manufacturing strategy and operations. This connection is characterised by one weak co-occurrence value (). The identified association is between ‘product design’ and ‘smart manufacturing’. Smart manufacturing leverages digital technologies to digitalise all business processes, and applying these technologies has great potential in product design. Integrating virtual representations and simulations in the design phase allows the exploration of several product scenarios, thus making the design process much faster and more efficient. This is paving the way for a more and more digitalised design process.
Figure 8. Matrix representing the connections identified between Manufacturing Model and Market Offer Model. The bottom part summarises the total number of filled cells for each component pair and the number of weak and strong co-occurrence values.
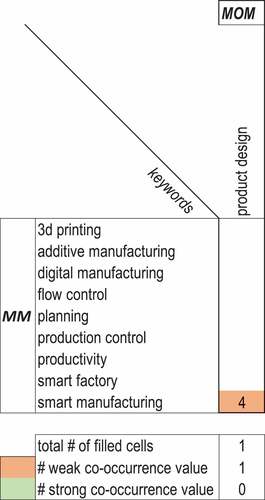
Overall, the weak co-occurrence values are dominant in the MM-MOM connection. This suggests that novel keyword associations with potential association patterns characterise the link.
4.2.1.5. SM and RM
The connection between the SM and RM reveals that there should be an alignment between the strategic plan of a company and the development or acquisition of core and complementary competencies and capabilities required by the related technologies. A strategic plan based on digital transformation should include developing or acquiring the appropriate core and complementary capabilities necessary for such a plan.
This connection is characterised by 37 weak and 8 strong co-occurrence values ().
Figure 9. Matrix representing the connections identified between Strategy Model and Resource Model. The bottom part summarises the total number of filled cells for each component pair and the number of weak and strong co-occurrence values.
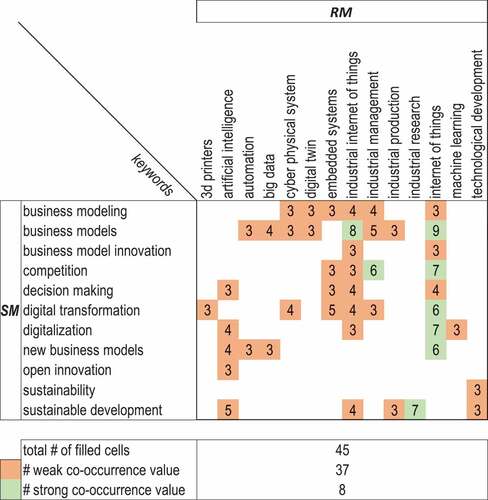
As for the strong association, the ‘IoT’ keyword co-occurs with ‘business models’, ‘digital transformation’, ‘digitalisation’, ‘new business models’, and ‘competition’. These expected associations suggest that IoT represents the key competence to be developed in the digitalisation of the manufacturing industry and represents a source of competitive advantage. Developing or acquiring external competencies in IoT, in turn, could imply changes in the current BM or even allow for designing a new BM.
The keyword ‘business model’ co-occurs with ‘industrial IoT’ (IIoT). This is an expected association suggesting that the development of IIoT may impact the BM. The keyword ‘sustainable development’ co-occurs with ‘industrial research’. This is another expected association, given the increasing emphasis on sustainable development in the manufacturing industry. Investigating the development of new products, processes, and services, i.e. industrial research, should allow for sustainable development. Thus, industrial research is a competence that companies should develop or acquire because they are required to become more environmentally conscious in their operations.
The keyword ‘competition’ co-occurs with ‘industrial management’. Industrial managers should integrate the different engineering processes in a new competitive environment created by digitalisation.
The weak co-occurrence values identify novel connections in the literature. The keywords ‘business modelling’ and ‘business models’ co-occur with capabilities in ‘automation’, ‘big data’, ‘cyber-physical systems’, ‘digital twin’, ‘IIoT’, ‘industrial management’, and ‘industrial production’. The BM should be designed to include competencies and capabilities in these technologies according to the strategic plan. The term ‘business models innovation’ co-occurs with ‘IIoT’ and ‘IoT’ suggesting that a BMI could be driven by acquiring and/or developing competencies in these two technologies. The data collected using IoT and IIoT could generate new BMs powered by those data. The keyword ‘competition’ co-occurs with ‘embedded systems’ and ‘IIoT’, and this highlights the importance of developing competence in embedded systems and IIoT to be competitive in digital transformation. The term ‘decision making’ is associated with ‘artificial intelligence’, ‘embedded systems’, ‘IIoT’, and ‘IoT’. IIoT and IoT capture data that can be analysed using artificial intelligence tools. This exploits data-driven learning, which in turn may support and enhance the strategic decision-making process.
The following associations are identified as expected associations. The keyword ‘digital transformation’ co-occurs with ‘3D printers’, ‘cyber-physical systems’, ‘embedded systems’, ‘IIoT,’ and ‘IoT’. These fundamental capabilities should be developed to undergo a digital transformation in manufacturing. The keyword ‘digitalisation’ co-occurs with ‘artificial intelligence’, ‘machine learning’ and ‘IIoT’, and this reinforces the association mentioned above, confirming that IT-driven capabilities are paramount in digital transformation. The term ‘new business models’ co-occurs with ‘artificial intelligence’, ‘automation’, and ‘big data’. New value can be captured by designing a new BM that exploits the capabilities of artificial intelligence, automation, and big data.
The term ‘sustainable development’ co-occurs with ‘artificial intelligence’, ‘IIoT’, ‘industrial production’, and ‘technological development’. Technological advancement may contribute to advancing sustainable development. In particular, developing capabilities in artificial intelligence, IIoT, and industrial production may contribute to providing solutions that promote sustainable development.
Overall, the weak co-occurrence values are dominant in the SM-RM connection. This suggests that novel keyword associations with potential association patterns characterise the link.
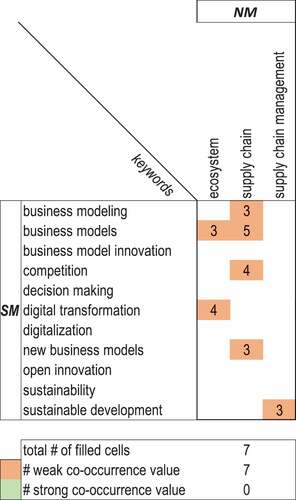
4.2.1.6. SM and NM
The connection between the SM and NM suggests that there should be an alignment between a company’s strategic plan and its network of suppliers and partners to deliver products and services to the customer successfully. This connection is characterised by 7 weak co-occurrence values.
The keywords ‘business models’, ‘business modelling’, ‘competition’, and ‘new business models’ co-occur with ‘supply chain’. This implies that the structure of the supply chain may transform the current BM to meet the new needs arising from digitalisation or to meet the market’s new requirements to maintain competitiveness. Adjustments to the structure of the supply chains can create new BMs.
The keywords ‘digital transformation’ and ‘business models’ co-occur with ‘ecosystem’. Traditional supply chains are evolving towards interconnected and integrated ecosystems from raw materials suppliers to the final customer, thanks to digital transformation. This transformation is possible given the technological advancement brought about by digitalisation itself. The BM will describe how each actor of the ecosystem creates, delivers, and captures value within the ecosystem. The keyword ‘sustainable development’ co-occurs with ‘supply chain management’. These two keywords combine sustainability issues with the management of supply chains aiming to promote sustainable development within the supply chain.
Overall, the weak co-occurrence values are dominant in the SM-NM connection. This suggests that novel keyword associations with potential association patterns characterise the link ().
Figure 10. Matrix representing the connections identified between Strategy Model and Network Model. The bottom part summarises the total number of filled cells for each component pair and the number of weak and strong co-occurrence values.
4.2.1.7. SM and MOM
The connection SM-MOM shows that there should be an alignment between the company’s strategic plan and the value proposition as well as its whole life cycle. This connection is characterised by 12 weak and one strong co-occurrence value ().
Figure 11. Matrix representing the connections identified between Strategy Model and Market Offer Model. The bottom part summarises the total number of filled cells for each component pair and the number of weak and strong co-occurrence values.
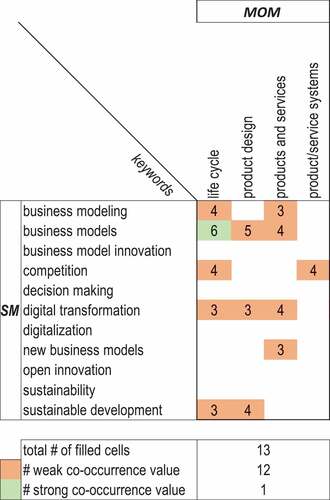
As for strong association, the keywords ‘business models’ and ‘life cycle’ co-occur. The company’s strategic plan may affect products’ life cycles that must be combined with a proper BM along the whole life cycle.
The weak values identify novel connections in the literature. The keywords ‘business modelling’, ‘competition’, ‘digital transformation’, and ‘sustainable development’ co-occur with ‘life cycle’.
Digitalisation can promote sustainable development because it may offer the opportunity to extend the life cycle of products and thus sustain competitive advantage. The keyword ‘business models’ co-occurs with ‘product design’ and ‘products and services’. These are expected associations because the BM needs to be designed accordingly based on the products and/or services delivered to the customer. The keyword ‘competition’ co-occurs with ‘life cycle’ and ‘product-service system’. This highlights the role of competition in both the life cycle and PSS. A PSS may change the market competition toward more complex dynamics, e.g. to compete in the service market. The keyword ‘digital transformation’ co-occurs with ‘products and services’. The digital transformation may push towards value propositions that combine products and services thanks to the introduced digital technologies.
The keyword ‘digital transformation’ is also associated with ‘life cycle’ and ‘product design’. Digital technologies can bring several advantages along the product life cycle and can be exploited to extend the product’s life by creating new digital services. This is an expected association because digital technologies affect the process of product design, e.g. by reducing product development lead times and increasing product customisation. The keyword ‘business models’ co-occurs with ‘products and services’. This is another expected association because having a value proposition focused on both products and services may lead to an adjustment to the current BM. The keyword ‘sustainable development’ co-occurs with ‘life cycle’ and ‘product design’. Products may be designed more sustainably thus decreasing the impact on human and environmental dimensions during all the products’ life cycles.
Overall, weak co-occurrence values are dominant in the SM-MOM connection. This suggests that novel keyword associations with potential association patterns characterise the link.
4.2.1.8. SM and PM
The connection between the SM and PM shows that there should be an alignment between a company’s strategic plan and how the information in procurement is managed. This connection is characterised by 3 weak co-occurrence values ().
Figure 12. Matrix representing the connections identified between Strategy Model and Procurement Model. The bottom part summarises the total number of filled cells for each component pair and the number of weak and strong co-occurrence values.
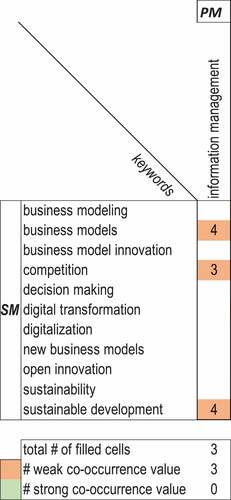
The keyword ‘business model’ co-occurs with ‘information management’. Managing information when implementing digitalisation is paramount, from acquiring information to its storage and distribution. The BM needs to be designed to consider eventual partnerships that allow the acquisition of the competencies required to deal with data. The keyword ‘competition’ co-occurs with ‘information management’. The ownership of information is a source of competitive advantage because having control of such information and being able to analyse it may allow the capture of more value. The keyword ‘sustainable development’ co-occurs with ‘information management’. Information management may have great potential in sustainable development because it allows, for instance, decisions to be made based on data that may ultimately support sustainable development. Data may thus be used to enable and finally achieve sustainable development.
Overall, the weak co-occurrence values are dominant in the SM-PM connection. This suggests that novel keyword associations with potential association patterns characterise the link.
4.2.1.9. SM and FM
The connection between the SM and FM shows that there should be an alignment between the strategic plan of a company and the need for different kinds of investments to embrace digital transformation. This connection is characterised by 1 weak co-occurrence value (). The keyword ‘competition’ co-occurs with ‘investment’. The digitalisation trend requires high investment, and companies are thus increasing their investments in digital technologies. However, digitalisation has also increased the complexity of the market competition mechanisms and the threats from new market entrants. This, in turn, has increased the risk of the investment made in digital technologies bringing uncertainties in return on investment.
Figure 13. Matrix representing the connections identified between Strategy Model and Financial Model. The bottom part summarises the total number of filled cells for each component pair and the number of weak and strong co-occurrence values.
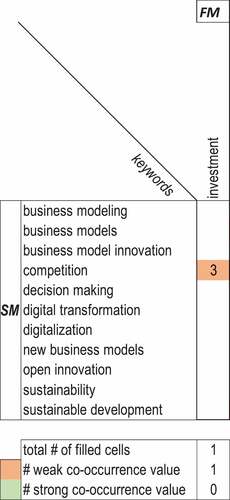
Overall, weak co-occurrence values are dominant in the SM-FM connection. This suggests that novel keyword associations with potential association patterns characterise the link.
4.2.1.10. SM and RevM
The connection between the SM and RevM shows that there should be an alignment between the strategic plan of a company and the company´s capability to capture the created value with coherent revenue mechanisms. This connection is characterised by 2 weak co-occurrence values ().
Figure 14. Matrix representing the connections identified between Strategy Model and Revenue Model. The bottom part summarises the total number of filled cells for each component pair and the number of weak and strong co-occurrence values.
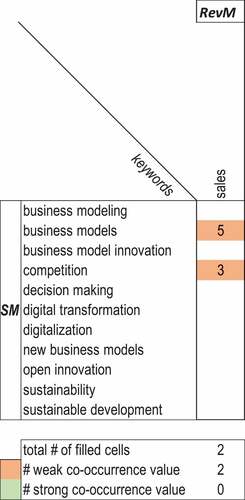
The keyword ‘business models’ co-occurs with ‘sales’. This suggests that changes in sales may be experienced through new types of BM enabled by digitalisation. Therefore, the sales mechanism is a strategic factor that will shape the digital strategy.
The keyword ‘competition’ co-occurs with ‘sales’. Digitalisation may increase the complexity of competition in the markets, which may affect sales.
Overall, weak co-occurrence values are dominant in the SM-RevM connection. This suggests that novel keyword associations with potential association patterns characterise the link.
4.2.1.11. RM and MOM
The connection between the RM and MOM shows that there should be an alignment between the development of competencies and capabilities for digitalisation and the value proposition and its whole life cycle. This connection is characterised by 7 weak co-occurrence values ().
Figure 15. Matrix representing the connections identified between Resource Model and Market Offer Model. The bottom part summarises the total number of filled cells for each sub-model pair and the number of weak and strong co-occurrence values.
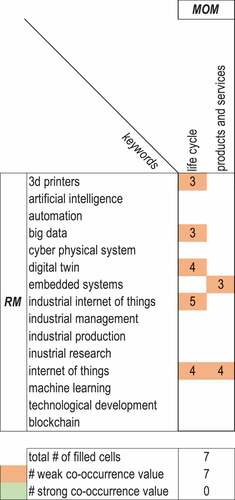
The keywords ‘3D printers’, ‘big data’, ‘digital twin’, ‘embedded system’, ‘IIoT’, and ‘IoT’ co-occur with ‘life cycle’. This suggests that such digital technologies are part of the whole life of a product or service, and developing or acquiring competencies and capabilities to master such technologies is paramount. 3D printers are used in the early phases of product development to create prototypes. This allows designers to quickly determine the product that best fulfils the customers’ requirements, thus helping to reduce lead times. The acquisition of big data from products has opened the way to data-driven product development. Data captured from the usage of the product during its whole life cycle makes it possible to analyse user behaviour and thus make decisions on the design of future products/services. Digital twins can be used in different product life cycle stages, from the engineering phase to the simulation on the shop floor. In addition, the product’s digital twin can be used by the customer. IoT technology allows monitoring the product’s life cycle and enables the collection of a vast amount of data during the usage of the products. These data are thus analysed to create new value and understand the customer’s behaviour. Industrial IoT is more specific for shop floor implementation to monitor and control the production line and increase the visibility of overall production resources. The analysis of the data collected will lead to operations optimisation. The acquisition of such big data from the shop floor steers monitoring and control and prompts actions and decision-making processes on the shop floor towards being data-driven. The keywords ‘embedded system’ and ‘IoT’ co-occur with ‘product and services’, and this link suggests that competencies and capabilities in embedded systems and IoT technology are necessary to integrate products and services and to deliver new product and service offerings.
Overall, the weak co-occurrence values are dominant in the RM-MOM connection. This suggests that novel keyword associations with potential association patterns characterise the link.
4.2.1.12. RM and NM
The connection RM-NM shows that the development of competencies and capabilities for digitalisation should be aligned with a company’s network of suppliers and partners. One strong and three weak co-occurrence values characterise this connection ().
Figure 16. Matrix representing the connections identified between Revenue Model and Network Model. The bottom part summarises the total number of filled cells for each sub-model pair and the number of weak and strong co-occurrence values.
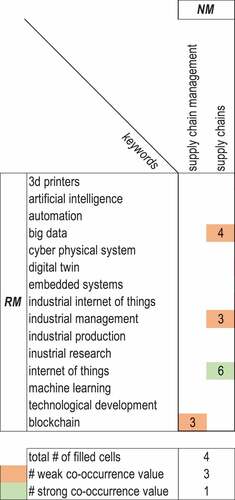
The strong value identifies an established association in the literature. The keyword ‘IoT’ co-occurs with ‘supply chains’, and this association suggests that developing competencies in such technology may introduce changes in the supply chain.
The weak values identify novel connections in the literature. The keywords ‘big data’ and ‘industrial management’ co-occur with ‘supply chains’. Acquiring capabilities to exploit big data generated along the supply chain will facilitate and improve the monitoring and decision-making process for all supply chain activities. ‘industrial management’ and ‘supply chain’ is an expected connection. Industrial managers plan how to efficiently use labour, material, machines, and information, and logistics and supply chains are thus aspects to consider in planning a firm’s resources. The keyword ‘blockchain’ co-occurs with ‘supply chain management’. This link suggests that developing capabilities for implementing blockchain technology may affect the whole supply chain management.
Overall, the weak co-occurrence values are dominant in the RM-NM connection. This suggests that novel keyword associations with potential association patterns characterise the link.
4.2.1.13. RM and PM
The connection between the RM and PM shows that there should be an alignment between developing competencies and capabilities for digitalisation and managing the information in procurement. This connection is characterised by one weak co-occurrence value ().
Figure 17. Matrix representing the connections identified between Revenue Model and Procurement Model. The bottom part summarises the total number of filled cells for each sub-model pair and the number of weak and strong co-occurrence values.
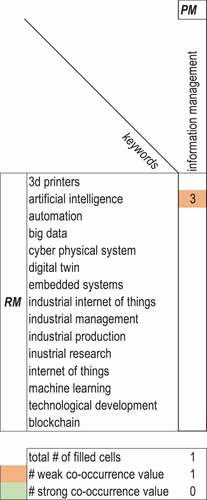
The keywords ‘artificial intelligence’ and ‘information management’ co-occur, suggesting that artificial intelligence competencies can be developed or acquired to be used in information management. Artificial intelligence tools may support companies in recognising patterns in vast amounts of data, and algorithms for clustering and contextualisation may fulfil this purpose.
Overall, the weak co-occurrence values are dominant in the RM-PM connection. This suggests that novel keyword associations with potential association patterns characterise the link.
4.2.1.14. RM and FM
The connection between the RM and FM shows that there should be an alignment between developing competencies and capabilities for digitalisation and the need for different kinds of investments to embrace digital transformation. This connection is characterised by 1 weak co-occurrence value (). The keyword ‘embedded systems’ co-occurs with ‘investments’. This link suggests that the manufacturing industry’s digital transformation needs investment in embedded systems. In particular, the advent of cyber-physical systems on the shop floors is the basis for I4.0 requirements that machines to be equipped with sensors, microprocessors, or even complete embedded systems.
Figure 18. Matrix representing the connections identified between Revenue Model and Financial Model. The bottom part summarises the total number of filled cells for each sub-model pair and the number of weak and strong co-occurrence values.
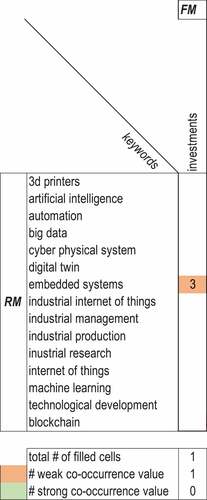
Overall, the weak co-occurrence value is dominant in the RM-FM connection. This suggests that novel keyword associations with potential association patterns characterise the link.
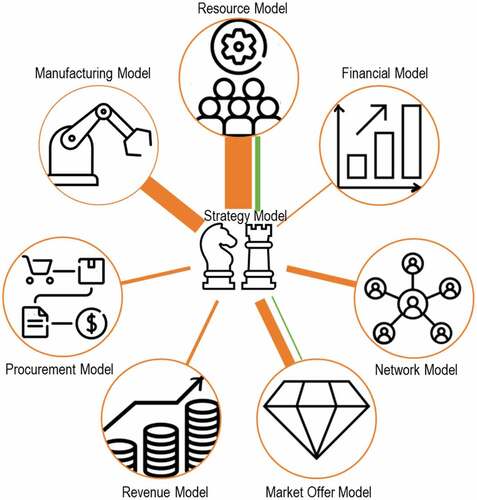
The star diagrams () provide a graphical representation of the connections among the sub-models identified in the matrixes. The star diagrams summarise the identified links for each RM, SM and MM, which are displayed as the centre points. The lines’ thickness represents the link’s strength: the ticker the line, the stronger the connection and vice versa.
Figure 19. Star diagram identifying the connections for MM. The lines show the link among the components. The thickness of the lines represents the number of weak and strong co-occurrence values. The lines are orange for the weak values and green for the strong ones. The circles are coloured according to the predominant values, i.e. weak links.
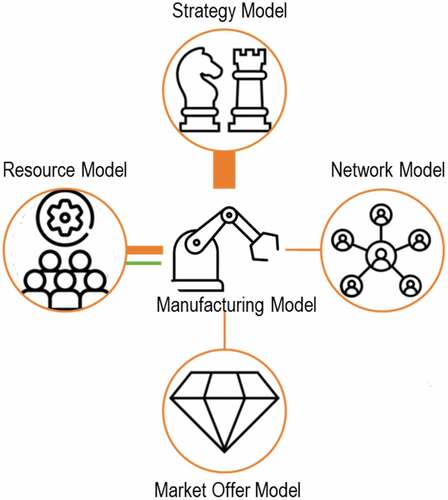
Figure 20. Star diagram identifying the connections for RM. The lines show the link among the components. The thickness of the lines represents the number of weak and strong co-occurrence values. The lines are orange for the weak values and green for the strong ones. The circles are coloured according to the predominant values, i.e. weak links.
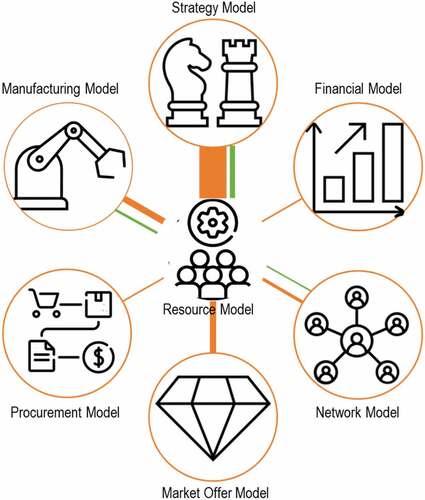
Figure 21. Star diagram identifying the connections for SM. The lines show the link among the components. The thickness of the lines represents the number of weak and strong co-occurrence values. The lines are orange for the weak values and green for the strong ones. The circles are coloured according to the predominant values, i.e. weak links.
5. Discussion
This paper presents an in-depth analysis of the major research topics discussed in the manufacturing digital transformation domain resulting in an enriched description of the IBM components and their relations. A semantic analysis performed on the relevant literature provides two main contributions that address the identified gaps. First, the nodes analysis provides the topics that enhance the existing description of the IBM´s components and their importance in the domain. Second, the arcs analysis identifies connections among the IBM´s sub-models and their strengths. The dataset used for the research was composed of 507 articles extracted from Scopus and WoS. The whole investigation was thus based on publications found in different databases allowing for a broader spectrum of data to catch all high-quality studies emerging in the field. The bibliometric mapping was performed using VOSviewer, chosen for its main feature of handling large bibliometric maps and its ability to present those maps in an easy-to-interpret way.
5.1. Results
The component characterisation highlights that the MM, RM, and SM are the most discussed and thus crucial in the domain, i.e. a high number of keywords was associated with them. This shows that the extant literature on the digital transformation of manufacturing has extensively investigated manufacturing, resources and strategy aspects. It can be assumed that these components may play a crucial role within the domain because they have attracted most of the research effort in the field. Finally, it may be concluded that technological competencies and capabilities, manufacturing processes and operations, and the strategic path are the dominant and paramount IBM elements that researchers have focused on. The other components, i.e. CM, RevM, PM, and FM, seem poorly investigated because few or no keywords were associated with them. The research activities seem thus not uniform and not established yet. This indicates that customer, revenue, procurement and finance aspects are understudied thus far, identifying potential gaps in the research agenda of the analysed domain.
The identified connections are marked with two numbers, i.e. the weak and strong co-occurrence values. These values give a quantitative measure to determine the strength of such relations. As for the weak connections, they are characterised by a high number of weak co-occurrence values. This means that the weak links are described with novel keyword associations with future potential association patterns: research activities are now emerging in the related areas, but mainstream association patterns have not yet been clearly identified. Herby, the research effort is not uniform regarding these areas thus far, highlighting possible future gaps that require further research to be addressed. As for the strong connections, they are characterised by high numbers of strong co-occurrence values. This means that the links are described with more established keyword associations showing recurring association patterns. Researchers have recurrently focused research resources in these areas. Hereby, the research activities seem to be somewhat intense and rather established. In this study, it was observed that a high number of weak co-occurrence values was dominant. Therefore, the identified connections can be considered weak links, i.e. worthwhile future research fields.
Identifying and characterising the connections among the IBM’s components is paramount because the different aspects of a BM are understood to be interconnected and dependent in the literature. Identifying the links is thus essential because any change or transformation occurring within a component will impact the others connected to it. Having a complete map of such relations will allow the detection of any consequence of a change in one element on the overall BM structure and, in turn, maintain the alignment and coherence within the whole BM. This study thus presents the first map of links among the IBM’s components found in the literature on the manufacturing industry’s digital transformation.
5.2. Limitations of the study
The decision to use a bibliometric map was in the value that such a map could bring to the study. The bibliometric map was exploited to identify the main keywords discussed in the digitalisation of the manufacturing domain. This consequently presents an overview of the topics that the literature discusses in the field. Furthermore, the map highlights the connections and strengths among the keywords and provides a clear overview of the essential themes addressed in the digitalisation of the manufacturing field and their relationships. However, the map is a simplified representation of the datasets, which may imply information loss. For instance, specific contextual information is hard to detect by analysing only the keywords map. The imposed threshold on the number of occurrences may have hindered a comprehensive analysis of the literature and missed potentially relevant keywords. The data analysed might also have contained noise, e.g. keywords that were out of context and not suitable for the analysis and generic keywords that did not allow a clear association to one of the IBM’s components. This should be considered in the interpretation of the map.
In conclusion, characterising the IBM components and identifying the links among them create an enriched BM framework with the aspects of the digital manufacturing transformation. On the one hand, such framework provides horizontal and vertical coverage in the description of the components, and the links add more value to the framework creating the first map of connections. The resulting framework is proposed as a descriptive tool in the focal domain supporting the investigation of the long-term impact of digitalisation in a challenge-driven research context. On the other hand, the proposed enriched framework arises from state-of-the-art research. Consequently, the enriched framework lacks empirical evidence
6. Conclusion and future work
This paper contributes to the extant literature by presenting an enriched IBM framework that provides a detailed vertical description of its components, the connection among them, and the relative strength of such relations.
As its main theoretical contribution, this study sheds light on the research practice identified in the digital transformation of the manufacturing area. Furthermore, this provides insights into the current research activities that have been carried out in this area, pointing out the possible future focus of such research activities. On the one hand, the results show that MM, RM and SM are the most discussed and, thus, essential components in the investigated domain. The current research effort is thus focused on these areas. On the other hand, CM, RevM, PM, and FM seem to be poorly investigated areas, highlighting the need for further research attention.
As its main practical contributions, the results of this study present the most important IBM components (i.e. MM, RM and SM) that must be taken into account when efforts to innovate the BM are made to digitalise the production environment. A general and expected implication is that the manufacturing industry’s digital transformation strongly influences these components. Thus, companies undergoing such a transformation must consider how the BM aspects are affected. Furthermore, the semantic analysis makes it possible to identify the connections among IBM components and to create a map of such links. This map may potentially track significant changes caused by a disruption of one IBM component. However, further research and empirical evidence are required to investigate whether the map may also help practitioners trace the effect of disruption of one BM component on the others connected to it. In this case, the map may maintain alignment and coherence within the whole IBM according to the changes.
Finally, this study has made a step towards characterising the nature of the connections among the BM components by specifying their strengths. However, the suggested links result from the analysis of the extant literature and are labelled based on the co-occurrence values of keywords. Further investigation on empirical cases will be needed to create a complete map of links that would reflect the industrial reality and characterise the BM components better. In addition, analysis of a multi-case study may improve the presented results and contribute to validating them.
Disclosure statement
No potential conflict of interest was reported by the authors.
References
- Agostini, L., & Nosella, A. (2021). Industry 4.0 and business models: A bibliometric literature review. Business Process Management Journal, 27(5), 1633–40. https://doi.org/10.1108/BPMJ-03-2021-0133
- Björkdahl, J. (2020). Strategies for digitalization in manufacturing firms. California Management Review, 64(4), 17–36. https://doi.org/10.1177/0008125620920349
- Chesbrough, H. (2002). The role of the business model in capturing value from innovation: Evidence from Xerox Corporation’s technology spin-off companies. Industrial and Corporate Change, 11(3), 529–555. https://doi.org/10.1093/icc/11.3.529
- Demil, B., & Lecocq, X. (2010). Business model evolution: In search of dynamic consistency. Long range planning, 43(2–3), 227–246. https://doi.org/10.1016/j.lrp.2010.02.004
- Foss, N. J., & Saebi, T. (2017). Fifteen years of research on business model innovation: How far have we come, and where should we go? Journal of Management, 43(1), 200–227. https://doi.org/10.1177/0149206316675927
- Frank, A. G., Mendes, G. H. S., Ayala, N. F., & Ghezzi, A. (2019). Servitization and Industry 4.0 convergence in the digital transformation of product firms: A business model innovation perspective. Technological Forecasting and Social Change, 141, 341–351. https://doi.org/10.1016/j.techfore.2019.01.014
- Hamel, G. (2001). Leading the revolution. Strategy & Leadership, 29(1), 4–10. https://doi.org/10.1108/10878570110367141
- Khan, A., & Turowski, K. (2016). A survey of current challenges in manufacturing industry and preparation for industry 4.0 ( A., A., T. V., K. S., & S., V., Eds.; Vol. 450, p. 26). Springer Verlag. https://doi.org/10.1007/978-3-319-33609-1_2
- Kraus, S., Palmer, C., Kailer, N., Kallinger, F. L., & Spitzer, J. (2018). Digital entrepreneurship: A research agenda on new business models for the twenty-first century. International Journal of Entrepreneurial Behavior & Research. https://doi.org/10.1108/IJEBR-06-2018-0425
- Lasi, H., Fettke, P., Kemper, H. -G., Feld, T., & Hoffmann, M. (2014). Industry 4.0. Business & Information Systems Engineering, 6(4), 239–242. https://doi.org/10.1007/s12599-014-0334-4
- Maffei, A., Grahn, S., & Nuur, C. (2019). Characterization of the impact of digitalization on the adoption of sustainable business models in manufacturing. Procedia CIRP, 81, 765–770. https://doi.org/10.1016/j.procir.2019.03.191
- McKinsey, D. (2015). Industry 4.0 how to navigate digitization of the manufacturing sector.
- Micheler, S., Goh, Y. M., & Lohse, N. (2019). Innovation landscape and challenges of smart technologies and systems – A European perspective. Production & Manufacturing Research, 7(1), 503–528. https://doi.org/10.1080/21693277.2019.1687363
- Morris, M., Schindehutte, M., & Allen, J. (2005). The entrepreneur’s business model: Toward a unified perspective. Journal of Business Research, 58(6), 726–735. https://doi.org/10.1016/j.jbusres.2003.11.001
- Mueller, J. M., Buliga, O., & Voigt, K. -I. (2018). Fortune favors the prepared: How SMEs approach business model innovations in Industry 4.0. In Technological forecasting and social change (Vol. 132, pp. 2–17). Elsevier Science Inc. https://doi.org/10.1016/j.techfore.2017.12.019
- Mugge, P., Kwiatkowski, A., Michaelis, T. L., Abbu, H., Abbu, H., Michaelis, T. L., Kwiatkowski, A., & Mugge, P. (2020). Patterns of digitization a practical guide to digital transformation patterns of digitization. Research-Technology Management, 63(2), 27–34. https://doi.org/10.1080/08956308.2020.1707003
- Müller, J. M. (2019). Business model innovation in small- and medium-sized enterprises: Strategies for industry 4.0 providers and users. Journal of Manufacturing Technology Management, 30(8), 1127–1142. https://doi.org/10.1108/JMTM-01-2018-0008
- Osterwalder, A. (2004). The business model ontology a proposition in a design science approach [PhD Thesis]. In Marketing Science (Vol. 23, Issue 3).
- Osterwalder, A., Pigneur, Y., Smith, A., & Movement, T. (2010). Business model generation: A handbook for visionaries, game changer and challengers. Wiley.
- Paschou, T., Adrodegari, F., Perona, M., & Saccani, N. (2017, November). The digital servitization of manufacturing: A literature review and research agenda introduction.
- Pereira, A. C., & Romero, F. (2017). A review of the meanings and the implications of the Industry 4.0 concept. Procedia Manufacturing, 13, 1206–1214. https://doi.org/10.1016/j.promfg.2017.09.032
- Sony, M. (2020). Pros and cons of implementing Industry 4.0 for the organizations: A review and synthesis of evidence. Production & Manufacturing Research, 8(1), 244–272. https://doi.org/10.1080/21693277.2020.1781705
- Teece, D. J. (2010). Business models, business strategy and innovation. Long Range Planning, 43(2–3), 172–194. https://doi.org/10.1016/j.lrp.2009.07.003
- van Eck, N. J. (2011). Methodological advances in bibliometric mapping of science. Erasmus Research Institute of Management (ERIM), Erasmus University Rotterdam.
- van Eck, N. J., & Waltman, L. (2007). VOS: A new method for visualizing similarities between objects. In R. Decker & H.-J. Lenz (Eds.), Advances in data analysis (pp. 299–306). Springer. https://doi.org/10.1007/978-3-540-70981-7_34
- van Eck, N. J., & Waltman, L. (2010). Software survey: VOSviewer, a computer program for bibliometric mapping. Scientometrics, 84(2), 523–538. https://doi.org/10.1007/s11192-009-0146-3
- Wirtz, B. W., Pistoia, A., Ullrich, S., & Vincent, G. (2016). Business models: Origin, development and future research perspectives. Long Range Planning, 49(1), 36–54. https://doi.org/10.1016/j.lrp.2015.04.001
- Zangiacomi, A., Pessot, E., Fornasiero, R., Bertetti, M., & Sacco, M. (2020). Moving towards digitalization: A multiple case study in manufacturing. In Production Planning & Control (Vol. 31, Issues 23, SI, pp. , Issues 23, SI, pp. 143–157). Taylor & Francis Ltd. https://doi.org/10.1080/09537287.2019.1631468
Appendix A
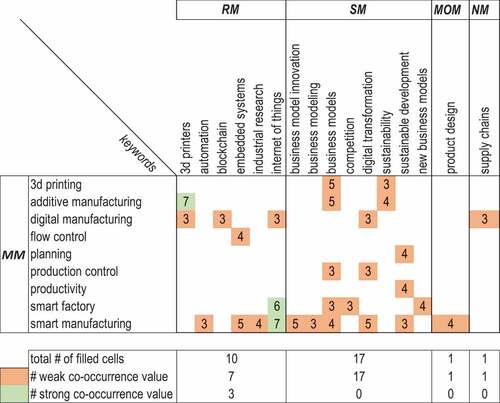
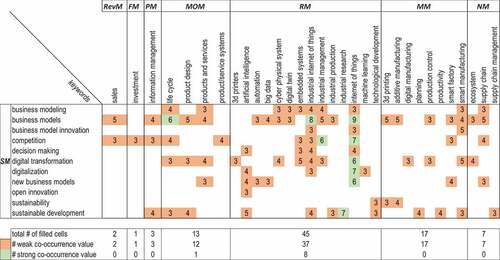
Figure A1. Matrix representing the connections identified between Manufacturing Model and Resources Model, Strategy Model, Market Offer Model and Network Model. The bottom part summarises the total number of filled cells for each sub-model pairs, the number of weak and strong co-occurrence value.
Appendix B
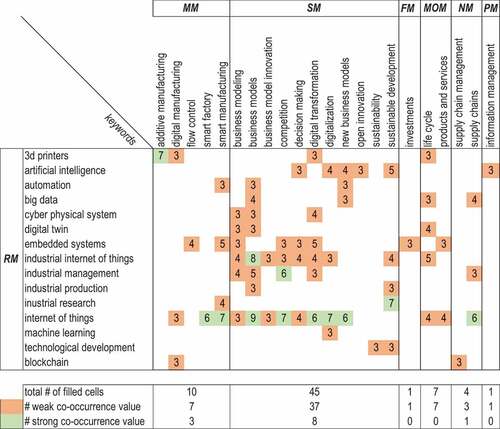
Figure B1. Matrix representing the connections identified between Resources Model and Manufacturing Model, Strategy Model, Financial Model, Market Offer Model, Network Model and Procurement Model. The bottom part summarises the total number of filled cells for each sub-model pairs, the number of weak and strong co-occurrence value.
Appendix C
Figure C1. Matrix representing the connections identified between Strategy Model and Resources Model, Manufacturing Model, Financial Model, Market Offer Model, Revenue Model, Network Model and Procurement Model. The bottom part summarises the total number of filled cells for each sub-model pairs, the number of weak and strong co-occurrence value.
Appendix D
The following charts show additional statistics regarding the dataset used in this work. shows the trend of the publications until the date of export (mid of July 2021). The literature started to include a stable and growing number of contributions indicating a consolidation of the topic in the scientific community. shows the distribution of the papers by type, i.e., conference papers and journal articles. Finally, shows the distribution of the papers by country.
Figure D1. Distribution of documents by year. The extraction was made July the 17th 2021.
Figure D2. Distribution of documents by type.
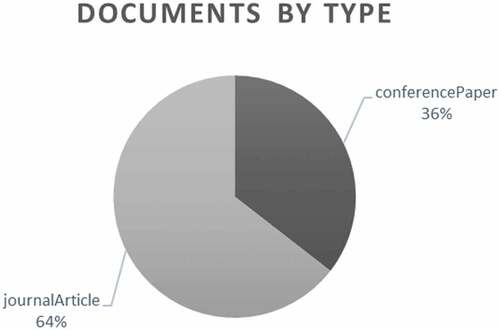
Figure D3. Distribution of documents by country. The chart include the first 10 countiries.