
 ?Mathematical formulae have been encoded as MathML and are displayed in this HTML version using MathJax in order to improve their display. Uncheck the box to turn MathJax off. This feature requires Javascript. Click on a formula to zoom.
ABSTRACT
The management of waste from electrical and electronic equipments (WEEEs) is a well-established topic in the extant literature. However, also the automotive sector is becoming a relevant source of WEEE, given the even more relevant presence of electronic components in cars. Due to new European environmental policies, end-of-life vehicles (ELVs) volumes are expected to grow in the next future, together with obsolete car electronics components. Hence, this work wants to assess the potential economic impact derived from car electronics recycling processes adopting the Net Present Value (NPV) as reference indicator. Through a detailed sensitivity and break-even point (BEP) analysis and a comparison of different cases, this work identifies a set of scenarios useful for industrial actors willing to enter the market of car electronics recycling. Results show an NPV varying from 136,570 to 607,621 €/t with a decisive role played by gold recovery.
1. Introduction
Car electronics is among the most valuable sources of Critical Raw Materials (CRMs) in cars (Andersson et al., Citation2019; Restrepo et al., Citation2017). A modern medium-sized car embeds up to 15 electronic components on average (reaching up to 50 units in luxury cars) (Wang & Chen, Citation2011). A statistic of the BMW Corporation showed that these systems can account for more than 30% of the total vehicle cost (and more than 50% in luxury cars) (Wang & Chen, Citation2011). From 2000 onwards, electronics had an increased penetration in the automotive sector. A report quantified the automotive microcontrollers market in about 989.2 million $ in 2017, with a projection to 1886.4 million $ by 2022, at a compound annual growth rate (CAGR) of 13.8% (CitationMarkets and Markets). That said, remarkable is the low interest of car manufacturers (and the whole automotive sector) towards the recovery of these valuable components from End-of-Life Vehicles (ELVs) (Sassanelli et al., Citation2021).
Arguably, the complex set of barriers (e.g. regulatory, governance-based, market, technological, cultural, societal, gender, etc.) resulted in difficulties for enterprises to implement Circular Economy (CE), by limiting potential benefits (Dallasega et al., Citation2018; D’adamo, Mazzanti, et al., Citation2022; Molla et al., Citation2022). Circular manufacturing system can provide competitive advantages based on resource sharing but also respecting environmental balances (Miklautsch & Woschank, Citation2022; Vacchi et al., Citation2021). Even if car manufacturers are investing big capitals trying to shift their business towards more sustainable mobility concepts, all these data show as the sectorial transition towards CE is still far from its completion. Electric vehicles should provide sustainable advantages over Internal Combustion Engine (ICE) cars; however, lack of charging infrastructure and economic reasons limit their development (Rajesh et al., Citation2022). In addition, sustainable mobility requires three conditions to be met: use of renewables, battery recycling, and local industrial chain (D’adamo, Gastaldi, et al., Citation2022).
Policy directions to encourage proper management of ELVs are End of waste and extended producer responsibility (D’adamo, Mazzanti, et al., Citation2022). Especially in the End-of-Life (EoL) phase, there are still many issues to be solved to functionally recover materials from cars (e.g. reuse recovered materials for similar purposes as the original one) and the dependence from natural resources when producing new cars (even if electric/hybrid/fuel cell-powered) is still too high (D’adamo & Rosa, Citation2019). This mandatory systemic transformation requires to redefine cars’ lifecycles, by considering CE already at the designing stage. Considering together the wide number of barriers impacting on the automotive sector and the limited collaboration among actors involved in traditional automotive value chains, the transition towards CE cannot be reached so easily (Banaeian et al., Citation2015; Feng et al., Citation2022).
This issue is related (especially) to two elements. On the one hand, the Beginning-of-Life (BoL) and EoL stages are still unconnected from an information sharing perspective. Data about materials embedded in cars are spread on a plethora of strictly protected databases accessible only by authorized actors. In this way, even if data on materials embedded in cars are known since many years, no one can exploit them (e.g. to optimize ELV management processes). On the other hand, even if ELV management processes are active in Europe since the sixties, none of the actors involved in these processes is available to share their knowledge with car makers or car part suppliers, given their unavailability to collaborate. So, both car makers and car part suppliers cannot improve their design practices to make cars easier to disassemble and recycle.
Waste printed circuit boards (WPCBs) are defined as a complex component of WEEEs (Siwal et al., Citation2023) and the presence of toxic and precious metals, makes this process useful in combating environmental degradation, but also in seizing economic opportunities (Trivedi et al., Citation2022). The consistent presence of precious metals shows the benefits in terms of CE (Wu et al., Citation2022). Furthermore, highlighting the relevance among the cost of printed circuit boards (PCBs) within the automotive industry (Bodendorf et al., Citation2022) shows that suitable EoL choices are also evident for WPCBs in this industry (Sun et al., Citation2022). Hence, the intent of this work is presenting an economic analysis of an automotive WPCB recycling process in order to support the actors involved in ELV management processes during the transition towards CE practices. The work is structured as follows. Section 2 presents the materials and methods adopted in this analysis. Section 3 describes the results of the analysis, and it discusses about them. Section 4 concludes the work with some remarkable elements and future trends.
2. Materials and methods
The methodology section consists of the presentation of the case study, in which the waste to be treated is examined, and the recycling process cycle is highlighted in order to derive the metals it contains. Finally, the economic model and related input data are presented.
2.1. The description of the case study
The electronic boards in cars are an excellent source of revenue and can contribute up to 50% of the total value of cars (Wang & Chen, Citation2013). However, there are no specific data in the literature on this typology of waste (D’adamo & Rosa, Citation2019). To remedy this, data is used from the International Material Data System (IMDS), a database designed by several automotive manufacturers, such as Audi, BMW, Daimler, Ford, Opel, Porsche, Volkswagen, and Volvo, and later adopted by other manufacturers who have made it a global standard for all automotive original equipment manufacturers. Currently, there are data regarding more than 500 different electronic devices in automobiles. In the specific case, they have been classified into four types based on their weight (Cucchiella, D’adamo, Rosa, et al., Citation2016):
Small WPCBs, weight ranging from 0.2 g to 8.7 g;
Medium-small WPCBs, weight ranging from 8.8 g to 52.9 g;
Medium-big WPCBs, weight ranging from 53.0 g to 134.2 g;
Big WPCBs, weight ranging from 134.2 g to 477.9 g.
This division depends on the fact that electronic boards in automobiles are very diverse in terms of shape, size, and composition among themselves, as they perform a variety of functions for the automobile. Below is the table with the specific percentage values of the components in the electronic boards. ‘Delta materials’ therefore represents the amount of materials not considered by the IMDS database, whereas ‘other materials’ means all materials mentioned in the database but not relevant to the following analysis ().
Table 1. Composition of WPCBs. Adapted by IMDS.
For reference prices, a time interval of 1 year (August 2021-July 2022) is considered. The present data were collected from three different databases for metal prices, e.g. Heraeus, KME, and Investing ().
Table 2. Metal prices. Adapted by Heraeus, KME, and Investing.
2.2. The description of the recycling process
The recycling process consists of four basic steps: i) collection and pre-sorting; ii) pre-treatment; iii) pre-processing, and iv) the end of the process. In our case, the first step includes the processes of collection and transportation, the second step includes dismantling and shredding, the third step includes separation and extraction, and the last step includes purification and refining. During these stages, not all of the present product is processed. In fact, in dismantling the aluminum casing that surrounds the engine control units (ECUs) is discarded, during shredding some dust is lost due to the imperfect process, in the refining process there is a percentage of dust that is lost, and finally the non-metallic dust from separation is disposed of.
Especially in the case of aluminum and non-metals there are useful and circular solutions to reuse and recycle these materials as well, however in this work they are calculated as cost items, as they must be disposed of according to regulations. The refining process chosen is hydrometallurgy because it is more sustainable than other methods, such as pyrometallurgy, and because it does not require large quantities of input material to amortize the cost of the process through economies of scale (Birloaga et al., Citation2013) .
Figure 1. Metal extraction process.
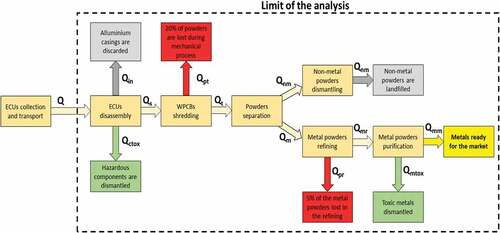
The process of extracting metals by using chemical reagents such as acids to leach out the target metals for further processing is known as hydrometallurgy (Udayakumar et al., Citation2022). The desired metal is extracted from the metal-rich leached liquor via electrorefining, precipitation, cementation, absorption, ion exchange, or solvent extraction (Cui & Anderson, Citation2016). The hydrometallurgical process allows for the recovery of suitable metals (Birloaga et al., Citation2014) with a focus on gold and silver (Liu et al., Citation2021). New approaches are proposed in the literature. Some authors suggest a process that aims to maximize gold recycling by minimizing the number of leaching and purification steps and the amount of waste created (Neto & Soares, Citation2021). Other authors propose an innovative method using chlorate-integrated leaching and chitosan-based bio adsorption with the goal always of selective gold recovery from WPCBs (Bui et al., Citation2021).
Within the automotive sector, recovery of platinum group-elements (PGEs) is essential, useful for CE objectives but also to alleviate demand for these materials (Sun et al., Citation2022). In particular, platinum (Pt), palladium (Pd), and rhodium (Rh) are highly present in automotive catalytic converters (Burlakovs et al., Citation2020) and their demand is expected to grow (Zhang et al., Citation2016). Digitization can support metal recycling (Sorger et al., Citation2021), and attention toward the development of CE models should be directed to non-metallic components (Silva et al., Citation2022).
The following is the set of equations to describe the process flow:
2.2.1. Technical nomenclature
Table
The plant considered in this study is capable of processing 500 tons of WPCBs (QS) annually, a relatively small size but one that follows the principle of aiming to build several plants in as many countries as possible, increasing the capillarity (Rocchetti et al., Citation2018). It is important to note that this case represents a plant capable of handling a single type of electronic board, so there are four distinct cases, one for each type of electronic board subdivision. This represents very low flexibility from a process perspective. Other assumptions, according to the literature (Cucchiella, D’adamo, Rosa, et al., Citation2016), assumed in this work predict 100% saturation of the system. Based on the IMDS data, it is found that approximately 70% of the mass of the ECU is composed of the aluminum casing, while the remaining 30% is composed by the electronic board. A percentage of the casing is composed of toxic materials
, assumed to be 5%. In the shredding stage, about 20% of the dust is lost during the process
. Losses will also occur during the refining process
, but in this case they are estimated at 5%. Considering the totality of the other materials on the boards as toxic is a (pessimistic) approximation, as it is highly unlikely that all materials are harmful to the environment. Our process assumes that the metals from the process are 95% pure. In addition, lead is not sold but disposed of, so it will only belong to the cost items.
2.3. Economic model
The cash flow method makes it possible to assess the time value of money over time and estimate potential cash flows. A widely used indicator in these analyses is Net Present Value (NPV), which identifies the profit or loss produced by a project. In addition, another useful indicator is the Discounted Payback Period (DPBT), which measures the period over which inflows break even with outflows (Cucchiella, D’adamo, Rosa, et al., Citation2016; D’adamo et al., Citation2019).
Regarding cash inflows, the only earnings present are those concerning the sales of metals derived from the production process. Therefore, it will suffice to multiply the quantity of metal with its price ( – ) and with the percentage of purity (
). In year zero, there will be no sales since it is assumed that the plant has yet to be activated. Finally, wanting to maintain a precautionary approach, inflation has not been calculated on cash inflows; it will be applied only to cash outflows.
Regarding cash outflows, there are several cost items present. First, the debt period is set equal to 5 years. Starting in year one, operating costs are considered, which will be subject to inflation. One item for the different case studies concerns the purchase cost. Other costs include material disposal cost, toxic material disposal cost, electricity cost, labour cost, insurance cost, maintenance cost, and reagent cost.
The following is the set of equations to describe the economic model:
2.3.1. Economic nomenclature
Table
The cost components were identified from the literature and validated by three (European) industry experts with 10 years of experience working in the field. The purchase cost depends on the gold board and composition, which is the main source of revenue. The cost of WPCBs is 4000 €/t for small WPCBs, 3000 €/t for Medium-small WPCBs, 3200 €/t for Medium-big WPCBs, and 2500 €/t for Big WPCBs. The lifetime of the project is assumed to be 10 years and the opportunity cost to be 5% (D’adamo et al., Citation2019). All input data are proposed in .
Table 3. Input data. Adapted by (Ardente et al., Citation2014; Cucchiella, D’adamo, Rosa, et al., Citation2016; D’adamo et al., Citation2019; Kamberović et al., Citation2011; Zeng et al., Citation2015).
3. Results
The recycling process has the potential to add value to waste by preventing it from being disposed of inappropriately in the environment and can foster the development of new employment opportunities. This section focuses on the economic analysis of recycling WPCBs by evaluating both a baseline scenario (section 3.1) and alternative scenarios (section 3.2). In addition, the potential market associated with WPCBs in all 27 European countries is described (section 3.3).
3.1. Baseline scenario
The economic model presented in the previous section is populated by the different inputs related to the amount of material processed annually, electronic board specifications, metal prices, and various cost items. There are four scenarios analysed, and they differ only in the type of electronic board processed (small, medium-small, medium-big, and big). proposes the economic results of recycling electronic boards in the automotive sector.
Table 4. Economic indicators – Baseline scenario.
The results show that the DPBT is equal to 1 year. This implies that the initial investment costs are easily recovered in a short time, since they are not significant in such recycling plants. During the first year of life, revenues are much more significant than operating costs, which motivates the results obtained. This aspect is clearly visible from , wherein year zero appears the investment cost spread over 5 years, with a capital share set at 246,400 €.
Figure 2. NPV (million €) - Baseline scenario.
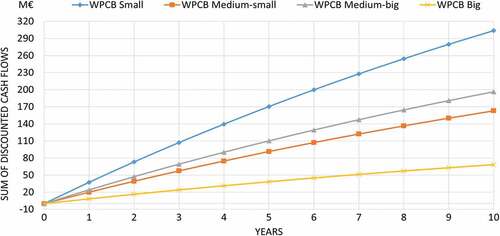
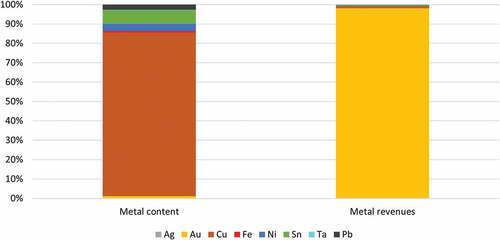
The results show that profitability changes significantly varying from 68.3 million € (Big WPCBs) to 303.8 million € (Small WPCBs). This difference is strongly influenced by the price and the amount of gold present: not surprisingly, Small WPCBs are the ones with more gold presence in percentage (4200 ppm); on the contrary, Big WPCBs are the ones with less presence in percentage (900 ppm). This result is confirmed by the distribution of benefits in which gold accounts on average about 98% of cash inflows (varying from 95.7% of Big WPCBs to 98.5% of Small WPCBs). shows how the price of materials crucially affects the composition of revenues, in which after gold we find copper, which has an important presence among the metals of WPCBs. The cost analysis confirms that the operating costs are the most significant as the investment share is about 5% (Cucchiella, D’adamo, Lenny Koh, et al., Citation2016; Kamberović et al., Citation2011; Zeng et al., Citation2015). The cost of purchasing boards influences more than half of the costs with a weight of 53.6% in accordance with the literature (D’adamo et al., Citation2019). Other relevant costs are Labour (20.1%) and maintenance (7.5%).
Figure 3. Breakdown of materials in terms of composition and economic value.
A comparison with the literature shows that the significant presence of gold in automotive electronic boards as compared to general electronic boards and the high increase in gold prices in recent years push for much more relevant values. In particular, compared to one of the few works that specifically analyses the economic recycling of automotive WPCBs (Cucchiella, D’adamo, Rosa, et al., Citation2016) the results of this work show an increase from 12 million € of Big WPCBs to 37 million € of Medium-Big WPCBs. The main reason for this result is that in this work the price of gold is equal to 51,876 €/kg instead of 32,500 €/kg. It is also worth pointing out that this work considers a lower dimensional capacity of 76 t powders. In this analysis, DPBT was quantified equal to 1 year. The other analyses on WPCBs concern those contained in WEEEs. From these analyses, the key role played by gold content is confirmed. Profitability is not verified in all plants. Thus, NPV ranges from 6.8 million € for medium-grade WPCBs to 63.0 million € for high-grade WPCBs, while it is unprofitable for low-grade WPCBs (−2.8 million €). In addition, the break-even point (BEP) is calculated where profitability is checked against both the price of gold and palladium and the cost of purchasing the boards. The results report that the content of gold can vary from 75 to 210 ppm and that of palladium from 65 to 285 ppm (D’adamo et al., Citation2019). The gold content depends on the specific product being considered: uneconomic scenarios for washing machine, stereo system, CRT TV, and air conditioner with a NPV of about −5.5 million €; while they are positive for digital camera with 59.9 million € and mobile phone with 113.6 million € (Cucchiella, D’adamo, Lenny Koh, et al., Citation2016). Very high values for cell phones are also verified in other analyses, with profits of 3.2 billion $, while it is 44.4 million $ for wasted equipment in general (d’Almeida Fs et al., Citation2022). Other analysis identified a value of 1.6 million $ (Deng et al., Citation2022). Instead, the proposed unit profit values were calculated in other works, and they were equal to 70–2080 €/t (Ghodrat et al., Citation2016) and 779–1202 $/t (Tran et al., Citation2022). An economic process analysis shows a return equal to 1.9 $/kg, demonstrating its industrial viability (Wang et al., Citation2021).
3.2. Alternative scenario
Sensitivity analysis changes a single variable, while scenario analysis changes multiple variables simultaneously. Finally, risk analysis assigns a probability to all critical variables. In addition, a BEP analysis related to the gold content in a generic WPCB is conducted.
3.2.1. Sensitivity analysis
Usually, alternative scenario analyses change the variables by studying both a pessimistic and an optimistic case, but since the current model has largely positive NPV values, it was deemed appropriate to analyse only the pessimistic cases.
The critical variables chosen are:
The cost of purchasing WPCBs, increased by 500 €/t per board type.
The cost of workers, increased by 20% over the baseline, arriving at an annual salary of 54,000 € per operator.
The cost of maintenance, increased by about 25% from the starting value. Its initial value in the first year was 224,400 € and becomes 280,500 € in the alternative scenario.
The selling price of gold, chosen by taking the lowest value in the time period analysed, i.e. 46540 €/kg.
The purity of the metals obtained from the production process, considering three cases where it is decreased by 10% from the baseline case, thus assuming values of 85%, 75%, and 65%, respectively.
Plant saturation, again decreased iteratively by 10% in four cases from the baseline case, assuming values of 90%, 80%, 70%, and 60%.
The opportunity cost, considered both in the case where it is worth 7.5% and 10%.
This choice is justified because on the cost side, the three variables that most influence the result have been identified. Concerning the revenue side, we change gold price, which is the metal that most affects results. In addition, all technological processes aim to achieve high levels of metal purity and consequently this variable must be included in the alternative scenarios, as it plays a similar effect to the reduction of the selling price of the metal. Finally, to assess the impact of plant size, scenarios are considered in which full saturation is not reached, which results in fewer boards processed. Finally, the opportunity cost of capital is a typical DCF variable and can consider different alternative project contexts. reports the NPV value and its percentage change from the baseline case. In pessimistic scenarios, all percentage changes identify a reduction in NPV.
Table 5. NPV (million €) and its percentage decrease – Sensitivity analysis.
The results show that in all 52 alternative scenarios the NPV is always positive. The percentage variation among the critical variables does not occur with the same magnitude, so it cannot be defined which one affects the NPV more. However, it emerges how the cost components have less influence than the other variables, and this result is consistent with what was reported in section 3.1. In particular, the variable that might be most susceptible to variation among the three cost variables is the purchase cost variable since, given the significant presence of gold on this board, evidently this value might push that cost up in correspondence with a gold price that tends to increase in the market. The increase of 500 €/t results in a change in NPV contained between 0.4% and 1.9%. Since it was decided to increase all board purchase prices by a fixed value, the Big WPCBs that have the lowest purchase cost will have the largest percentage change. Variation among the four types of boards tends to be contained as they vary in material content (and in particular gold) and different purchase cost. As for the variation in the price of gold, if it decreases by 10% (i.e. the scenario with 46,540 €/kg), the NPV is reduced by about 10.7–11.8%. This change is highly possible, since these values are the extremes that have been recorded in the market over the past year. However, with the same probability, it is also possible for the NPV to increase due to a positive change in this price. A reduction in purity levels has the same effect as a reduction in the selling price of the metal. Although the analysis covers all metals, given the weight of gold the effect is mainly on this variable. In fact, the gold price of 51,876 €/kg due to the effect of 95% purity becomes 49,282 €/kg. When a 10% reduction in gold purity is applied that price becomes 44,095 €/kg. The change is more significant (−10.5%) than at the decrease in the gold price seen above, resulting in a greater change in NPV, which is reduced by about 11.1–12.6%.
The low weight of investment costs results in a lower impact on the degree of plant saturation, which in correspondence with a reduction in the number of boards processed sees an equal decrease in operating costs, but also in related revenues. The change in NPV is between 10.2% and 10.7% in correspondence with a 10% reduction in boards processed. This scenario appears to be unlikely since the size of the plant studied in this work appears to belong to a small-to-medium size plant and considering the growing trend that characterizes this market. The last variable analysed is that of the opportunity cost of capital. A higher value of the risk associated with 7.5% results in a reduction in NPV of 11.1%. The higher risk could be associated with the idea that the investor might opt to recycle other alternative projects associated with the same level of risk. This scenario may clearly depend on the macroeconomic environment to be considered.
3.2.2. Scenario analysis
The next step was to vary multiple variables simultaneously. In the scenario analysis, the choice of considering pessimistic scenarios is confirmed and three reference scenarios are evaluated:
‘revenues’, in which metal prices are at their lowest value.
‘costs’, in which the three major cost items (purchase, labour, and maintenance) are increased.
‘revenues’ and ‘costs’, in which prices are at a minimum value, and cost items are increased.
The choice of inputs is the same as that conducted in the sensitivity analysis, and for metal prices, apart from gold, minimum values are also chosen for all others. In addition, in order to consider the other critical variables as well, the previous scenarios are repeated in three other contexts in which the following assumptions are set: i) the purity level is set at 60%; ii) the degree of plant saturation is set at 60%, and iii) the purity level and degree of plant saturation are set at 60%. Therefore, the most pessimistic scenario was chosen to be considered. reports the NPV value and its percentage change from the baseline case. In pessimistic scenarios, all percentage changes identify a reduction in NPV.
Table 6. NPV (million €) and its percentage decrease – Sensitivity analysis.
The results of this analysis highlight that profitability is confirmed in all 48 scenarios analysed. This finding was not obvious since these scenarios consider a set of variables that all vary pessimistically. Comparing the revenue versus cost variables, we observe the largest changes considering the cash flow distribution of these circular projects. The decrease in all prices leads to results similar to those found with the variation in gold, given the weight this metal has within the distribution of benefits. Changes in the NPV are contained in the 11.0–12.9% range and become 11.7–16.1% when costs are also included in the changes. These scenarios are no less predictable than the scenarios highlighted in the sensitivity analyses because business plans can predict a change in different cash flows. In order to provide additional cases for the analysis, these scenarios are re-proposed with the assumption of a 60% metal purity level. This assumption provides for an inadequate level of technology; if it is combined with pessimistic changes in the three main cost items and metal prices can result in a reduction in NPV of 46.6–55.4%. The negative change in NPV is 47.8–53.1% when the change in these variables is associated with a plant saturation level of 60%. Again, on a par with the previous variable, this scenario involves almost halving the number of boards processed, an assumption that turns out to be partially remote. Finally, in order to consider a very pessimistic scenario, we consider the negative change in costs, metal prices, metal purity level at 60% and a saturation degree at 60% resulting in a reduction in NPV of 68.8–76.7%. The results thus confirm that enterprises are committed to having technology levels that aim to maximize the degree of purity of metals and at the same time have a commercial network capable of having boards available to process.
3.2.3. Risk analysis
Previous analyses have remarked that the probability of occurrence was not assigned. This work uses the Monte Carlo method, predicting a thousand iterations based on a probability distribution associated with the multiple variables (purchase cost, labour cost, maintenance cost, and the gold price). Therefore, for each variable, a normal function is defined with mean and standard deviation established as follows: the mean value is chosen equal to the baseline case, while the standard deviation in accordance with the values defined in the alternative scenarios: 500 €/t for purchase cost; 20% for labour cost; 25% for maintenance cost; and 3190 €/kg for gold price. Unlike previous analyses, optimistic scenarios are also considered considering the presence of normal distributions. proposes scatter plots to show how plant profitability varies according to the four types of boards.
Figure 4. NPV (million €) - Risk analysis.
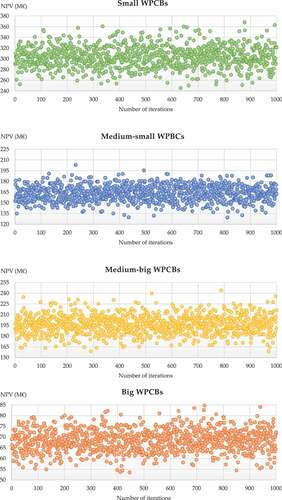
The results of this analysis confirm that this project is risk-free. For all treated boards, the probability of having positive NPV is verified always. This again demonstrates the robustness of the model described earlier and attests that even in critical and unfavourable cases profitability and economic advantage are not compromised. The values shown on the y-axis highlight the difference in profitability among the four types already emphasized in the baseline case scenario. In addition, the analyses are repeated in scenarios where the degree of metal purity is set at 60%, or with a degree of plant saturation at 60%, and finally when both of these variables are at 60%. The results confirm that NPV decreases significantly, but even in these scenarios profitability is always verified.
3.2.4. Break-even point analysis
BEP analysis makes it possible to identify the value of a critical variable that makes the NPV equal to zero. This information provides additional information to the decision-maker and allows assessments to be extended to additional scenarios (D’adamo et al., Citation2019). BEP is conducted for both the baseline scenario and the critical variables examined in the sensitivity analysis – .
Figure 5. Gold content within WPCB – BEP analysis.
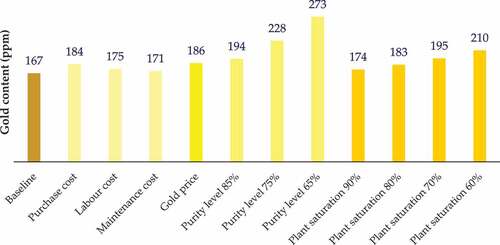
The results show that the values associated with gold content are much lower than the potential content found in automotive WPCBs. However, these results are very useful since they could be exported to WPCBs belonging to WEEEs. The information reported is consistent with the results expressed above, which show that in the baseline case scenario it is necessary for the WPCB to have at least 167 ppm to have a zero NPV. The impact of the price of gold (186 ppm) is more significant than that of costs, and there are greater effects brought about by the change in purity level as there is inevitably the phenomenon of a reduction in the price at which these materials could be resold (secondary markets that cannot be assimilated to markets where a very good-quality raw material is obtained). In the 65% purity scenario, there is a BEP of 273 ppm. The impact associated with the cost opportunity of capital is not reported in the analyses because it does not appear to be significant. These analyses support the profitability of these boards even in a future scenario where the weight of gold may decrease within a single PCB as at the same time there is an increase in boards due to increased use of integrated technology (Sassanelli et al., Citation2021).
3.3. Economic potential of WPCBs in the European ELVs market
The last analysis in this work aims to estimate the economic potential associated with the recovery of WPCBs considering the European market. To this end, we first estimate the future trend regarding the weight of ELVs. The historical value was identified by Eurostat and runs from 2008 to 2019. The latest actual figure is that of 2019 (equal to 6889 thousand tons) and assuming an average growth rate of 4.49%, a projection can be made until 2030 (equal to 11,171 thousand tons) - .
Figure 6. Trend and estimated weight of ELVs in Europe.
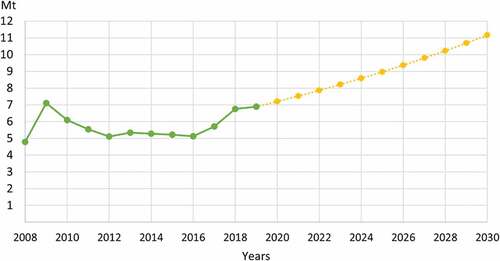
The final data collected by Eurostat show discordant values, in which there is no steady upward or downward trend. The spike in 2009 may be motivated by short-term government subsidies regarding scrappage programs in order to dispose of older vehicles during the financial crisis to encourage the implementation of new projects. In addition, as of 2015, European states must ensure a minimum reuse and recycling rate of 85% and a reuse and recovery rate of 95%. Thus, the observation arises that the new European regulations have driven the growth of ELVs. In addition, it is possible to assume a growth rate from 2019, due to the CE policies in place on the European continent.
From the annual ELV number and its total weight, the average mass of a vehicle in each year could be calculated. It is equal to 1.03 tons. This value is coherent with the literature (Zorpas & Inglezakis, Citation2012). Next, the average mass of the electronic boards of the cars was defined. The average weight was estimated to be 85 g in accordance with IMDS. Given that on average there are about 15 mechatronic components in a car (Kripli et al., Citation2010) and that each of them incorporates at least one electronic board (Steinhilper et al., Citation2012), the total weight of PCBs in a single car can be derived by multiplying the average weight with the number of boards, equal to 1.275 kg per car. Therefore, the ratio of the weight of electronic boards to the total weight of a car can be derived, and it is equal to 0.124%. This value is used to quantify the annual generation of WPCBs from ELVs by multiplying this percentage by the total weight of ELVs. This approach was identified according to the literature (Cucchiella, D’adamo, Rosa, et al., Citation2016).
The next step was to transform these volumes into economic terms. It is assumed that all WPCBs of European ELVs are disposed of properly. We consider the profitability indicator related to the unit of boards processed by evaluating the most pessimistic scenario (represented by Big WPCBs) and the most optimistic scenario (represented by Small WPCBs). The pessimistic value is 136,570 €/t, while the optimistic value is 607,621 €/t (). reports the overall economic estimates in terms of NPV.
Table 7. Results of the estimation on the recycling of electronic boards of European ELVs.
These values represent the potential market size of the WPCB recycling market, which may range from 1.16 billion € to 5.17 billion € for 2019. As for future estimates, the market size in 2030 may range between 1.89 billion € and 8.39 billion €. These values, although approximate and theoretical, again demonstrate the importance of proper management of car electronic boards and the very large profits that could potentially be achieved.
4. Conclusions
Sustainability is a complex challenge in which the CE plays a key role because it allows not only to prevent some waste from inappropriately ending up in landfills but also to enhance the value of the resources it contains. The automotive sector is characterized by a sudden change in which Europe has pushed very significantly toward electric. This results in the business model of enterprises undergoing transformation, and many vehicles may reach the end of their lifecycle even sooner than they should. Sustainability is not based on short product life cycles, so it is necessary that vehicles powered by fossil sources but still with non-impact engines complete their process in accordance with their life cycle. In contrast, an end-of-life is desirable for those vehicles that are dated in time, lacking technological innovation and therefore potentially very harmful to the environment. This huge waste stream results in resources from the automotive sector that can be managed with circularity practices. Recycling technology is certainly capable of achieving a good degree of purity of the metals obtained, and the results obtained from this work show that profitability is verified in all scenarios examined. Thus, risk-free projects in which the economic return is very significant. The NPV ranges from 68.3 to 303.8 million € with a DPBT of 1 year. The results are strongly influenced by the significant gold content present in automotive WPCBs from 900 to 4200 ppm. However, also other reflections emerge from this work. The first concerns the great opportunity for SMEs, which in the presence of a good network with enterprises in the industry can achieve significant economic returns. These benefits could also be amplified by policy instruments of subsidized taxation or investments on integrated logistics that could make some territories suitable for establishing recycling hubs close to the places where vehicles are produced. Phenomena of industrial symbiosis and sustainable communities are the hope toward which to strive. The second major aspect of this work is that there is currently potential commercial dominance for those countries that hold the raw materials used in the products of the future (particularly the Asian continent). It therefore turns out to be important to implement recycling also to obtain raw materials that would otherwise not be available in some countries, and this obviously can have a positive impact on the national industry supply chain. The data on Europe make it clear that there is a need to push for self-sufficiency by pursuing geopolitical stability solutions. Third, the profitability of WPCBs can offset less profitable recycling processes since the goal should be to recycle all of the product, so compensatory phenomena between the different parts need to be developed. This can be achieved if there is a social responsibility discipline toward such products. End of waste and extended producer responsibility are the key-points to implement good sustainable management practices within ELVs. At the same time, it is also necessary to encourage the flexibility of plants that can process other types of waste (e.g. WEEEs).
One of the limitations of the work is to consider WPCBs associated to the thermal cars and not electric cars, which will have to be evaluated. The comparison between ICEs and electric engines also requires in-depth analysis not only from an environmental but also from a social perspective. At the same time, a survey of industry stakeholders is needed to understand policies that could improve the existing structure. European estimates range from 1.89 billion € to 8.39 billion € in 2030, representative of the possible gains if all the electronic boards in European cars at the end of their lives were disposed of properly. The realization of circular projects within automotive hubs such as to make these industrial realities more autonomous in raw materials, oriented to reintegrate the different professional profiles no longer needed in the new activities of the electric vehicle industry and to limit the environmental impact related to illegal trafficking of waste or in general unsustainable management. In addition, it is able to generate economic benefits that can distribute among the various actors in the supply chain. Recycling of automotive WPCBs is thus an enabler of economic development and a best practice for circular manufacturing ecosystems.
Disclosure statement
No potential conflict of interest was reported by the authors.
Additional information
Funding
References
- Andersson, M., Ljunggren Söderman, M., & Sandén, B. A. (2019). Challenges of recycling multiple scarce metals: The case of Swedish ELV and WEEE recycling. Resources Policy, 63, 1–23. https://doi.org/10.1016/j.resourpol.2019.101403
- Ardente, F., Mathieux, F., & Recchioni, M. (2014). Recycling of electronic displays: Analysis of pre-processing and potential ecodesign improvements. Resources Conservation and Recycling, 92, 158–171. https://doi.org/10.1016/j.resconrec.2014.09.005
- Banaeian, N., Mobli, H., Nielsen, I. E., & Omid, M. (2015). Criteria definition and approaches in green supplier selection – a case study for raw material and packaging of food industry. Production & Manufacturing Research, 3(1), 149–168. https://doi.org/10.1080/21693277.2015.1016632
- Birloaga, I., Coman, V., Kopacek, B., & Vegliò, F. (2014). An advanced study on the hydrometallurgical processing of waste computer printed circuit boards to extract their valuable content of metals. Waste Management, 34(12), 2581–2586. https://doi.org/10.1016/j.wasman.2014.08.028
- Birloaga, I., De Michelis, I., Ferella, F., Buzatu, M., & Vegliò, F. (2013). Study on the influence of various factors in the hydrometallurgical processing of waste printed circuit boards for copper and gold recovery. Waste Management, 33(4), 935–941. https://doi.org/10.1016/j.wasman.2013.01.003
- Bodendorf, F., Merbele, S., & Franke, J. (2022). Deep learning based cost estimation of circuit boards: A case study in the automotive industry. International Journal of Production Research, 60(23), 6945–6966. https://doi.org/10.1080/00207543.2021.1998698
- Bui, T. H., Jeon, S., & Lee, Y. (2021). Facile recovery of gold from e-waste by integrating chlorate leaching and selective adsorption using chitosan-based bioadsorbent. Journal of Environmental Chemical Engineering, 9(1), 104661. https://doi.org/10.1016/j.jece.2020.104661
- Burlakovs, J., Vincevica-Gaile, Z., Krievans, M., Jani, Y., Horttanainen, M., Pehme, K. -M., Dace, E., Setyobudi, R. H., Pilecka, J., Denafas, G., Grinfelde, I., Bhatnagar, A., Rud, V., Rudovica, V., Mersky, R. L., Anne, O., Kriipsalu, M., Ozola Davidane, R., Tamm, T., & Klavins, M. (2020). Platinum Group Elements in Geosphere and Anthroposphere: Interplay among the Global Reserves, Urban Ores, Markets and Circular Economy. Markets and Circular Economy Minerals, 10(6), 558. https://doi.org/10.3390/min10060558
- Cucchiella, F., D’adamo, I., Lenny Koh, S. C., & Rosa, P. (2016). A profitability assessment of European recycling processes treating printed circuit boards from waste electrical and electronic equipments. Renewable and Sustainable Energy Reviews, 64, 64. https://doi.org/10.1016/j.rser.2016.06.057
- Cucchiella, F., D’adamo, I., Rosa, P., & Terzi, S. (2016). Automotive printed circuit boards recycling: An economic analysis. Journal of Cleaner Production, 121, 130–141. https://doi.org/10.1016/j.jclepro.2015.09.122
- Cui, H., & Anderson, C. G. (2016). Literature review of hydrometallurgical recycling of printed circuit boards (PCBs). Journal of Advanced Chemical Engineering, 6, 142–153. https://doi.org/10.4172/2090-4568.1000142
- D’adamo, I., Ferella, F., Gastaldi, M., Maggiore, F., Rosa, P., & Terzi, S. (2019). Towards sustainable recycling processes: Wasted printed circuit boards as a source of economic opportunities. Resources Conservation and Recycling, 149, 455–467. https://doi.org/10.1016/j.resconrec.2019.06.012
- D’adamo, I., Gastaldi, M., & Ozturk, I. (2022). The sustainable development of mobility in the green transition: Renewable energy, local industrial chain, and battery recycling. Sustain Dev; https://doi.org/10.1002/sd.2424
- D’adamo, I., Mazzanti, M., Morone, P., & Rosa, P. (2022). Assessing the relation between waste management policies and circular economy goals. Waste Management, 154, 27–35. https://doi.org/10.1016/j.wasman.2022.09.031
- D’adamo, I., & Rosa, P. (2019). A structured literature review on obsolete electric vehicles management practices. Sustainability, 11(23), 1–17. https://doi.org/10.3390/su11236876
- Dallasega, P., Rauch, E., & Linder, C. (2018). Industry 4.0 as an enabler of proximity for construction supply chains: A systematic literature review. Computers in Industry, 99, 205–225. https://doi.org/10.1016/j.compind.2018.03.039
- d’Almeida Fs, de Carvalho Rb, dos Santos Fs, de Souza Rf, d’Almeida, F. S., de Carvalho, R. B., dos Santos, F. S., & de Souza, R. F. M. (2022). Economic analysis of a conceptual industrial route for printed circuit boards processing based on mass and energy balances. World, 3(3), 434–448. https://doi.org/10.3390/world3030023
- Deng, S., Xiao, Z., Zhang, W., Noble, A., Das, S., Yih, Y., & Sutherland, J. (2022). Techno-economic assessment of precious metal recovery from electronic waste through gas-assisted microflow extraction. SSRN Electronic Journal, 1–14. https://doi.org/10.2139/ssrn.4167510
- Feng, Y., Xia, X., Wang, L., & Zhang, Z. (2022). Multi-objective optimization of recycling and remanufacturing supply chain logistics network with scalable facility under uncertainty. Production & Manufacturing Research, 10(1), 641–665. https://doi.org/10.1080/21693277.2022.2113472
- Ghodrat, M., Rhamdhani, M. A., Brooks, G., Masood, S., & Corder, G. (2016). Techno economic analysis of electronic waste processing through black copper smelting route. Journal of Cleaner Production, 126, 178–190. https://doi.org/10.1016/j.jclepro.2016.03.033
- Kamberović, Ž., Korać, M., Ivšić, D., Nikolić, V., & Ranitović, M. (2011). Hydrometallurgical process for extraction of metals from electronic waste, part II: Development of the processes for the recovery of copper from printed circuit boards (PCB). Metalurgija-MJoM, 17, 139–149. https://technorep.tmf.bg.ac.rs/handle/123456789/1823
- Kripli, J., Vandenberg, R., Steinhilper, R., Freiberger, S., & Weiland, F. (2010). Remanufacturing automotive mechatronics & electronics. APRA Europe.
- Liu, G., Pan, D., Wu, Y., Yuan, H., Yu, L., & Wang, W. (2021). An integrated and sustainable hydrometallurgical process for enrichment of precious metals and selective separation of copper, zinc, and lead from a roasted sand. Waste Management, 132, 133–141. https://doi.org/10.1016/j.wasman.2021.07.020
- Markets and Markets. (2017). Automotive microcontrollers market by application (body electronics, chassis & powertrain, infotainment & telematics, safety & security), Technology (ACC, Blind Spot Detection, Park Assist, TPMS), Vehicle, EV, Bit Size, Connectivity, and Region - Global Forecast to 2023.
- Miklautsch, P., & Woschank, M. (2022). Decarbonizing industrial logistics. IEEE Engineering Management Review, 50(3), 149–156. https://doi.org/10.1109/EMR.2022.3186738
- Molla, A. H., Shams, H., Harun, Z., Ab Rahman, M. N., & Hishamuddin, H. (2022). An assessment of drivers and barriers to implementation of circular economy in the end-of-life vehicle recycling sector in India. Sustainability, 14(20), 13084. https://doi.org/10.3390/su142013084
- Neto, I. F. F., & Soares, H. M. V. M. (2021). Simple and near-zero-waste processing for recycling gold at a high purity level from waste printed circuit boards. Waste Management, 135, 90–97. https://doi.org/10.1016/j.wasman.2021.08.025
- Rajesh, R., Kanakadhurga, D., & Prabaharan, N. (2022). Electronic waste: A critical assessment on the unimaginable growing pollutant, legislations and environmental impacts. Environmental Challenges, 7, 100507. https://doi.org/10.1016/j.envc.2022.100507
- Restrepo, E., Løvik, A. N., Wäger, P. A., Widmer, R., Lonka, R., & Müller, D. S. (2017). Flows, and distribution of critical metals in embedded electronics in passenger vehicles. Environmental Science & Technology, 51(3), 1129–1139. https://doi.org/10.1021/acs.est.6b05743
- Rocchetti, L., Amato, A., & Beolchini, F. (2018). Printed circuit board recycling: A patent review. Journal of Cleaner Production, 178, 814–832. https://doi.org/10.1016/j.jclepro.2018.01.076
- Sassanelli, C., Rosa, P., & Terzi, S. (2021). Supporting disassembly processes through simulation tools: A systematic literature review with a focus on printed circuit boards. Journal of Manufacturing Systems, 60, 429–448. https://doi.org/10.1016/j.jmsy.2021.07.009
- Silva, M., Silva, R., Nóvoa, P., Hmvm, S., Mmsm, B., & Marques, A. (2022). Development and characterization of bulk and epoxy molding compounds from non-metallic fractions recovered from printed circuit boards. Materials Proceedings, 8, 73. https://doi.org/10.3390/materproc2022008073
- Siwal, S. S., Kaur, H., Deng, R., & Zhang, Q. (2023). A review on electrochemical techniques for metal recovery from waste resources. Curr Opin Green Sustain Chem, 39, 100722. https://doi.org/10.1016/j.cogsc.2022.100722
- Sorger, M., Ralph, B. J., Hartl, K., Woschank, M., & Stockinger, M. (2021). Big data in the metal processing value chain: A systematic digitalization approach under special consideration of standardization and SMEs. Applied Sciences, 11(19), 9021. https://doi.org/10.3390/app11199021
- Steinhilper, R., Freiberger, S., Nagel, A., Staarman, L. K., Kohler, D., & Tom, E. R. M., (2012). European automotive remanufacturing. FJW Consulting.
- Sun, S., Jin, C., He, W., Li, G., Zhu, H., & Huang, J. (2022). A review on management of waste three-way catalysts and strategies for recovery of platinum group metals from them. Journal of Environmental Management, 305, 114383. https://doi.org/10.1016/j.jenvman.2021.114383
- Tran, D. T., Choi, J. -W., & Yun, Y. -S. (2022). Feasibility of direct conversion of copper present in waste printed circuit boards to oxidation-resistant materials employing eco-benign iron(iii) sulfate and ascorbic acid. Sustainable Materials and Technologies, 33, e00499. https://doi.org/10.1016/j.susmat.2022.e00499
- Trivedi, A., Vishwakarma, A., Saawarn, B., Mahanty, B., & Hait, S. (2022). Fungal biotechnology for urban mining of metals from waste printed circuit boards: A review. Journal of Environmental Management, 323, 116133. https://doi.org/10.1016/j.jenvman.2022.116133
- Udayakumar, S., Miba, R., & Ismail, S. (2022). Recovering valuable metals from Waste Printed Circuit Boards (WPCB): A short review. Materials Today: Proceedings, 66, 3062–3070. https://doi.org/10.1016/j.matpr.2022.07.364
- Vacchi, M., Siligardi, C., Cedillo-González, E. I., Ferrari, A. M., & Settembre-Blundo, D. (2021). Industry 4.0 and smart data as enablers of the circular economy in manufacturing: product re-engineering with circular eco-design. Sustainability, 13(18), 10366. https://doi.org/10.3390/su131810366
- Wang, J., & Chen, M. (2011). Recycling of electronic control units from end-of-life vehicles in China. JOM - J Miner Met Mater Soc, 63(8), 42–47. https://doi.org/10.1007/s11837-011-0136-9
- Wang, J., & Chen, M. (2013). Remanufacturing process for used automotive electronic control components in China. Journal of Remanufacturing, 3(1), 1–17. https://doi.org/10.1186/2210-4690-3-9
- Wang, J., Huang, Z., Yang, D., Zeng, X., Chen, M., Shu, J., Sun, Z., Sun, S., & Xiao, Z. (2021). A semi-scaled experiment for metals separating and recovering from waste printed circuit boards by slurry electrolysis. Process Safety and Environmental Protection, 147, 37–44. https://doi.org/10.1016/j.psep.2020.09.030
- Wu, C., Awasthi, A. K., Qin, W., Liu, W., & Yang, C. (2022). Recycling value materials from waste PCBs focus on electronic components: Technologies, obstruction and prospects. Journal of Environmental Chemical Engineering, 10(5), 108516. https://doi.org/10.1016/j.jece.2022.108516
- Zeng, X., Song, Q., Li, J., Yuan, W., Duan, H., & Liu, L. (2015). Solving e-waste problem using an integrated mobile recycling plant. Journal of Cleaner Production, 90, 55–59. https://doi.org/10.1016/j.jclepro.2014.10.026
- Zhang, J., Everson, M. P., Wallington, T. J., Friii, F., Roth, R., & Kirchain, R. E. (2016). Assessing economic modulation of future critical materials use: The case of automotive-related platinum group metals. Environmental Science & Technology, 50(14), 7687–7695. https://doi.org/10.1021/acs.est.5b04654
- Zorpas, A. A., & Inglezakis, V. J. (2012). Automotive industry challenges in meeting EU 2015 environmental standard. Technology in Society, 34(1), 55–83. https://doi.org/10.1016/j.techsoc.2011.12.006
