
ABSTRACT
Knowledge extraction and reuse are critical topics for manufacturing companies willing to strengthen their Product-Service Systems (PSS) offerings. In manufacturing’s maintenance processes, effectiveness and efficiency depend on the ability to learn from past field interventions. Dealing with unstructured descriptions of maintenance activities has prevented manufacturing companies from analyzing them, causing the loss of useful information. Natural Language Processing (NLP) demonstrated high potential, allowing simplified text knowledge extraction and summarization. Besides, the literature presents only a few applications of topic modeling for maintenance improvement in the manufacturing domain. Using a case study, the paper demonstrates the potentialities of NLP adoption to improve not only the maintenance management and execution but also the asset design and management, impacting the whole PSS. In other words, implications will have effects on the operational (e.g. maintenance execution), managerial (e.g. maintenance management), and business levels (e.g. PSS offering definition) of manufacturing firms.
1. Introduction
The spreading of Product-Service Systems (PSS) offerings, namely bundles of physical products and intangible services, is contributing to creating service-based lifecycle-long interactions between providers and customers (Sassanelli et al., Citation2018) also resulting in more sustainable economic, environmental, and social outcomes, usually referred to as the Triple Bottom Line (TBL) (Sénéchal, Citation2017).
To be competitive, manufacturers need to constantly improve their PSS solutions in terms of product design and functionalities, as well as service offerings and competencies (Wallin et al., Citation2015). In particular, this paper focuses on field service maintenance since it represents a solid competitive and sustainability enabler for manufacturing companies (Sala et al., Citation2021).
Maintenance is one of the core services manufacturing companies offer to guarantee longer lifecycles and higher productivity of products (from now on referred to as industrial assets or assets) in terms of safety, availability, and quality and, due to this, has gained considerable importance over the years (Mostafa et al., Citation2015). Nonetheless, offering proper maintenance is not trivial since it requires updates and adjustments based on the asset usage (e.g. production speed, frequency of maintenance activities) and environmental conditions (e.g. external temperature and humidity). Poor maintenance strategies are estimated to reduce a plant’s overall production capacity from 5 to 20% (Coleman et al., Citation2022).
Even if Industry 4.0 is paving the way towards remote monitoring and predictive maintenance approaches to keep assets’ health status under control – and intervene only when deviations from normal behavior occur – technical and business challenges still limit the application of these approaches in the industrial context, forcing many companies to rely on preventive and corrective maintenance (Zoll et al., Citation2018). This means that maintenance interventions are provided upon customers’ calls and executed in loco by companies’ technicians that, based on their skills and expertise, diagnose the causes, and repair the asset.
Then, technicians are often requested to fill free text-based reports with data related to failures, causes, resolution approaches, spare parts used, and others. Despite being a relevant source of knowledge, these reports are frequently only used to quantify and justify invoices. At the same time, technical information is not analyzed, mainly because data is not gathered in a structured way and the analysis would be too time-consuming. This knowledge could bring improvements to the two main dimensions of the PSS, namely the product (e.g. asset and related features) and the service (e.g. delivery process, technician skills, new service offering).
In parallel with the growing need to exploit knowledge from the field, Artificial Intelligence and Machine Learning-related techniques and approaches such as Natural Language Processing (NLP), defined as ‘the machine’s ability to identify, process, understand and/or generate information in written and spoken human communications’ (Samoili et al., Citation2020), are gaining attention for practitioners and researchers. NLP techniques can be used for information extraction and summarization, and research on its benefits in the maintenance field is ongoing (Ansari, Citation2020). The results of text analysis can drive improvements related to asset failure rates and modes (Gunay et al., Citation2019), leading to the re-design of the components as well as the update of maintenance activities or its management (Khare & Chougule, Citation2012).
This paper aims at investigating how knowledge collected during the maintenance delivery process can be extracted and reused by employing NPL to guide the improvement of the asset and related services in a manufacturing context answering the following research question:
How can PSS offerings be improved based on the knowledge extracted from field service maintenance reports?
To answer, the paper presents a case study set in an Italian manufacturing company where maintenance reports have been analyzed with NLP approaches to extract and reuse knowledge for improvement purposes. It is important to clarify that the paper’s focus is not on presenting a new methodology for NLP analysis but rather discussing and showing the usefulness of this approach in the PSS context.
To achieve the objectives, the paper is structured as follows. After a brief literature background (section 2), the approach for knowledge extraction and reuse (section 3), and the methodology for analysis are described (section 4). Then, the case study (section 5), as well as the results (section 6), are presented. Following, a discussion of the results is provided to show how the knowledge extracted could contribute to the improvement of the PSS offering of the Italian company (section 7) as well as on a more general level (section 8) before concluding the paper (section 9).
2. Literature background
The development of effective PSS offerings in the manufacturing context critically depends on the level of integration of the product and service components (Sassanelli et al., Citation2018). Data generated during the PSS lifecycle can support decision-making during the beginning-of-life (Mourtzis et al., Citation2016) and middle-of-life phases (Macchi et al., Citation2018). As discussed by (Sala et al., Citation2021) to allow improving offerings and operations, it is necessary to identify a source of knowledge that can be used to guide the improvements during each iteration of the PSS offering, with monitoring activities (Mourtzis et al., Citation2018), feedback collection, and analysis (Ali et al., Citation2020) being conducted to understand the strengths and weaknesses of the current ones. Various authors discussed the importance of knowledge extraction and reuse in the field of PSS to address problems related to PSS design (Sassanelli et al., Citation2018) and service execution and improvement (Sala et al., Citation2021) – e.g. using means such as simulation (Mourtzis, Citation2020, Citation2021) or process modeling (Medini & Boucher, Citation2019).
All authors agree on the importance of having a structured approach guaranteeing the possibility to collect, retrieve, share, and use the knowledge generated to improve the decisions, especially in the manufacturing context where maintenance decisions have direct consequences on the assets’ productivity (Subramaniyan et al., Citation2018). Such discussion can be connected to the one provided by (Rowley, Citation2007) that describes the transformation of data collected into information, knowledge (used to improve the object of the analysis), and wisdom (knowledge generalized and reused for other purposes).
Despite this, authors like (Ansari, Citation2020) discussed the problems related to the data generated during field service maintenance that is frequently not analyzed despite being potentially useful. While this problem might be avoided when field service maintenance reports are synthetic and structured, when they are filled in the form of free text, analyses become difficult and time-consuming.
While the contribution of numerical and operational data is widely explored to support maintenance decisions in the manufacturing context (Mateus et al., Citation2023; Mourtzis et al., Citation2017), NLP is gaining interest as researchers explore applications in the maintenance field (Bhardwaj et al., Citation2022). The adoption of NLP is becoming growingly relevant, especially when it comes, among others, to chatbots (Chen & Tsai, Citation2021) or text summarization (Gupta & Gupta, Citation2021). The literature on NLP allows understanding the potentialities of this approach in field service maintenance, such as failure topic extraction (Bhardwaj et al., Citation2022), or maintenance request classification (Bouabdallaoui et al., Citation2020). Some authors have already started researching this aspect, adopting methods and algorithms to support knowledge extraction from field service maintenance reports (Usuga Cadavid et al., Citation2020). The same can be said for (Arena et al., Citation2022), where NLP is applied to Oil and Gas maintenance data.
Other authors highlight the necessity to ensure data quality and correct the use of non-standard jargon by technicians (Sexton & Fuge, Citation2019) to increase the reliability of the analyses. For instance (Hong et al., Citation2022), used NLP to correct text classification for facility maintenance. In agreement with (Brundage et al., Citation2021; Naqvi et al., Citation2022) discusses the problem of technical language used in maintenance reports, clarifying the necessity of proper pre-processing and human intervention during the analysis.
This paper aims at investigating the effectiveness of NLP in analyzing manufacturers’ field service maintenance reports to improve PSS offerings. The adoption of NLP should be seen as a part of a major continuous improvement process that creates a connection between the design and use phases. PSS design can exploit additional information to create offerings able to address customers’ needs while considering the provider’s constraints and requirements. Indeed, NLP should be seen as a means to provide actors with the knowledge to help them design, use and/or deliver assets and services so that all the stakeholders can achieve a higher level of satisfaction.
3. Knowledge extraction and reuse process from maintenance reports
As previously mentioned, the transformation of data collected into usable knowledge is crucial to support the PSS offering improvement process. Despite this, generating knowledge from data is not trivial and requires a structured approach that considers formalized steps and tools. Such a process has been defined based on the literature analysis on the PSS lifecycle. Researchers are increasingly highlighting the importance of data in PSS since it is part of the knowledge extraction and reuse process for design and value creation purposes (Machchhar et al., Citation2022). Thus, depicts the process proposed for knowledge extraction from field service maintenance reports and its exploitation for improvement purposes.
Figure 1. Methodology for the analysis of field service maintenance reports.
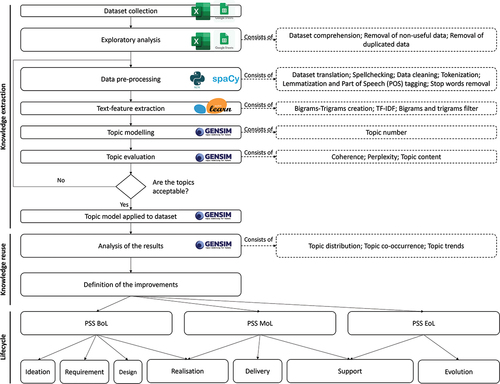
The typical PSS lifecycle summarized in the lower part of is based on (Wiesner et al., Citation2015). Three main periods are identified: the Beginning-of-Life (BoL), where the PSS is ideated, designed, and realized based on a set of requirements; the Middle-of-Life (MoL), with the PSS realization and delivery and the support for its operations, this is the moment where maintenance service contributes to restoring the PSS operations and prolong the use phase; and the End-of-Life (EoL) where activities aimed at managing the last stage of the PSS lifecycle are executed. During the MoL, maintenance service is delivered, and reports are filled. In the proposed process, data is stored and analyzed to extract knowledge enabling the asset and service performance monitoring, intercepting recurring problems, and comparing results with reference data to identify deviations from expected. Thus, it would be possible to define improvements related to the asset design (e.g. functionalities or components), or the field service maintenance (e.g. activities and resources involved in the delivery process). Not only, since new service offerings might also emerge (e.g. additional training, offering digital-enabled remote services).
Also, important information related to the PSS operations might be extracted, and suggestions on how to use the asset might be provided to customers to increase the asset’s useful life, reducing the need for corrective maintenance, and contributing to the achievement of the TBL objectives (Franciosi et al., Citation2020; Sénéchal, Citation2017). A case study approach has been selected to investigate how the use of NLP might contribute to the improvement of the PSS offering.
4. Methodology for the analysis of field service maintenance reports
The paper aims at answering the research question ‘How can PSS offerings be improved based on the knowledge extracted from field service maintenance reports?’ through the use of a case study where the database of maintenance reports from Company A is analyzed using NLP, as shown in . The upper-left side of the figure depicts the nine macro-phases, while the right side shows the sub-phases composing them. In addition, each macro phase is associated with a specific software or Python package to allow the reader to understand the approach. Once collected, data are analyzed using Python 3.9.7 and the related text-mining modules. The following subsections describe the content of each macro phase as well as the software that can be used to execute each phase of the proposed approach, while reports the pseudocode used to analyze discussed in the following subsections.
Table 1. Pseudocode for analysis.
4.1. Dataset collection
Dataset collection represents the first step of the process. This phase requires extracting textual and numeric/time-related data from the company database and, when necessary, merging data from different sources and formats (e.g..csv, JSON,txt).
4.2. Exploratory analysis
The exploratory analysis aims to understand the data collected. Duplicated data, columns, and non-useful information are removed. When necessary, data are converted into useful formats and uniformed (e.g. same date format, currency).
4.3. Data pre-processing
This phase is needed to prepare the data for the topic modeling. It is made of the following steps:
Dataset translation. To favor the analysis, the dataset is translated into one language. For this, translation services, such as Google Translate, can be used.
Spellchecking. Written texts are frequently subject to misspellings or typos. Thus, a spellchecker on the text using Textblob (Loria, Citation2018) is run.
Data cleaning. All the parts of the text non-useful for the analysis (e.g. punctuation) are removed. Additional modifications (e.g. lowercasing) are applied to uniform the text. Some words wrongly translated (e.g. the Italian word ‘macchina’ translated into ‘car’ instead of ‘machine’) should be manually corrected using Regular Expressions (Van Rossum, Citation2020).
Tokenization. Words composing the text are divided into single units (tokens) that can be used for the analysis. For this task, the Natural Language Toolkit (nltk) (Bird et al., Citation2009) or SpaCy (Honnibal et al., Citation2020) can be used.
Lemmatization and Part of Speech (POS) tagging. SpaCy (Honnibal et al., Citation2020) allows identifying the Part of Speech (e.g. noun, verb, adjective) assumed by a token in a sentence and, following, thanks to lemmatization, converting the token into the root word (e.g. a conjugated verb into its infinitive form or a plural word into the singular word). The use of POS tagging to filter categories of words should be evaluated depending on the results of the analysis.
Stop word removal. All the words that do not contribute to the analysis or could bias the results are removed. Such words are usually the ones very common in the English language with additional ones manually defined depending on the context.
Pre-processing is a recursive phase since it requires to be executed multiple times until the user is satisfied with the results. Moreover, the user should consider that dataset translation, spellchecking, and data cleaning if not well performed might lead to a loss of information. So, it should evaluate from case to case if it is necessary to run these steps.
4.4. Text feature extraction
Feature extraction is required to identify bigrams (i.e. couples of words) and trigrams (i.e. triplets of words) that can be found in the text. It allows establishing thresholds used to filter too frequent (upper threshold) or rare (lower threshold) bigrams and trigrams that may not add much significance to the analysis. As the pre-processing, this phase may be run multiple times until the right thresholds are identified. Term Frequency-Inverse Document Frequency (TF-IDF) vectorization approach (Bafna et al., Citation2016) can be used to filter the text and weigh the importance of tokens, bigrams, and trigrams. At first, by counting how many times a word appears in a document the TF is computed. Then, the Document Frequency is calculated by counting how many documents the same term appears. The IDF is thus calculated through the ratio between the total number of documents under analysis and the number of documents in which the term occurs. By multiplying TF and IDF scores, a value is obtained. The lower the number (i.e. the closer to 0), the more common a term is, and the lower its importance. On the contrary, the higher the number in output, the higher the importance of the term. This process is useful to understand whether a word can provide context or not to a document. As before, a minimum threshold can be established to filter all the text components that have a low weight and, thus, do not significantly contribute to the analysis. Depending on the threshold, some important tokens may be removed. Therefore, multiple values should be evaluated before selecting the optimal one.
4.5. Topic modeling
Being one of the most commonly used methods to execute topic modeling, the Latent Dirichlet Allocation (LDA) algorithm (Blei et al., Citation2003) is selected for this task. In LDA, words are randomly assigned to topics with a certain probability, and their assignment is iterated multiple times until the algorithm identifies the final one. The model requires the provision of the number of topics that the user expects to find in the dataset. The algorithm comes with a multitude of parameters that can be fine-tuned to optimize topic identification.
4.6. Topic evaluation
The topic content must be evaluated before accepting the model and using it for analysis. The evaluation is carried out using both mathematical indexes such as Coherence and Perplexity (Morstatter & Liu, Citation2018), widely used in this kind of analysis, and human supervision of the topic content. Changes in the pre-processing or LDA parameters could change the outcome. Thus, they must be executed recursively until the results are satisfactory.
4.7. Topic modelling applied to the dataset
Once trained, the model is run on the dataset to identify the reports’ content. Each report is assigned to one or more topics with a certain percentage score depending on the content. The higher the percentage, the higher the portion of the document that, according to the model, belongs to the topic. The sum of the percentages is always equal to 100% for each document.
4.8. Analysis of the results
Once assigned the topics, multiple analyses aimed at identifying their distribution (e.g. country, technician, asset model), co-occurrence (e.g. topic A frequently presents with topic C), and other trends (e.g. the frequency of interventions related to topic A increased over the years) are executed.
4.9. Definition of the improvements
The aim is to define improvement actions related to asset and field service maintenance management. For instance, asset components that frequently fail might be redesigned, or preventive interventions might be proposed to reduce specific failures. The idea is to use the results of the analyses to generate new knowledge to be shared and applied in BoL (e.g. design-related problems) and MoL (e.g. improve maintenance execution) by the company to improve the asset and service offering for higher competitiveness.
5. Case study
5.1. Company A
Company A is an Italian manufacturing company that produces bottling and packaging machines that customers can buy as single machines or part of a complete production system. Machines produced by Company A are air molders, fillers, packers, palletizers, and conveyors. The reports contain interventions related to all these products since many machine models sold to customers are created based on a combination of these. Usually, the production process sees a first phase where bottles are warmed to a specific temperature followed by a second one where, once placed in the mold, the air is injected into the bottles to create the desired shape. Once cooled down, the bottles are filled with the required product. Then, they are grouped before being packaged. The conveyor belt is used to move the product (the bottles) along the stations. Sensors are placed on the machine to check the production parameters entered through the machines’ terminals. The company business is historically based on the sale of assets and the provision of on-call maintenance services. Being the market in which the company operates characterized by increasing competitiveness, the company wants to analyze the data for two main reasons:
Understand how to improve the asset design eliminating frequent problems.
Understand how to improve the field service maintenance interventions reducing the time required to identify problems and failure causes, and execution time.
Company A is headquartered in Italy and operates at a global level thanks to several subsidiaries located around the world. There are several technicians available in charge of performing the field service maintenance interventions. Depending on the urgency of the intervention and the availability of near technicians, they are assigned to the request. Later, each technician fills out a maintenance report that is standardized in the structure but has free text fields and allows attaching pictures. Thus, the content and length depend on the technicians, which might provide only pictures, or descriptions of any length, from very short to very long. The lack of analysis of the report content led to a situation in which the knowledge generated during the interventions is frequently not reported nor shared within the company, leading to a loss in terms of improvement opportunities. Moreover, due to the lack of resources, Company A never analyzed the textual reports for improvement, but just for billing purposes. Thus, they were never used to support the business and process transformation that the company is undergoing. To cope with this, Company A decided to analyze the reports using NLP. From the company standpoint, this would allow extracting knowledge without requiring constant effort by the employees while supporting the asset and service improvement plans.
5.2. Data collection and pre-processing for the reports of company A
This section details how the methodology was applied to Company A. For the analysis, a laptop with an 11th Gen Intel(R) Core(TM) i7-1165G7 @ 2.80 GHz CPU and 16 GB of RAM was used.
5.2.1. Dataset collection
Data were originally stored in the company’s database. Seven years of data were extracted as.csv files containing (among others) information like:
Technician_Code
Description_of_Intervention
Machine_Model
Nation_ID
Customer
Request_ID
Start_Date
End_Date
Scheduled_Days
Software_Version
More than 800 intervention reports were extracted from the company database.
5.2.2. Exploratory analysis
While initially 800 reports were downloaded from the Company A database, only 340 remained after the duplicate data removal and content analysis. Their removal was due to the lack of text in the reports, which frequently contained only images, due to the short time technicians had to fill them. As explained by the company, they usually fill out the report before leaving the customer’s place. Thus, they need to do it as fast as possible to return to the headquarters/subsidiary in the established time.
5.2.3. Data pre-processing
Pre-processing was applied to the remaining 340 reports. Italian and Spanish reports were translated into English to uniform the text and allow for the spellchecking task. Despite the risk of losing some information due to this activity, the company agreed on having a uniform dataset for the analysis. Following, data in the report were cleaned through lowercasing (according to the company no major loss of information was expected) and the definition of a customized list of stop words to remove. Regular Expressions were used to fix problems in the text (e.g. substitute word synonyms). POS tagging was used to filter out all the words not categorized as nouns, verbs, numbers, or adjectives. The list of stop words was defined with the support of the company service responsible allowing removing all those words with no useful meaning (e.g. ‘trip’, ‘area’, ‘customer’). The re-execution of the pre-processing phase was subjected to the results of the topic identification. Whenever topics’ indexes and content were not satisfactory (i.e. it was not possible to identify clear separation and/or topics were too much similar) pre-processing was re-executed modifying something. For instance, in the first iteration, the POS tagging was executed but no words category was filtered. Instead, in the following iterations, POS tagging was used to remove words not belonging to the categories of interest. It must be clarified that the decision to re-execute the pre-processing was mainly driven by the topic content, validated with the company experts.
5.2.4. Text feature extraction
With TF-IDF it has been possible to weigh the importance of tokens in the text and filter the non-important ones – i.e. the ones not providing context. A lower TF-IDF threshold of 0,03 was established to remove tokens/bigrams/trigrams. As for the data-preprocessing phase, multiple values for the threshold were evaluated before selecting the optimal one.
5.2.5. Topic modeling and evaluation
The LDA model was run multiple times before finding the optimal results. The authors had to fine-tune the model parameters and evaluate the topic content as well as consider the score achieved by Coherence and Perplexity indexes. As far as the authors’ knowledge is concerned, there is no clear indication in the literature regarding a minimum optimal value for coherence and perplexity, only general indications related to their trend are usually provided (the lower the perplexity, the better and the higher the coherence, the better). Thus, the authors used a satisfactory mix between coherence, perplexity, and topic content as a decisional driver. Specifically, the main driver of decision for the final decision on the topic set was the topic content, agreed with the company. Whenever topics were overlapping too much in their content, the authors, in accordance with the company, decided to change the parameters of the model to fit it better to the input. The final model and set of topics were validated with the company based on the experience of the service experts. Once identified the optimal model, it was run on the dataset to assign each report to the corresponding topic(s). The next section presents the results of the analysis.
6. Analysis
The analysis of the data collected is aimed at understanding more about how Company A delivers field service maintenance to customers in the scope of extracting interesting trends, patterns, and hidden information. This section presents the results achieved by analyzing the dataset and is structured into two sub-sections. First, a descriptive analysis of the dataset is provided. Then, the main results achieved by applying the methodology previously discussed are shown.
6.1. Descriptive analysis
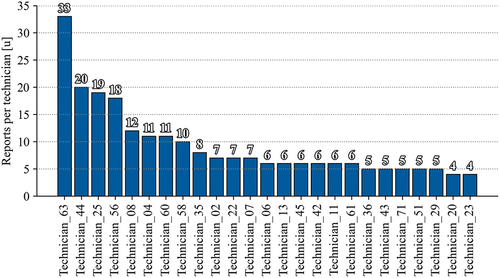
An interesting aspect that emerges from the descriptive analysis is represented by the number of reports filed by each technician. presents the result, showing that few technicians submit useful reports. This low number of reports might be due to the retirement of some technicians, the possibility that some of them have been only recently hired, or the tendency, for some, to only attach pictures to the report. Given the result shown in , from now on, only for the analyses related to the technicians, the top six technicians in terms of interventions will be considered. For all the other analyses, all 340 reports will be considered.
Figure 2. Distribution of interventions per technician.
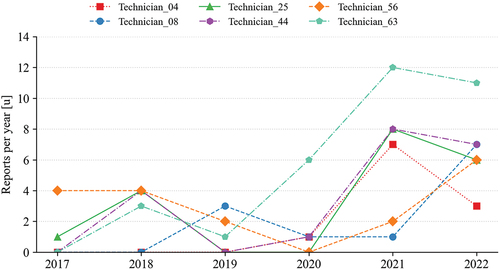
shows an increasing trend in terms of the number of reports filed, a phenomenon that might be linked to the growing interest of the company in collecting data. It must be clarified that covers the years from 2017 to 2022 even though 2022 data are not complete.
Figure 3. Number of reports filled per year by the top six technicians.
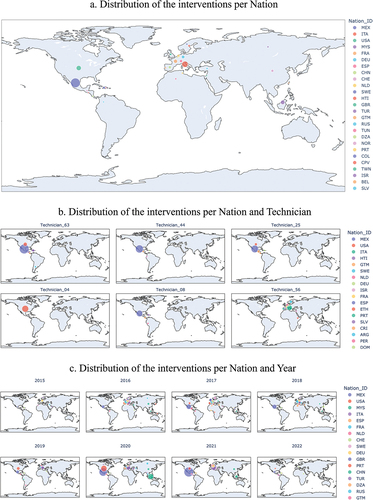
A further descriptive analysis relates to the distribution of the interventions per country and technician, which are useful to show frequent locations for interventions as well as the trend over the years. Most interventions take place in North America and Europe (), and a specific area is assigned to each technician (). shows that, over the years, the number of interventions that took place in the North American region increased, while the European requests remained stable. Such an increase might be due to an increased volume of assets sold in these regions or to environmental and operational factors leading to increased failures and/or problems.
Figure 4. Distribution of interventions per a) nation, b) technician, and c) year.
6.2. Results from NLP analysis
This section deals with the descriptions of the results obtained from the report analysis. The authors identified the optimal number of topics to be equal to 10 based on their content and a discussion with the company, as listed in . Each topic refers to a set of problems related to a component (or group) that may have resulted in failures. For instance, the topic ‘Air_Valve’ refers to a problem with the Air Valve (or related group) installed on the assets or to a failure on that component. From now on, the term ‘problem’ will be used to refer to the content of a topic.
Once trained, the optimal model is saved and used to assign the topic(s) to each report. The model compares the words used to write the report with the topic(s) keywords and, then, assigns probability scores for each topic are assigned. For instance, if a high number of words related to the topic ‘Air_Valve’ is found in a report, the model assigns to that report a high probability of belonging to the topic ‘Air_Valve’. By ordering the scores assigned to each topic, it is possible to define the topics that most characterize each intervention. For Company A, by analyzing the mean scores, it emerges that, usually, the Main Topic (i.e. the topic with the highest probability score) covers 37,5% of the report content, the Second Topic 21,1%, and the Third Topic 15,1%. Thus, on average, the three main topics explain 75% of the intervention reports. Being these mean values, some intervention reports may be characterized by a single topic, while others may touch multiple problems. From now on, only the first three topics will be considered, since they allow to cover a satisfactory part of the reports’ content.
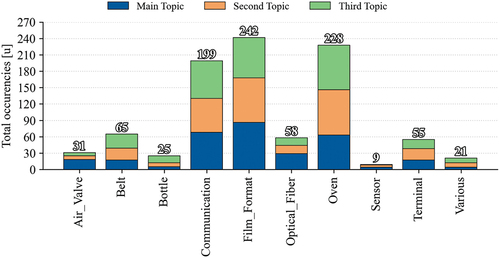
The first analysis that can be done on the results of NLP application, is related to the frequency with which each topic is the main, second, or third topic in an intervention (). What emerges is that the topic Film_Format is the most present, followed by Oven and Communication. Given the high frequency of communication problems, it can be argued that the communication problems Company A finds on its assets are more related to the instrumentation used for the connection than the sensors used to collect data. The low number of the Air_Valve topic is justified by the presence of a reduced number of models that use that component. With this analysis, users can have an overview of the main problems characterizing their assets, and following, choose to analyze specific problems in more detail.
Figure 5. Topics occurrences in the dataset.
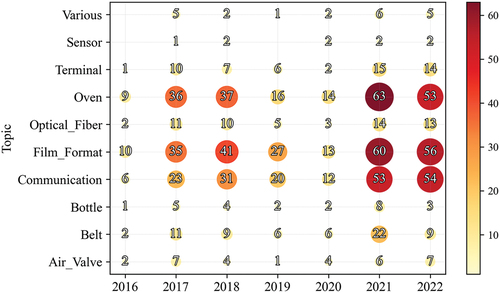
Another aspect worth analyzing is the number of yearly interventions for each problem. This allows for understanding the relative importance of each problem and monitoring its trends. In , the horizontal axis shows the year while the vertical one the topic. For each year/topic combination, a marker, reporting the number of occurrences of that combination, is placed on the chart – the higher the number of occurrences, the bigger the marker. Also, the visualization is helped by the presence of red color in correspondence with more frequent combinations, while yellow characterizes the less frequent ones. As shown, in the case of Company A, the three more frequent topics (i.e. Oven, Film format, and Communication) show an increasing trend. Also, the interventions related to the Belt, the Terminal, and the Optical_Fiber seem to have a similar trend. No trend can be extracted from the perspective of the asset Model under analysis (as it will be shown in the following figures) and topic, and looking at the yearly distribution, they seem to follow the general trend.
Figure 6. Topic trends over the years. The bigger the marker, the higher the number of interventions.
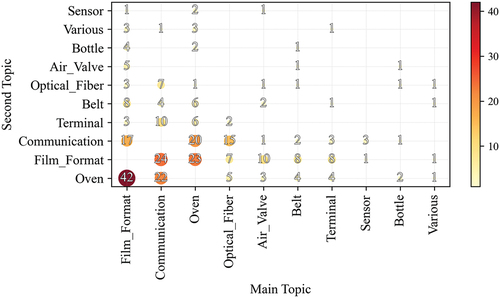
Something useful to know relates to the co-occurrence frequency of the problems (i.e. when two topics are present in the same report). By knowing such information, a company can track and analyze the causes of such co-occurrence, allowing it to define countermeasures or early detecting problems. Such information is useful both in terms of asset and service improvements since, on the one hand, a designer might investigate if the problematic behavior of a component leading to a failure might also lead to another problem. Similarly, on the service side, this kind of analysis might help define additional checks required with an intervention, allowing to detect and/or prevent failures of correlated components. Consequently, deals with the co-occurrence of topics (i.e. when two topics are present in the same report), showing how, coherently with , Film_Format and Oven are the most frequent and the ones that co-occur with the highest frequency (as Main or Second Topic). This also makes sense considering the topics’ content since the bottles’ format and quality are subject to the way the oven heats the bottles.
Figure 7. Topic co-occurrence.
One of the problems that companies offering field maintenance services frequently face is resource availability. considers the co-occurrence between the technician and the topic (being it either main, second, or third). In terms of interventions’ variety, as depicted in , Technician_25, Technician_44, Technician_56, and Technician_63 are the ones with the lower variety. While Technician_25, Technician_44, Technician_56, and Technician_63 seem to be focused on Film_Format, Communication, and Oven topics, the interventions of Tehcnician_08 and Technician_04 seem to be more distributed, despite the lower number of interventions.
Figure 8. a) co-occurrence between topic and technician and b) distribution of topics among the four models with more interventions.
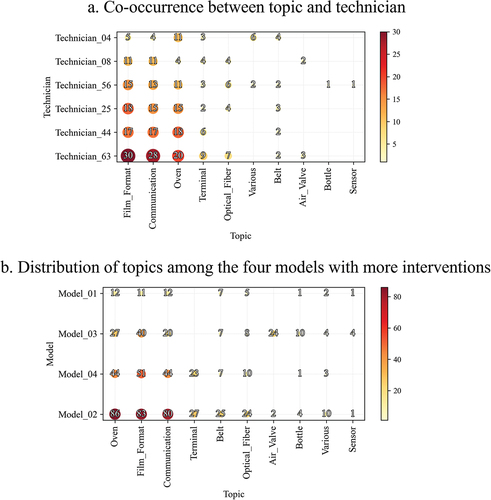
shows what are the topics most frequently associated with certain models. In the figure, only four models are considered since they allow to cover 76% of the total dataset. The remaining is distributed among many models, thus not allowing the extraction of useful aggregated information. What emerges from is that Model_03 and the Air_Valve topic are strictly connected, since almost all the Air_Valve problems are present on Model_03. Interestingly, Model_03 seems also to be the one with the most problems related to the Bottle topics, which may allow assuming Air_Valve and Bottle problems are correlated. This assumption has also been supported by the discussion with the company, which confirmed the nature of the problem and the relation between the two aspects. Similarly, Terminal problems relate only to Model_02 and Model_04, which are the asset Models that present higher reports. As for the case of the cross-analysis between the technician and the topic, also the cross-analysis of the asset model and the problem can constitute a noteworthy source of information. Specifically, from the data available, companies can derive important hints on the fact that some failures are only related to specific models or spread across all of them. Confirmation of the link between the model and problem type arose from the discussion with the company, which confirmed that only Model_03 has the Air_Valve component.
7. Improvement actions
The paper aims to investigate the use of NLP to discover knowledge from field service maintenance reports to be used in the more general context of a PSS improvement process. By analyzing the literature (Ansari, Citation2020; Arif-Uz-Zaman et al., Citation2017; Gunay et al., Citation2019; Khare & Chougule, Citation2012; Schwenke et al., Citation2011), four main improvement categories were identified: asset, field service maintenance delivery, technician skills, and new service offering; additional ones might be added considering a different level of detail or based on specific necessities. shows the improvements for Company A. The resulting information can be considered as a first step to introduce improvements at the asset level, in terms of design (e.g. redesign specific components to make them less prone to failure, study the failure cause to optimize the way the components work and reduce the risk of unexpected failure) and operational use (e.g. study the operational conditions that led to the failure), at field service maintenance delivery level (e.g. define control checklist based on the intervention request to check components that frequently fail together to prevent future failures), at technicians skills level (e.g. define competence improvement paths based on the history of the intervention), and new service offering level (e.g. define new service offerings tailored on the customer’s failure history). Introducing such improvements in the PSS offering would allow the creation of more reliable PSS offerings, tailored to the necessities of specific customers (e.g. customized maintenance plans based on operational usage and/or spare parts dimensioning). Also, PSS is commonly associated with topics related to the TBL in terms of economic, environmental, and social sustainability. The reuse of the knowledge generated through this analysis could contribute to reducing the number of spare parts used during interventions because of the prolonged useful life of the components, optimizing the costs associated with the use of the asset (e.g. energy costs, material costs) and the delivery of field service maintenance (e.g. travel costs, reduced execution time, precise resolution workflow and checklist) addressing the economic and environmental perspectives. From the social perspective instead, it could contribute to optimizing the technicians’ workload (e.g. less frequent emergency travels). This requires defining a proper knowledge management plan.
Table 2. Topic content.
8. Discussion
Although the results discussed in section 7 are specific to Company A, further insights could be gained considering existing literature on PSS improvement and maintenance knowledge collection and extraction. By generalizing the results, it may be possible to identify additional areas for improvement.
Considering the data collection and analysis process described, it is easy to make a comparison with the Data-Information-Knowledge-Wisdom (DIKW) pyramid (Rowley, Citation2007). Once transcribed in the reports, data collected from the technicians became information that, through the NLP analysis, can be transformed into knowledge when used to improve the execution of field service maintenance, or wisdom, when generalized and used to support the redesign of old PSS or the design of new ones. From an asset perspective, the analysis of the field service maintenance reports would overcome the lack of information sharing among company departments and stakeholders (Sala et al., Citation2021) and allow designers to have structured feedback on the main failures occurring during the MoL and their causes (Gunay et al., Citation2019; Kimita et al., Citation2018). This would allow them to improve their product behavior knowledge and help them define whether some components must be redesigned to address recurring issues or whether new functionalities are needed to fulfill specific customer requirements (Sassanelli et al., Citation2018). provides a list of general improvements (derived from the analysis of available data, case studies, and research found in the literature) that might be extracted from an analysis of field service maintenance reports. As highlighted in the literature (Ansari, Citation2020; Arif-Uz-Zaman et al., Citation2017; Gunay et al., Citation2019; Khare & Chougule, Citation2012; Schwenke et al., Citation2011), the knowledge extracted from the field service reports might be used to address problems in various areas of the PSS offering, being connected to the asset, service, or resources involved.
Table 4. Additional general improvements achievable through field data analysis.
Table 3. Improvements were achieved following the NLP analysis for the case of company A.
By analyzing the reports, it would be possible to define or update time-based maintenance by comparing actual and expected failure frequencies. For instance, if maintenance interventions on a component are executed more frequently than planned, the original maintenance policy’s established timeframe might require updating. Similarly, additional maintenance-related improvements could be identified. Moreover, the co-occurrence of problems in multiple components might be studied to understand if there is causality or not behind the phenomena. It may happen that the misbehavior of a component lead to the failure of another one. Countermeasures in terms of re-design, operational indications, and specific periodic checks might be studied, leading to fewer failures and increased useful life.
From the service perspective, multiple benefits can be envisaged. Firstly, the service managers would be able to monitor their technicians’ performance and understand if there are some skill gaps. Then, field service maintenance technicians can achieve useful knowledge related to how to diagnose failures and conduct interventions, leading to improved efficiency and effectiveness of the service interventions.
Also, new possible service offerings could be defined, such as selling training tailored to frequent failure typologies, or the periodic provision of specific spare parts based on the analysis of real consumption.
In general, the NLP-based classification of the maintenance reports could be used to improve the indexing inside companies’ IT systems (e.g. Computerized Maintenance Management Systems – CMMS) (Arena et al., Citation2022; Hong et al., Citation2022) and, in this way, allow for better analysis and decision-making related to problems’ resolution and the PSS offering.
9. Conclusions
As discussed by various researchers, collecting, and transforming data generated during the MoL in reusable knowledge is fundamental to defining reliable and efficient PSS improvement plans. Unfortunately, this is not always happening. Many times, data collected, despite being potentially resourceful to improve the company processes, are not analyzed for different reasons (e.g. lack of time or resources to process or share them). The paper aimed to answer the following research question:
How can PSS offerings be improved based on the knowledge extracted from field service maintenance reports?
In doing so, a case study was conducted in a manufacturing company. NLP was used to extract knowledge from field service maintenance reports to be exploited to improve the PSS offering. Despite the recursive approach required to fine-tune the NLP algorithm, once created this can contribute to ease the way field service maintenance reports are analyzed, allowing to cluster them according to the failure typology and providing the base for deeper analyses. Also, results showed that the knowledge extracted is not only useful to address field service maintenance problems, but can be used to support asset design, asset management, service design, service management, maintenance, technician management, and other aspects. Insights and knowledge could be translated into the redesign of components, variations in the frequency for programmed field service maintenance, identification of technicians’ specializations, offering specific services to customers based on their most frequent problems, and others. Also, using this knowledge, Company A aims to define a troubleshooting procedure for problem identification and resolution.
From a theoretical standpoint, the NLP approach is useful for knowledge extraction and should be considered by researchers and practitioners as a means to introduce their methodology for analysis and PSS improvement. From a practical perspective, new applications of NLP should be tested to extract additional knowledge from different datasets (e.g. from design reports and feedback) to better feed the PSS improvement process.
In the future, in the case of Company A, more detailed analyses might be run using a higher detail for the topic definition to better cluster failures and topics. As far as the initial dataset is concerned, this could be widened including handwritten reports, not considered initially due to the necessity to convert them into electronic format. To do so, handwriting recognition approaches might be used, even though this would require the identification of a Machine Learning model previously trained also on technical maintenance terminology. Moreover, another layer of analysis could be added in the future by teaching the model how to recognize sentences reporting the problem identified, the cause of the problem, and the solution adopted. By doing so, more granular analyses could be executed, and the value generated by adopting such an approach would increase, providing specific directions for resolving asset and field service maintenance-related problems.
The main limitations of the current research reside in the necessity, for LDA-based analysis, to input the number of topics, which may lead to bias or wrong results, especially when there is only a limited knowledge of the dataset content. Other approaches (e.g. BERT-based) might be more efficient by automatically proposing the number of topics in output. The necessity of translating the reports to uniform the language and improve the analysis might have affected the content of some reports, even though a manual fix has been carried out using regular expressions. The adoption of multilanguage models might help address this issue, even though it must be considered that maintenance reports are based on technical language, and this might limit the efficiency of such models. Another approach that might be tested is a rule-based one, where specific keywords can be searched in the text to label documents, even though a method to identify main topics should be defined. In other words, researchers used Recurrent Neural Networks, Convolutional Neural Networks, Support Vector Machine, and Multi-Layered Perceptron approaches for text classification purposes. The authors decided to focus on the use of LDA as one of the most used approaches. However, in the future, the above-mentioned approaches should be investigated to evaluate their performance against the LDA approach.
In future research, additional aspects and applications of NLP should be investigated to verify its usefulness in supporting other aspects of the PSS offering (e.g. use of chatbots to support information retrieval for customers or technicians and improve service delivery, identification of new ideas for service design based on customer feedback). From Company A’s perspective, the results of the analysis could also be used to improve the reporting by creating two different fields to write the problem and the following resolution. This would help in the clustering of the problems and strengthen the extraction of indications for their resolution. The application of the approach in a full case study, describing more in detail the effect on each phase of the PSS lifecycle would be helpful to highlight the specific contribution that such an approach can have on the PSS context.
Nomenclature
| BoL | = | Beginning-of-Life |
| DIKW | = | Data-Information-Knowledge-Wisdom |
| EoL | = | End-of-Life |
| LDA | = | Latent Dirichlet Allocation |
| MoL | = | Middle-of-Life |
| NLP | = | Natural Language Processing |
| nltk | = | Natural Language Toolkit |
| POS | = | Part-of-Speech |
| PSS | = | Product Service System |
| TBL | = | Triple Bottom Line |
| TF-IDF | = | Term Frequency Inverse Document Frequency |
Acknowledgments
This paper was supported by the project National Recovery and Resilience Plan (NRRP), Mission 4 Component 2 Investment 1.3 – Call for tender No. 341 of 15/03/2022 of Italian Ministry of University and Research funded by the European Union (NextGenerationEU), Award Number PE00000004, Concession Decree No. 1551 of 11/10/2022 adopted by the Italian Ministry of University and Research, CUP F13C22001230001 MICS (Made in Italy - Circular and Sustainable).
Disclosure statement
No potential conflict of interest was reported by the author(s).
Additional information
Funding
References
- Ali, M. M., Doumbouya, M. B., Louge, T., Rai, R., & Karray, M. H. (2020). Ontology-based approach to extract product’s design features from online customers’ reviews. Computers in Industry, 116, 103175. https://doi.org/10.1016/j.compind.2019.103175
- Ansari, F. (2020). Cost-based text understanding to improve maintenance knowledge intelligence in manufacturing enterprises. Computers & Industrial Engineering, 141, 106319. https://doi.org/10.1016/j.cie.2020.106319
- Arena, S., Manca, G., Murru, S., Orrù, P. F., Perna, R., & Reforgiato Recupero, D. (2022). Data Science application for failure data management and failure prediction in the oil and gas Industry: A case study. Applied Sciences, 12(20), 10617. https://doi.org/10.3390/app122010617
- Arif-Uz-Zaman, K., Cholette, M. E., Ma, L., & Karim, A. (2017). Extracting failure time data from industrial maintenance records using text mining. Advanced Engineering Informatics, 33, 388–25. https://doi.org/10.1016/j.aei.2016.11.004
- Bafna, P., Pramod, D., & Vaidya, A. (2016). Document clustering: TF-IDF approach. 2016 International Conference on Electrical, Electronics, and Optimization Techniques (ICEEOT), 61–66. https://doi.org/10.1109/ICEEOT.2016.7754750
- Bhardwaj, A. S., Deep, A., Veeramani, D., & Zhou, S. (2022). A custom word embedding model for clustering of maintenance records. IEEE Transactions on Industrial Informatics, 18(2), 816–826. https://doi.org/10.1109/TII.2021.3079521
- Bird, S., Klein, E., & Loper, E. (2009). Natural language processing with Python: Analyzing text with the natural language toolkit. O’Reilly Media, Inc.
- Blei, D. M., Ng, A. Y., & Jordan, M. I. (2003). Latent dirichlet allocation. Journal of Machine Learning Research, 3, 993–1022.
- Bouabdallaoui, Y., Lafhaj, Z., Yim, P., Ducoulombier, L., & Bennadji, B. (2020). Natural language processing model for managing maintenance requests in buildings. Buildings, 10(9), 160. https://doi.org/10.3390/buildings10090160
- Brundage, M. P., Sexton, T., Hodkiewicz, M., Dima, A., & Lukens, S. (2021). Technical language processing: Unlocking maintenance knowledge. Manufacturing Letters, 27, 42–46. https://doi.org/10.1016/j.mfglet.2020.11.001
- Chen, K.-L., & Tsai, M.-H. (2021). Conversation‐based information delivery method for facility management. Sensors, 21(14). Scopus. https://doi.org/10.3390/s21144771.
- Coleman, C., Damodaran, S., & Deuel, E. (2022). Predictive Maintenance and the Smart Factory. Deloitte. https://www2.deloitte.com/us/en/pages/operations/articles/predictive-maintenance-and-the-smart-factory.html
- Franciosi, C., Voisin, A., Miranda, S., Riemma, S., & Iung, B. (2020). Measuring maintenance impacts on sustainability of manufacturing industries: From a systematic literature review to a framework proposal. Journal of Cleaner Production, 260, 121065. https://doi.org/10.1016/j.jclepro.2020.121065
- Gunay, H. B., Shen, W., & Yang, C. (2019). Text-mining building maintenance work orders for component fault frequency. Building Research & Information, 47(5), 518–533. https://doi.org/10.1080/09613218.2018.1459004
- Gupta, S., & Gupta, S. K. (2021). An approach to generate the bug report summaries using two-level feature extraction. Expert Systems with Applications, 176, 114816. https://doi.org/10.1016/j.eswa.2021.114816
- Hong, S., Kim, J., & Yang, E. (2022). Automated text classification of maintenance data of higher education buildings using text mining and machine learning techniques. Journal of Architectural Engineering, 28(1), 04021045. https://doi.org/10.1061/(ASCE)AE.1943-5568.0000522
- Honnibal, M., Montani, I., Van Landeghem, S., & Boyd, A. (2020). spaCy: Industrial-Strength Natural Language Processing in Python. Zenodo. https://doi.org/10.5281/zenodo.1212303
- Khare, V. R., & Chougule, R. (2012). Decision support for improved service effectiveness using domain aware text mining. Knowledge-Based Systems, 33, 29–40. https://doi.org/10.1016/j.knosys.2012.03.005
- Kimita, K., Sakao, T., & Shimomura, Y. (2018). A failure analysis method for designing highly reliable product-service systems. Research in Engineering Design, 29(2), 143–160. https://doi.org/10.1007/s00163-017-0261-8
- Loria, S. (2018). Textblob documentation. Release 0.15, 2. https://textblob.readthedocs.io/en/dev/index.html
- Macchi, M., Roda, I., Negri, E., & Fumagalli, L. (2018). Exploring the role of digital twin for asset lifecycle management. IFAC-Papersonline, 51(11), 790–795. https://doi.org/10.1016/j.ifacol.2018.08.415
- Machchhar, R. J., Toller, C. N. K., Bertoni, A., & Bertoni, M. (2022). Data-driven value creation in smart product-service System design: State-of-the-art and research directions. Computers in Industry, 137, 103606. https://doi.org/10.1016/j.compind.2022.103606
- Mateus, B. C., Mendes, M., Torres Farinha, J., Marques Cardoso, A., Assis, R., & Soltanali, H. (2023). Improved GRU prediction of paper pulp press variables using different pre-processing methods. Production and Manufacturing Research, 11(1), 2155263. https://doi.org/10.1080/21693277.2022.2155263
- Medini, K., & Boucher, X. (2019). Specifying a modelling language for PSS Engineering – a development method and an operational tool. Computers in Industry, 108, 89–103. https://doi.org/10.1016/j.compind.2019.02.014
- Morstatter, F., & Liu, H. (2018). In search of coherence and consensus: Measuring the interpretability of statistical topics. Journal of Machine Learning Research, 18(169), 1–32.
- Mostafa, S., Lee, S.-H., Dumrak, J., Chileshe, N., & Soltan, H. (2015). Lean thinking for a maintenance process. Production and Manufacturing Research, 3(1), 236–272. https://doi.org/10.1080/21693277.2015.1074124
- Mourtzis, D. (2020). Simulation in the design and operation of manufacturing systems: State of the art and new trends. International Journal of Production Research, 58(7), 1927–1949. https://doi.org/10.1080/00207543.2019.1636321
- Mourtzis, D. (2021). Design and operation of production networks for mass personalization in the era of cloud technology. Elsevier.
- Mourtzis, D., Boli, N., & Fotia, S. (2017). Knowledge-based estimation of maintenance time for complex engineered-to-order products based on KPIs monitoring: A PSS approach. Procedia CIRP, 63, 236–241. https://doi.org/10.1016/j.procir.2017.03.317
- Mourtzis, D., Fotia, S., Gamito, M., Neves-Silva, R., Correia, A. T., Spindler, P., Pezzotta, G., & Rossi, M. (2016). PSS design considering feedback from the entire product-service lifecycle and social media. Procedia CIRP, 47, 156–161. https://doi.org/10.1016/j.procir.2016.03.092
- Mourtzis, D., Papatheodorou, A.-M., & Fotia, S. (2018). Development of a key performance indicator assessment methodology and software tool for product-service System evaluation and decision-making support. Journal of Computing and Information Science in Engineering, 18(4). https://doi.org/10.1115/1.4040340
- Naqvi, S. M. R., Ghufran, M., Meraghni, S., Varnier, C., Nicod, J.-M., & Zerhouni, N. (2022). Cbr-based decision support system for maintenance text using nlp for an aviation case study. 2022 Prognostics and Health Management Conference (PHM-2022 London), London, United Kingdom (pp. 344–349).
- Rowley, J. (2007). The wisdom hierarchy: Representations of the DIKW hierarchy. Journal of Information Science, 33(2), 163–180. https://doi.org/10.1177/0165551506070706
- Sala, R., Bertoni, M., Pirola, F., & Pezzotta, G. (2021). Data-based decision-making in maintenance service delivery: The D3M framework. Journal of Manufacturing Technology Management, 32(9), 122–141. https://doi.org/10.1108/JMTM-08-2020-0301
- Samoili, S., Cobo, M. L., Gomez, E., De Prato, G., Martinez-Plumed, F., & Delipetrev, B. (2020). AI watch. Defining artificial intelligence. Towards an operational definition and taxonomy of artificial intelligence. Technical Report EUR 30117 EN. Publications Office of the European Union, JRC118163. https://doi.org/10.2760/382730
- Sassanelli, C., Pezzotta, G., Pirola, F., Sala, R., Margarito, A., Lazoi, M., Corallo, A., Rossi, M., & Terzi, S. (2018). Using design rules to guide the PSS design in an engineering platform based on the product service lifecycle management paradigm. International Journal of Product Lifecycle Management, 11(2), 91–114. https://doi.org/10.1504/IJPLM.2018.092826
- Schwenke, C., Vasyutynskyy, V., Röder, A., & Kabitzsch, K. (2011). Analysis of maintenance histories of industrial equipment with frequent maintenance demand. 2011 9th IEEE International Conference on Industrial Informatics, 299–304. https://doi.org/10.1109/INDIN.2011.6034892
- Sénéchal, O. (2017). Research directions for integrating the triple bottom line in maintenance dashboards. Journal of Cleaner Production, 142, 331–342. https://doi.org/10.1016/j.jclepro.2016.07.132
- Sexton, T., & Fuge, M. (2019). Using semantic fluency models improves network reconstruction accuracy of tacit Engineering knowledge. International Design Engineering Technical Conferences and Computers and Information in Engineering Conference, Anaheim, CA (pp. V02AT03A051).
- Subramaniyan, M., Skoogh, A., Salomonsson, H., Bangalore, P., Gopalakrishnan, M., & Sheikh Muhammad, A. (2018). Data-driven algorithm for throughput bottleneck analysis of production systems. Production and Manufacturing Research, 6(1), 225–246. https://doi.org/10.1080/21693277.2018.1496491
- Usuga Cadavid, J. P., Grabot, B., Lamouri, S., Pellerin, R., & Fortin, A. (2020). Valuing free-form text data from maintenance logs through transfer learning with CamemBERT. Enterprise Information Systems, 16(6), 1–29. https://doi.org/10.1080/17517575.2020.1790043
- Van Rossum, G. (2020). The Python library reference, release 3.8.2. Python Software Foundation.
- Wallin, J., Parida, V., & Isaksson, O. (2015). Understanding product-service system innovation capabilities development for manufacturing companies. Journal of Manufacturing Technology Management, 26(5), 763–787. https://doi.org/10.1108/JMTM-05-2013-0055
- Wiesner, S., Freitag, M., Westphal, I., & Thoben, K.-D. (2015). Interactions between service and product lifecycle management. Procedia CIRP, 30, 36–41. https://doi.org/10.1016/j.procir.2015.02.018
- Zoll, M., Jäck, D., & Vogt, M. W. (2018). Evaluation of predictive-maintenance-as-a-service business models in the internet of things. 2018 IEEE International Conference on Engineering, Technology and Innovation (ICE/ITMC), 1–9. https://doi.org/10.1109/ICE.2018.8436272