
ABSTRACT
For evaluation of industrial augmented and virtual reality (AR/VR) applications, a comprehensive knowledge of their impact on productivity, process metrics, and human factors is critical to facilitate the transition from lab-scale research to industrial settings. While laboratory-scale evaluations have been extensively researched, successful implementation in industrial settings has fallen short. This paper presents a multi-criteria evaluation model using a mixed methods approach to study thirteen industrial use cases of AR/VR applications in manufacturing over two years. Semi-structured interviews were conducted with companies about the impact of the application. A human factors questionnaire was completed by 69 participants, including in-house users, industry experts, and inexperienced novices. The results of the use cases show an average reduction of 23.61% in process and 25% in cycle time. Process quality indicators improved significantly compared to baseline. The evaluation found no significant differences in workload and ease of use between age groups.
1. Introduction
Augmented and virtual reality (AR/VR) technology is still on the edge of making it into widespread industrial applications, and industrial implementation is still lagging behind expectations. The actual usage of AR/VR applications in manufacturing has been rising during the last years due to improved technology (Aschenbrenner et al., Citation2019), although industrial applications are mainly still in a prototype stage, and most AR/VR studies are carried out in lab settings (Bottani & Vignali, Citation2019; Pringle et al., Citation2019). Therefore, comparable and comprehensive knowledge about the impact of applications on productivity, process metrics, and human factors is needed to catalyze the transfer from lab-scale research into manufacturing. Especially easy-to-use evaluation schemes applied in an industrial environment and tested with workers in their direct workspace are needed that consider the impact of AR/VR applications on the socio-technical system characteristics of manufacturing, hence allowing companies to assess the potential of the technologies. It is crucial for industrial companies, which are often lacking workers having expert knowledge in the field of AR/VR, that these technologies are easy to use (comparable to the plug-and-play usage of modern hardware devices) and provide tutorials for first time users of AR/VR applications (Gattullo et al., Citation2020).
This paper uses a multi-criteria evaluation framework to assess thirteen manufacturing use cases for AR/VR with 69 participants, covering operators in manufacturing companies, industry experts, and students. A previous review (Zigart & Schlund, Citation2020) has identified multi-perspective criteria for evaluating AR technologies in manufacturing, focusing on including workers. Our study contributes to the existing body of knowledge by (1) assessing AR/VR technologies in multiple industrial use cases in companies and (2) using a holistic model that covers a well-balanced set of criteria regarding economic and human factors and facets of technology application. (3) The study relies on mixed methods of evaluation, and (4) collects data from business stakeholders, potential users, and independent testers (novices). The human factors are based on the human factors and ergonomics (HF/E) research (Kadir et al., Citation2019). The research took place within the context of a collective research project, ‘Mixed Reality-Based Collaboration for Industry’ (MRBC4I) and bridges the gap from lab scale to industrial evaluation and thus contributes to the adaption and acceptance of AR/VR (Moser et al., Citation2019).After a discussion of the state-of-the-art multi-criteria evaluation of AR/VR in manufacturing applications in section 2, the methodology of the evaluation model is discussed in section 3. A quantitative multi-criteria evaluation was done and additionally, qualitative semi-structured interviews were conducted to receive detailed information of the industrial perspective. Section 4 shows the evaluated use cases and the results of our evaluation. Finally, section 6 summarizes our findings, shows limitations and gives an outlook on future research.
2. State of the art
For an industrial evaluation of AR/VR use cases, it is necessary to measure criteria from the company and user perspective to determine the main points in user research, such as productivity, quality, user acceptance, usability, and workload. This section considers publications with industrial AR/VR evaluation models and use cases. Augmented Reality (AR), Virtual Reality (VR), and Mixed Reality (MR) have gained widespread attention in recent years. AR overlays digital content onto the real world, VR completely immerses the user in a digital environment, and MR combines elements of both AR and VR to create a hybrid reality. AR/VR/MR are used for various applications, including education, training, entertainment, and manufacturing. AR/VR in manufacturing opens up new ways of providing information for employees, e.g. instructions or virtual assembly training (Azuma, Citation1997).
Häfner et al. (Citation2013) describe a course in VR for engineering students. VR is also used in civil engineering (Sampaio, Citation2010), medicine (Riener & Harders, Citation2012), manufacturing (Schumann et al., Citation2011), construction (Roßmann, Citation2011) or the aerospace industry education (Roßmann, Citation2011; Stone et al., Citation2011) and everywhere where spatial imagination is required. Ras et al. (Citation2017) suggest AR-based assistance systems, such as the AR construction training platform by Wang and Dunston (Citation2007), to close skill gaps. Furthermore, areas of application such as manufacturing (Vacchetti et al., Citation2004), maintenance (Arendarski et al., Citation2008), and laboratories (Akçayır et al., Citation2016), safety training (Li et al., Citation2018) are documented in the literature (Bacca et al., Citation2014; Sırakaya & Alsancak Sırakaya, Citation2018).
Similar to VR, the actual usage of AR applications in manufacturing has been rising during the last years due to improved technology (Aschenbrenner et al., Citation2019), although industrial applications are mainly still in the prototype stage (Danielsson et al., Citation2023), and most AR studies are carried out in lab settings (Bottani & Vignali, Citation2019; Pringle et al., Citation2019). shows the distribution of industrial AR applications per segment and industrial AR studies’ industrial applicability between 2012 and 2018 (de Souza Cardoso et al., Citation2020).
Figure 1. (a) distribution of industrial AR applications per industrial segments (b) distribution of the industrial applicability of the primary industrial AR studies (de Souza Cardoso et al., Citation2020).
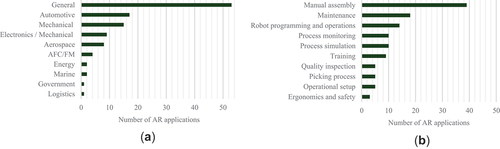
The reasons for the usage of AR vary significantly across industries and tasks. The aims of companies for using AR are reducing execution time (32%), improving quality (26%), increasing learnability (22%), increasing operational safety and users’ health (9%), facilitating decision-making (7%), and improving production flexibility (4%). While the challenges are mainly technical, users’ health and acceptance still present obstacles. The used devices for AR applications are HMDs (40%), monitors (24%), tablets (23%), projectors (8%), and smartphones (5%) (de Souza Cardoso et al., Citation2020).
In previous research, a review shows that AR applications in the industry are hardly evaluated with a balanced set of criteria. In the median, only two criteria are evaluated (Zigart & Schlund, Citation2020). The target group of industrial AR applications is mainly operators in production or assembly. compares the number of participants and the criteria evaluated in forty-two papers, in which twenty-nine have stated the evaluation method and the number of participants. Only two studies (Aschenbrenner et al., Citation2019; Fast-Berglund et al., Citation2018) reported more than hundred participants with students or volunteers without prior experience. Two studies were found with more than fifty participants, which were executed with employees of a company (Rapaccini et al., Citation2014; Terhoeven et al., Citation2018) using one or two evaluation criteria. The evaluation of more criteria gives holistic evaluation results from different perspectives. To ensure the use of AR/VR applications in industry beyond the prototype stage, a multi-criteria evaluation helps to consider the important influences. There is a gap in including workers within their known work environment in the evaluation of AR/VR.
Figure 2. Comparison of the number of criteria evaluated and number of participants in the user study, based on 29 studies.
Dey et al. (Citation2018) reviewed AR usability studies from 2005 to 2014 and showed that most studies were conducted with young participants, primarily university students. 62% of the studies used participants with a mean age of fewer than thirty years, and 36% were female participants. They found that acceptance differs between ages (Dey et al., Citation2018). Aschenbrenner et al. (Citation2019) reported a lack of knowledge between students and employees regarding valid evaluation results of AR applications in the industry. A study about spatial augmented reality found a difference between operators and students in task time, quality, user acceptance, workload, and usability (Zigart & Schlund, Citation2022). Lovasz-Bukvova et al. (Citation2021) also report significant differences in usability and workload between students and workers in AR and VR applications. Danielsson et al. (Citation2018), Kosch et al. (Citation2016), and Kim et al. (Citation2019) combine qualitative and quantitative methods, e.g. assess the impact of an assistive system on production parameters, such as time to produce a part, errors made, or perceived workload, or doing observation during the task performed, and interviews after completing the task. Chan et al. (Citation2022) provide an experimental evaluation of AR for a human robot collaboration. They evaluated objective, like the task completion time, and subjective criteria (e.g. task load with NASA-TLX, usability with SUS, and user experience with UEQ). Pringle et al. (Citation2019) claim that it is hard to compare lab studies with a toy, like ‘Lego’, with real-world applications like the assembly of an airplane wing. There are some real industry studies, but often the HMDs used are customized prototypes not commercially available (Pringle et al., Citation2019). Danielsson et al. (Citation2023) published a quick evaluation tool for AR smart glasses as assembly support which should help planners to decide if an implementation will be worth the investment cost in a certain production process. Ho et al. (Citation2022) did an extensive systematic literature research and show two main categories, effectiveness and usability evaluation, for evaluating the quality of AR use case with a holistic approach. The effectiveness evaluation includes for example completion time, number of errors, productivity performance, or other key performance indicators. The usability evaluation focuses on user experience via questionnaires, interviews, expert evaluations, and field studies.
Mark et al. (Citation2022) describe the following user groups for assistance systems in real-world industrial settings: Elderly, unskilled workers, inexperienced and flexible workers, a worker with safety or health risk, physically or mentally disabled workers, and migrant workers. The question arises, what are the effects on the qualification of systems whose core purpose is to assist and not to learn? Can the requirements for employees be lowered and less qualified employees be recruited because the systems support them so well? The publications in the VR area primarily relate to evaluating VR training scenarios but not to their impact on qualification. They look at evaluated individual use cases, not intending to develop an evaluation model. Empirical results on the influence of AR/VR systems on the qualification of employees are not often found in the literature. Some authors (Quandt et al., Citation2017; Quint et al., Citation2016; Webel et al., Citation2011) describe AR/VR-based frameworks in learning environments without focusing on qualifications. Khokhlovskiy et al. (Citation2019) and Byvaltsev (Citation2020) theorize that with the introduction of AR systems, less qualified people can do the work without the requirements needed. Gavish et al. (Citation2015) showed that AR/VR-based training improved their skills in the trained task, but it took significantly longer than the groups trained per video tutorial. Funk et al. (Citation2017) show that inexperienced workers benefit from AR and learn faster with fewer mistakes, but experienced employees are hindered. The review by Mark et al. (Citation2019) concludes that AR/VR is more suitable for flexible workers who often switch between different types of tasks.
Hirsch-Kreinsen et al. (Citation2019) focus on the impact of qualification through digital technologies in general. Hirsch-Kreinsen et al. (Citation2019) describe the effects on qualification scenarios in Industry 4.0 and distinguish three development scenarios: automation, polarization, and upgrading. AR technology is mainly linked to the upgrading scenario supporting cooperation potentials between employees with different qualifications and the digital automation of simple activities using AR. They conclude that significantly higher qualified groups of workers benefit by being able to take on new, more complex tasks. Mark et al. (Citation2019) focus specifically on assistance systems, including AR/VR, and evaluate them from the perspective of the user and the extent to which their deficits (e.g. disabilities) can be compensated or neutralized through the use of assistance technology.
Hoedt et al. (Citation2016) provide an evaluation framework for comparing VR applications for training and education. They distinguish between objective and subjective evaluation: the objective evaluation assesses cycle time and error rate, and the subjective evaluation usability (Hoedt et al., Citation2016). Zhou et al. (Citation2018) developed and evaluated a learning model that benefits from human-computer interaction and pedagogical aspects. The model considers the effects of various factors, including pedagogical contexts, VR roles and scenarios, and output specifications, combined to influence the design and realize VR training applications (Zhou et al., Citation2018).
The state-of-the-art analysis shows that larger evaluations rely on participants with student or volunteering background, whereas shopfloor workers are hardly present beyond individual use case evaluations. Furthermore, the evaluation schemes mostly were limited, to a maximum of five criteria, in median two. To receive a holistic evaluation result from different perspectives, a multi-criteria evaluation helps to show the relevant aspects for the implementation of AR/VR use cases in industry. Kosch et al. (Citation2016) emphasise the need for a standardized evaluation model, a claim the authors support and extend towards a well-balanced set of criteria regarding economic and human factors.
3. Methodology of the evaluation model
Based on the literature research, the methodology for a multi-criteria evaluation and the research design are described. The evaluation dimensions, ‘process’, ‘learning & development’, and ‘user’, and the criteria are explained.
3.1. Research design
The literature research shows that many user studies are conducted with only campus recruits, but e.g. Aschenbrenner et al. (Citation2019) show the importance of involving real workers in the field to get meaningful results, because of a lack of knowledge between students and employees regarding valid evaluation results of AR applications in the industry. In our research, we studied thirteen manufacturing AR/VR use cases developed as a part of the project MRBC4I (Moser et al., Citation2019) (see for an overview of the use cases) and evaluated using a multi-criteria evaluation model based on a previous review (Moser et al., Citation2020; Zigart, Citation2022) (see section 3.2). Thirty-six participants tested the AR use cases (ten users in the companies, twenty-six novices), and thirty-three participants the VR use case (twelve users in the company, twenty-one novices). The test consisted of participants performing the purpose or task of the use cases, found in column two of . If there was a clear objective, such as assembling an object, it was carried out until completion. Use cases without a specific target were tested until all features were tried at least once. Afterwards data was then collected using the process described below.
Table 1. Description of the use cases and used devices.
The research used a mixed-methods approach combining a questionnaire-based quantitative survey, a quantitative process-based comparison, and qualitative interviews. The questionnaire included questions about demographic data, prior experience with AR/VR, user acceptance, usability, workload, flexibility, monotony, and ergonomics. The quantitative process comparison was carried out with representatives of eleven manufacturing companies. The relevant process was modelled in an as-is and to-be form, which served as a foundation for clarifying the values and collecting further process-related details. The interviews were carried out in a semi-structured format based on the created process models. All interviews and process modelling occurred virtually. The same interview guideline was used in all interviews, each lasting approximately 3 hours. For the analysis, the interviews were transcribed, coded, and analyzed using NVivo, a qualitative data analysis software.
3.2. Evaluation model
The evaluation model (see ) assessed three dimensions to allow a holistic comparison of the use cases. It is based on the five-dimensional evaluation model from Zigart (Citation2022). The multi-criteria evaluation model serves to evaluate and compare industrial assistance systems, e.g. AR and VR application and digital assistance systems, in one single process. Each dimension consists one to four criteria with a certain evaluation method. In this paper, three dimensions were set based on the industrial company goals of implementing AR/VR, resulting of a questionnaire filled out by the companies in the beginning of the project. The dimension ‘costs’ of the original evaluation model was not considered because there were too many insecurities due to the prototype stage. Also the dimension ‘technology’ was left out because in the research project the use cases were developed to a maximum stage of TRL 7. The assessment was based on standardized methods and customized procedures. The methodology can be used in research and industry for evaluating AR or VR systems to compare the current process with a potential future process supported by AR or VR.
Figure 3. Evaluation model for industrial AR/VR systems, edited and translated from (Zigart, Citation2022).
3.2.1. Process
3.2.1.1. Productivity
Due to increasing market requirements resulting from challenges such as individualization and shorter delivery times, companies are forced to improve their productivity in order to remain competitive continuously. AR/VR often aims to increase productivity (de Souza Cardoso et al., Citation2020). The productivity was calculated by comparing the process time with and without the AR/VR application.
3.2.1.2. Lead time
Shorter lead times are considered to be favourable in terms of decreased inventory levels and more predictable planning and scheduling. Higher percentage fluctuations in absolute lead times are less important (Erlach, Citation2010). Therefore, introducing an assistance system is often directly or indirectly aimed at reducing lead times. Experts estimated the changes in the process and lead time in the interviews, as the prototypes need to be in series production to measure it correctly.
3.2.1.2. Quality
Process quality refers to ‘meeting all quantitative customer requirements and achieving reproducible, consistent process execution’ (Becker, Citation2008). Five questions were asked to evaluate the effect of AR/VR applications on the quality of the process: (1) level of process standardization, (2) process monitoring and quality assurance, (3) continuous improvement process (CIP), (4) traceability, and (5) data quality and documentation. The following questions were asked:
How standardized is the process in its as-is and to-be state?
To what extent is process monitoring/quality assurance possible in the as-is and to-be process?
To what extent can data for continuous improvement of the process be obtained in the as-is and to-be process?
To what extent is traceability ensured in the as-is and to-be process?
How good is the data quality and/or documentation in the as-is and to-be process?
A self-assessment by the companies on a 1–5 scale (5 best, 1 worst) was made.
3.2.2. Qualification
3.2.2.1. Quality
Two questions were asked concerning the impact on qualification when using AR/VR systems: the expected changes in qualification and the qualification fit. Latter was included to clarify how well the requirements fit current employees’ qualifications.
3.2.2.2. Enrolment period
In order to leverage the potential, the application must be used in practice, and the employees must be trained in the changed process. The employees’ enrolment period is a decisive factor in raising the efficiency potential, as estimated by experts in the interviews.
3.2.3. User
3.2.3.1. Workload
The users’ experience with applications, especially in industrial contexts, is strongly influenced by the perceived workload connected with the task performed (Longo & Federici, Citation2018). In our case, the task was to complete the described purpose in , if possible. For more details, see chapter 3.1. The workload can have different sources, such as mental workload and physical effort. As AR/VR technologies can create a perceived physical workload, we used the NASA Task-Load Index (NASA-TLX), which has been applied to various work-related tasks, hence providing aggregated benchmarks. In particular, we applied a simplified version (‘raw’ TLX, RTLX), relying on a set of six items (Hart, Citation2006). As most of the standardized instruments in our questionnaire were based on a five-step Likert scale, we have implemented the TLX questions in this manner. For the analysis, the items were rescaled to 0–4, and the mean RTLX score was multiplied by twenty-five, resulting in an overall score on a scale of 0–100, thus being still comparable (though no longer fully continuous) with other studies using NASA-RTLX. The following questions were asked to assess the workload:
How mentally demanding was the task?
How physically demanding was the task?
How hurried or rushed was the pace of the task?
How successful were you in accomplishing what you were asked to do?
How hard did you have to work to accomplish your level of performance?
How insecure, discourages, irritated, stressed and annoyed were you?
3.2.3.2. User acceptance
User acceptance is an essential criterion for the actual (regular) use of AR/VR applications. To measure user acceptance, several methods are available. We used the Technology Acceptance Model (TAM) (Davis, Citation1989) and asked the following questions:
Using the assistance system is a new experience for me.
Using the assistance system is not similar to anything that I have done before.
Using the assistance system is different from other experiences I have had.
Using the assistance system is a new work experience for me.
Using the assistance system in practice would run counter to my own values.
Using the assistance system does not fit the way I view the world.
Using the assistance system goes against what I believe computers should be used for.
Using the assistance system is not appropriate for a person with my values regarding the role of computers.
Using the assistance system runs counter to my values about how work should be done.
Using such an assistance system would fit my preferred work routine.
The assistance system would enable me to work in the way I prefer.
Using the assistance system would fit well with the way I like to work.
Using the assistance system would fit my preferred method of working.
As the novices could not relate to the actual usage of the prototype in their work setting, only the industrial users were asked to assess the acceptance. However, the number of user tests does not allow for PLS-SEM analysis, which is the method of choice in this area. Therefore, the mean values for the items related to the Perceived Ease of Use (PEoU) and Perceived Usefulness (PU) were calculated (on a scale of 1–5).
3.2.3.3. Usability
A common approach to operationalizing usability measures perceived usability and using a standardized questionnaire. Our study used the System Usability Scale (SUS) (Brooke, Citation2013), probably the most commonly used usability metric, thus allowing comparison with other studies. The SUS was calculated using a standardized procedure, resulting in a SUS index score between 0 and 100. The results were interpreted with the Sauro-Lewis curved grading scale (Sauro & Lewis, Citation2016). The following questions were asked:
I think that I would like to use this system frequently.
I found the system unnecessarily complex.
I thought the system was easy to use.
I think that I would need the support of a technical person to be able to use this system.
I found the various functions in this system were well integrated.
I thought there was too much inconsistency in this system.
I would imagine that most people would learn to use this system very quickly.
I found the system very cumbersome to use.
I felt very confident using the system.
I needed to learn a lot of things before I could get going with this system.Ergonomics. Ergonomics is a crucial factor in production. If unergonomic movements are practised for years, the employees’ health is at risk. From the company’s point of view, long periods of absence are to be expected, which is costly and associated with uncertainty (Kugler et al., Citation2010). One item in the questionnaire asked about the perception of the overall ergonomics (considering the necessary movements to fulfill the task and loads due to the task and the AR/VR devices) of the AR/VR applications (How would you assess the overall ergonomics of the assistance system?). Furthermore, the questionnaire contained an item related to the perceived monotony of the task performed within the AR/VR and the perceived flexibility of the prototype concerning the task-related application. Novices were not asked about flexibility and monotony because they did not have a fundamental understanding of an actual application context. All assessments were performed on a 1–5 Likert scale (1 = negative perception, 5 = positive perception).
4. Use cases and evaluation results
In this section, the industrial use cases are introduced, including information about the used technology and the main benefit of the application. Afterwards, the results of the dimensions and criteria are presented and discussed.
4.1. Use cases
In our project, twelve AR and one VR use case were evaluated with a balanced distribution between AR and VR among the participants. These use cases are shortly described in . The use cases were implemented in large manufacturing companies and SME’s. The companies were asked about the most significant benefit due to the introduction of AR/VR applications in the process (see ). The main benefits mentioned by the companies are consistent with the results from previous work (de Souza Cardoso et al., Citation2020). As software tool Unity was used as well as the AR Core and AR Kit for mobile applications
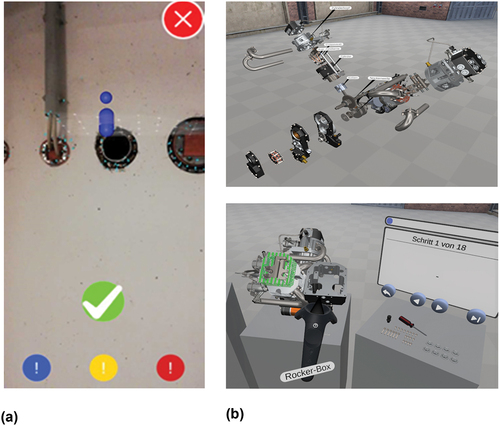
shows examples of an AR maintenance and a VR training use case.
Figure 4. Examples of (a) “7_Maintenance” and (b) “13_Training” use cases.
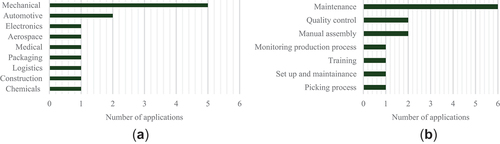
In contrast to the results of de Souza Cardoso et al. (Citation2020), and despite various advantages such as hands-free working, it is noticeable that many companies have used commercially available mobile devices (e.g. smartphones or tablets) instead of HMDs. The exact reasons could not be determined, but some interviews mentioned that smartphones are part of the employees’ standard repertoire. As a result, there are no additional hardware costs and no need to take an additional device with them. Compared to AR, VR HMDs seem pretty well developed. Most of our developed use cases are in the areas of the mechanical industry, see (a), and mainly in maintenance, see (b). Compared to common applications in literature (see ), the distribution is similar to our use cases. Some applications differ compared to , e.g. the in our research project most applications were in the ‘Mechanical’ segment and in the ‘Maintenance’ area. In literature, ‘General’ applications and in the area of ‘Manual assembly’ are most common. Additionally, in our research project we didn’t have any use cases in the segment of ‘Energy’, ‘Marine’, and ‘Government’. Regarding the areas of applications, we did not have any applications ‘Robot programming and operations’, ‘Process simulation’, ‘Operational setup’, and ‘Ergonomics and safety’. The potential analysis with the industrial companies in the beginning of the research project has resulted in the use cases shown in . For further research, also other areas and segments should be evaluated.
Figure 5. (a) distribution of applications per industrial segments of the manufacturing use cases in our research project (b) distribution of the industrial applicability of the manufacturing use cases in our research project.
5. Results
This section shows the results of each dimension, ‘process’, ‘learning & development’, and ‘user’. All criteria evaluated are shown in the results.
5.1. Process
5.1.1. Productivity
The company partners estimated the process times in the process recording of the as-is and to-be state. Results show that out of nine companies, one company indicated that the process time remains unchanged, with no company experiencing a deterioration. Eight companies indicated an improvement, of which four companies quantified efficiency increases (18.34%, 28.21%, 10.39%, 37.50%). On average, 23.61% process time saving (sd = 10.21) was estimated using AR/VR technology in the respective process.
5.1.2. Lead time
The interviews inquired into the lead time of the entire process. Six of eleven companies surveyed stated that the AR/VR application does not affect the lead time. One company could not yet estimate the impact on lead time. Four companies expected a lead time reduction of between 10% and 25% (10.00%, 10.00%, 20.00%, 25.00%). One company in remote support expected reduced necessary business trips from 90% to 50% and a faster problem solution through remote support. Travel time is eliminated and has a direct impact on lead times.
5.1.3. Quality
The median of the as-is and the to-be process of eight company answers was calculated and is shown in . The results show improvements of all quality questions assessed, see . The median of the as-is process for all questions is lower than the median of the to-be process with AR/VR. This shows that the company experts expect quality improvement by the implementation of AR/VR in industry.
Figure 6. Quality results from interviews.
5.2. Learning & development
5.2.1. Qualification
According to the interviews, the qualification requirements change moderately across the use cases. Current qualification requirements are rated an average of 3.58 on a scale of ‘very low’ (1) to ‘very high’ (5). With the respective assistance system, this value dropped to 3.25. A few company representatives expect reduced current qualification requirements through the systems which it is seen in these numbers. The extent to which the current qualification fit of the employees (on a scale of very low (1)/high (5) fit) matches the requirements is rated at 3.67 - with the system 3.25. While in most use cases the qualification fit will be slightly better, there are a few where the discrepancy of the fit is widening. According to the interviewees the users who operate the systems have limited experience in the use of digital systems. This explains the decline in the qualification fit.
The workload reduction is mainly due to the system-supported recognition and handling of exceptions. In many application scenarios, such exceptions are automatically recognized and relieve the employees. Sources of error are reduced. In addition, remote maintenance or assistance was very present. However, the requirements for the qualification itself remain unaffected. According to our results, the purpose is not to compensate for deficits as Mark et al. (Citation2019) perceive it but to use existing knowledge more efficiently, share it, and relieve highly qualified vital employees. This is also reflected in the upgrading scenario by Hirsch-Kreinsen et al. (Citation2019), where the results of our study match.
The potential for cooperation between differently qualified persons is clearly evident in the use cases ‘2-4_Remote’, ‘1_Notepad’, and ‘7 & 8_Maintenance’. A sample screenshot of a maintenance case can be seen in . It can be distinguished between a synchronous and asynchronous form of cooperation. In the case of remote support, it is synchronous networking, as the communication is direct and personal. In the other two examples, communication is indirect and asynchronous since information, e.g. notes and other information is left electronically via the AR system and is used by other colleagues after a time delay. We observed many situations where the focus was on using critical resources more efficiently to avoid bottlenecks (rather than changing skill requirements). One of the interview partners appropriately called this ‘qualification sharing’. Well-trained experts no longer have to be physically present and are thus relieved or can support several problems simultaneously. Clear examples of automation of simple activities, according to Hirsch-Kreinsen et al. (Citation2019), accompany such cooperation. Documentation activities are automated through AR/VR systems. Furthermore, it can be determined whether a specific work step has been done in case of a complaint. The transmitted photo and video material can be used for training purposes in a second-round effect.
VR training (‘13_Training’), seen in , increases the degree of standardization of training because it reduces individual influences by trainers. It increases the productivity of the trainers because they can outsource the basic training in VR and work during this time. In-depth and expanded learning were observed. The new employees could understand the product better through VR by seeing the graphical representations of the inner workings through exploded views. Improved training reduces productivity losses when new employees join the production line.
In the case of low-skill profiles and simple work steps (‘5_Kitting’), an increase in skill requirements can be expected due to additional requirements for operating the AR system. Furthermore, simple processes are focused on throughput and productivity and do not fully exploit the advantages in terms of the support function provided by AR systems. This reasoning impacts the qualification fit, as new skills in system operation are expected. In some cases, companies refused to accept increased skill requirements due to the introduction of the system. These concerns explain the high expectations for usability and ease of use of AR systems.
5.2.2. Enrolment period
The training period for the employees is a decisive factor in raising the efficiency potential. With little to no empirical data on the technology in the companies, six interviewed companies estimated the training time for the new process with the AR/VR application. In VR, training times were estimated between 0.25 and 1 hour. For remote support applications, two companies estimated 0.5 hours per person, and one company estimated eight hours, as the service process is significantly changed. One use case in AR training was estimated at 1.5 hours per employee. Thus, on average, the time was estimated at 1.96 hours, with a median of 0.75 hours for training the new process with the AR/VR application.
5.3. User
5.3.1. Workload
The workload NASA-RTLX score, calculated on a scale of 0–100 hundred, denotes the necessary workload for the task; a lower score, therefore, indicates less workload. Overall, AR prototypes reached a median RTLX score of 10.4 (IQR = 12.5) and VR prototypes reached a mean RTLX score of 20.8 (IQR = 16.7); this difference was significant (Wilcoxon rank sum test, W = 334.5, p-value = 0.001731). Novices found the workload slightly lower (median RTLX score = 12.5, IQR = 20.8) than users (median RTLX score = 16.7, IQR = 11.5), but this difference did not prove significant (Wilcoxon rank sum test, W = 631.5, p-value = 0.1394).
provides an overview of the relative frequencies of perceived workload in the RTLX categories. For users, the primary source of workload was a potentially low performance when working with AR/VR. VR additionally requires more significant effort and mental and physical demands. AR caused some frustration. The novice participants had a more diffuse distribution of the causes.
Figure 7. Task load based on NASA-RTLX; a comparison of users (n = 22) and novices (n = 47).
There was no significant correlation between the RTLX score and age (Kendall’s rank correlation test, tau = 0.0843, p-value = 0.3983). However, participants identifying as male rated the workload lower (median RTLX score = 8.33, IQR = 20.8) than participants identifying as female (median RTLX score = 16.7, IQR = 16.7); this difference was significant (Wilcoxon rank sum test, W = 319, p-value = 0.02316).
5.3.2. User acceptance
The user acceptance was evaluated with the Technology Acceptance Model (TAM). Out of the six evaluated use cases (novices did not assess acceptance), all had PEoU > 3, and only one had mean PEoU < 4. PU had lower ratings; while all use cases had mean PU > 3, only two had mean PU > 4. We conducted the same tests considering gender and age to check if there occur any differences. There were no significant differences for either of the average factors with regard to age (Kendall rank coefficient, PEoU~age: tau = −1.45, p-value = 0.1471; PU~age: tau = 0.7054, p-value = 0.6584) or gender (Wilcoxon rank sum test, PEoU~gender: W = 19, p-value = 0.2666, PU~gender: W = 15, p-value = 0.5271).
5.3.3. Usability
The usability was measured using the SUS index. Novices and users rated the prototypes above the sufficiency range of fifty (see with indications of the Sauro-Lewis grades).
Figure 8. Usability based on SUS index; a comparison of users (n = 22) and novices (n = 47).
The overall mean SUS index of the users (mean = 78.8, sd = 12.4) was higher than the novices’ overall mean SUS index (mean = 70.5, sd = 13.8); the difference was significant (t(45.4) = 2.49, p = 0.0166). The overall mean SUS index of the AR cases (mean = 69.5, sd = 14.1) was lower than the overall mean SUS index of the VR cases (mean = 77.0, sd = 12.6); this difference was also significant (t(67) = −2.34, p = 0.0222).
No significant correlation was found between the assessment of the usability based on the SUS index and the age of the participants (Kendall’s rank correlation test, tau = 0.0542, p-value = 0.5795). Similarly, when comparing the mean SUS index of participants identifying as male (mean SUS index = 73.1, sd = 14.2) and female (mean SUS index = 73.1, sd = 13.8), no significant difference was found (Wilcoxon rank sum test, W = 470, p-value = 0.796).
5.3.4. Ergonomics
The participants were asked to assess the overall ergonomics, the flexibility of the prototype concerning the task-related application, and how monotonous they would consider the work with the prototype. Novices were not asked about flexibility and monotony because they did not have a fundamental understanding of an actual application context. All assessments were performed on a 1–5 Likert scale (1 = negative perception, 5 = positive perception). There was no significant difference either between the age groups (Kendall’s rank correlation test, tau = −0.1148, p-value = 0.2979) or gender (Wilcoxon rank sum test, W = 490, p-value = 1).
5.4. Discussion of the results
The results show the evaluation of the AR/VR use cases from various perspectives. The experts estimate a productivity improvement by applying AR/VR. The reasons for efficiency improvements are diverse, e.g. simplified and faster information gathering, better quality and fewer errors, and clean and (partially) automated documentation.
Regarding the assessment of quality, we assume that the degree of improvement from the as-is to the to-be process depends on the actual state. If the initial value is high, e.g. because the process is already highly standardized, only slight improvements are made through AR/VR. If the initial value is low, the potential improvement through AR/VR applications is higher.
The study examines the qualification requirements in various use cases. These requirements show diverse changes across different scenarios. Most companies anticipate a reduction in current qualification requirements due to system-supported exception recognition and handling, which automates many tasks and reduces errors. On the other hand, in some cases there are concerns about operating the AR/VR systems, e.g. because of a lack of digital qualifications. In remote assistance, the core qualification requirements remain unchanged. In most cases, the goal is not to compensate for deficits but to leverage existing knowledge efficiently, share it, and ease the burden on highly skilled employees. This aligns with the findings of Hirsch-Kreinsen et al. (Citation2019).
The workload when using the AR/VR use cases are rather low. For the AR prototype the NASA-RTLX score is 10.4, which is equivalent to daily routine tasks (Hoda et al., Citation2010). VR prototypes reached a mean RTLX score of 20.8, which is equivalent to more complex, yet still primarily mechanical tasks (Hoda et al., Citation2010). Another study shows a lower average value of the subjective cognitive load (RTLX) in VR compared to AR, but not significantly (Wenk et al., Citation2023). The usability score for AR use cases was lower than the VR use cases. Also Wenk et al. (Citation2023) show higher usability values for VR than for AR. SUS scores for AR use cases in literature show scores of 65 (Wenk et al., Citation2023), 68.9 (Lovasz-Bukvova et al., Citation2021), 68 (Helin et al., Citation2018), and for VR 80 (Wenk et al., Citation2023), 75.50 (Othman et al., Citation2022), 76.4 (Lovasz-Bukvova et al., Citation2021), 80.14 (Ma et al., Citation2018), and 86.56 and 85.94 (Marino et al., Citation2021). SUS scores for everyday products are e.g. 93.4 for Google search, 81.8 for Amazon, 76.2 for Word, 56.5 for Excel (Kortum & Bangor, Citation2013). Interestingly, no significant correlation was found between the assessment of the usability based on the SUS index and the age or gender of the participants.
The ratings of the ergonomics dimensions were unidimensional and are, therefore, less precise than the usability or workload scores. Overall, the scores for ergonomics were weakly positive (>3), replicating the same preference for VR that was visible in the usability ratings. The users saw the prototypes as weakly flexible and providing a somewhat varied task structure, though these results need to be considered cautiously, as the users tested the prototypes only once in an artificial setting.
6. Conclusion, limitations, and further research
This section concludes the main findings of the paper, describes the limitations of the presented research, and gives an outlook for further research.
6.1. Conclusion
In this paper, a multi-criteria evaluation of thirteen AR/VR industrial use cases was carried out. All use cases are real use cases from industrial companies and evaluated in an industrial setting. The evaluation of AR/VR applications has been approached from different perspectives with a well-balanced set of criteria regarding economic and human factors, with user tests and semi-structured interviews. The direct feedback from thirteen companies and novices shows extensive insights and differences between novices and affected workers.
The evaluation shows an average decrease in process times of 23.61% and shorter lead times of up to 25%. Also, other studies show similar results, e.g. Rupprecht et al. (Citation2022) reduced the process time by 30.6% using spatial augmented reality and Zigart and Schlund (Citation2022) show decreased process times of 14.3% comparing tablet to spatial augmented reality. The process quality improved by 1.9 points on a 1–5 scale compared to the median as-is process. The experts estimated an enrolment period of 2.2 hours per employee. The practical application of remote support shows advantages like less travelling and more time for productive work. The companies argue that it is about making fewer errors and giving the employees more confidence rather than changing their qualifications. In the training use case, the main drivers are standardization and the expectation of learning steps better with the help of VR. This should reduce the performance losses for new employees if they intervene in production. Especially in remote support and similar use cases, it is about using the employees’ knowledge and qualification more broadly and efficiently. However, this could raise the qualifications of individual employees as they learn from experienced colleagues.
The user study generally shows positive feedback from users (n = 22) and novices (n = 47). The direct comparison of users and novices shows different results, like in Aschenbrenner et al. (Citation2019). Users rated usability better than novices, unlike in Zigart and Schlund (Citation2022). The workload was acceptable, but participants identifying as female felt a higher workload than identifying as male. There were no differences from participants identifying as male and female in user acceptance and ergonomics. The impression of performing worse than without the AR/VR support for users was more substantial than for novices. This might be explained by users knowing the as-is process and how they perform without the AR/VR support. Furthermore, compared to Dey et al. (Citation2018), our workload and usability evaluation does not show differences between age groups or gender. This would support the view that technology exposure determines the perception of technology and digital skill set rather than age (Helsper & Eynon, Citation2010).
6.2. Limitations
Although a comparatively large number of companies was included, some limiting factors must be considered to generalise the results: The companies participating in the study had volunteered for the project, thus assuming a positive bias towards AR/VR. The study was based on a set of prototypical solutions, and therefore, the initial tests and assessment results may deviate in the series application. The area of use of the prototypes was not homogeneous, although some general patterns could be found. Furthermore, the COVID-19 pandemic and the associated restrictions negatively impacted the prototype testing, especially the number of employees of the participating companies. On the hardware side, it must be mentioned that head-mounted displays are still heavy in weight for serial application in industry and limited in terms of depth of field and resolution. Handheld devices limit the effectiveness of the operator. As with all mobile devices, the battery life factor can not be ignored as well.
6.3. Further research
The study demonstrates manufacturing companies’ and potential users’ principal readiness and ability to apply and benefit from AR/VR applications. Due to the current state of the technology and its limited width of adaption in manufacturing, the study essentially captures the applications’ intentions, as collected in a piloting stage of a project, based on prototypical implementations accompanied by a multi-criteria evaluation. Once AR and VR become more widely applied technologies in a productive environment, it would be beneficial to follow up on these premises with a view towards success factors in using these technologies. The developmental steps from prototype to production would be of interest, providing further input to technology assessment. Different manufacturing areas should be investigated, e.g. quality control, inspection, logistics, or intralogistics. These can be significantly improved through AI and deep learning (Sahu et al., Citation2021). The developed model and the applied measures should be used and tested with further AR/VR applications in manufacturing directly at the workplaces to understand better the differences in added value and specific assessment criteria that industrial assistance systems possess. Also personal refractory to the technology should be included into further studies to measure whether the time-saving and the independency of age and gender results are confirmed in this setting as well. To measure the criteria more effectively, body measurements could be used, e.g. using pupil size and blink rates to measure cognitive load (Biondi et al., Citation2023) and or software to evaluate ergonomics (Fischer et al., Citation2023; Kostolani et al., Citation2022). Also, the combination with other technical systems to aid the workers in their tasks should be further investigated for the effects of multi-modal use of systems. In order to build an economical and ecological approach for AR/VR, sustainability effects should be considered in future evaluations (Holly et al., Citation2022).
Acknowledgments
This research was supported by the Austrian Research Promotion Agency (FFG), the Austrian Ministry for Climate Action, Environment, Energy, Mobility, Innovation and Technology (BMK), the TU Wien through the endowed professorship “HCCPPAS” (FFG-852789), and the project”Mixed Reality-Based Collaboration for Industry” (FFG-870050). The authors acknowledge TU Wien Bibliothek for financial support through its Open Access Funding Programme.
Disclosure statement
No potential conflict of interest was reported by the author(s).
Additional information
Funding
References
- Akçayır, M., Akçayır, G., Pektaş, H. M., & Ocak, M. A. (2016). Augmented reality in science laboratories: The effects of augmented reality on university students’ laboratory skills and attitudes toward science laboratories. Computers in Human Behavior, 57, 334–27. https://doi.org/10.1016/j.chb.2015.12.054
- Arendarski, B., Termath, W., & Mecking, P. (2008). Maintenance of complex machines in electric power systems using Virtual reality techniques. Conference Record of the 2008 IEEE International Symposium on Electrical Insulation, 483–487. https://doi.org/10.1109/ELINSL.2008.4570378
- Aschauer, A., Reisner-Kollmann, I., & Wolfartsberger, J. (2021). Creating an open-source augmented reality remote support tool for industry: Challenges and Learnings. Procedia Computer Science, 180, 269–279. https://doi.org/10.1016/j.procs.2021.01.164
- Aschenbrenner, D., Leutert, F., Çençen, A., Verlinden, J., Schilling, K., Latoschik, M., & Lukosch, S. (2019). Comparing human factors for augmented reality supported single-user and collaborative repair operations of industrial robots. Frontiers in Robotics and AI, 6, 6. https://doi.org/10.3389/frobt.2019.00037
- Azuma, R. T. (1997). A survey of augmented reality. Presence Teleoperators & Virtual Environments, 6(4), 355–385. https://doi.org/10.1162/pres.1997.6.4.355
- Bacca, J., Baldiris, S., Fabregat, R., Graf, S., & Kinshuk D. (2014). Augmented reality trends in education: A systematic review of research and applications. J Educ Technol Soc, 17, 133–149.
- Becker, T. (2008). Prozesse in Produktion und supply chain optimieren. Springer. https://doi.org/10.1007/978-3-540-77556-0
- Biondi, F. N., Saberi, B., Graf, F., Cort, J., Pillai, P., & Balasingam, B. (2023). Distracted worker: Using pupil size and blink rate to detect cognitive load during manufacturing tasks. Applied Ergonomics, 106, 103867. https://doi.org/10.1016/j.apergo.2022.103867
- Bottani, E., & Vignali, G. (2019). Augmented reality technology in the manufacturing industry: A review of the last decade. IISE Transactions, 51(3), 284–310. https://doi.org/10.1080/24725854.2018.1493244
- Brooke, J. (2013). SUS - a retrospective. Journal of Usability Studies, 8(2), 29–40.
- Byvaltsev, S. (2020). Review of the features of augmented reality application in the training of operators and maintenance staff. IOP Conference Series: Materials Science and Engineering, 966, 012121. https://doi.org/10.1088/1757-899X/966/1/012121
- Chan, W., Hanks, P., Sakr, G., Zhang, M., Zuo, H., T, V. D. L., F, M. H., & Croft, E. (2022). Design and evaluation of an augmented reality head-mounted display interface for human robot teams collaborating in physically shared manufacturing tasks. J Hum Robot Interact, 11(3), 1–19. https://doi.org/10.1145/3524082
- Danielsson, O., Syberfeldt, A., Holm, M., & Thorvald, P. (2023). Integration of augmented reality smart glasses as assembly support: A framework implementation in a quick evaluation tool. International Journal of Manufacturing Research, 18(2), 144–164. https://doi.org/10.1504/ijmr.2023.131583
- Danielsson, O., Syberfeldt, A., Holm, M., & Wang, L. (2018). Operators perspective on augmented reality as a support tool in engine assembly. Procedia CIRP, 72, 45–50. https://doi.org/10.1016/j.procir.2018.03.153
- Davis, F. D. (1989). Perceived usefulness, perceived ease of use, and user acceptance of information technology. MIS Quarterly, 13(3), 319–340. https://doi.org/10.2307/249008
- de Souza Cardoso, L. F., Mariano, F. C. M. Q., & Zorzal, E. R. (2020). A survey of industrial augmented reality. Computers & Industrial Engineering, 139, 106159. https://doi.org/10.1016/j.cie.2019.106159
- Dey, A., Billinghurst, M., Lindeman, R. W., & Swan, J. E. I. (2018). A systematic review of 10 years of augmented reality usability studies: 2005 to 2014. Frontiers in Robotics and AI, 5, 5. https://doi.org/10.3389/frobt.2018.00037
- Erlach, K. (2010). Wertstromdesign: Der Weg zur schlanken Fabrik. Springer Berlin Heidelberg. https://doi.org/10.1007/978-3-540-89867-2
- Fast-Berglund, Å., Gong, L., & Li, D. (2018). Testing and validating extended reality (xR) technologies in manufacturing. Procedia Manufacturing, 25, 31–38. https://doi.org/10.1016/j.promfg.2018.06.054
- Fischer, C., Rupprecht, P., & Schlund, S. (2023). Different approaches of conducting ergonomic assessment utilizing digital human models and motion capture in industrial site assembly. Intelligent Human Systems Integration (IHSI 2023) Integrating People and Intelligent Systems. https://doi.org/10.54941/ahfe1002854
- Funk, M., Bächler, A., Bächler, L., Kosch, T., Heidenreich, T., & Schmidt, A. (2017). Working with augmented reality?: A long-term analysis of in-situ instructions at the assembly workplace. Proceedings of the 10th International Conference on PErvasive Technologies Related to Assistive Environments, 222–229. https://doi.org/10.1145/3056540.3056548
- Gattullo, M., Dammacco, L., Ruospo, F., Evangelista, A., Fiorentino, M., Schmitt, J., & Uva, A. E. (2020). Design preferences on industrial augmented reality: A survey with potential technical writers. In 2020 IEEE International Symposium on Mixed and Augmented Reality Adjunct (ISMAR-Adjunct), virtual (pp. 172–177). IEEE.
- Gavish, N., Gutiérrez, T., Webel, S., Rodríguez, J., Peveri, M., Bockholt, U., & Tecchia, F. (2015). Evaluating virtual reality and augmented reality training for industrial maintenance and assembly tasks. Interactive Learning Environments, 23(6), 778–798. https://doi.org/10.1080/10494820.2013.815221
- Häfner, P., Häfner, V., & Ovtcharova, J. (2013). Teaching methodology for virtual reality practical course in engineering education. Procedia Computer Science, 25, 251–260. https://doi.org/10.1016/j.procs.2013.11.031
- Hart, S. G. (2006). Nasa-task load index (NASA-TLX); 20 Years Later. Proceedings of the Human Factors and Ergonomics Society Annual Meeting, 50(9), 904–908. https://doi.org/10.1177/154193120605000909
- Helin, K., Kuula, T., Vizzi, C., Karjalainen, J., & Vovk, A. (2018). User experience of augmented reality system for astronaut’s manual work support. Front Robot AI, 5, 106. https://doi.org/10.3389/frobt.2018.00106
- Helsper, E. J., & Eynon, R. (2010). Digital natives: Where is the evidence? British Educational Research Journal, 36(3), 503–520. https://doi.org/10.1080/01411920902989227
- Hirsch-Kreinsen, H., ten Hompel, M., & Kretschmer, V. (2019). Digitalisierung industrieller Arbeit. In M. ten Hompel, B. Vogel-Heuser, & T. Bauernhansl (Eds.), Handbuch Industrie 4.0: Produktion, automatisierung und Logistik (pp. 1–18). Springer. https://doi.org/10.1007/978-3-662-45537-1_21-2
- Ho, P. T., Albajez, J. A., Santolaria, J., & Yagüe-Fabra, J. A. (2022). Study of augmented reality based manufacturing for futher integration of quality control 4.0: A systematic literature review. Applied Sciences, 12(4), 1961. https://doi.org/10.3390/app12041961
- Hoda, R., Noble, J., & Marshall, S. (2010). How much is just enough?: Some documentation patterns on agile projects. Proceedings of the 15th European Conference on Pattern Languages of Programs - EuroPLoP ’10, 1. https://doi.org/10.1145/2328909.2328926
- Hoedt, S., Claeys, A., An Landeghem, H., & Cottyn, J. (2016). Evaluation framework for Virtual training within mixed-model manual assembly. IFAC-Papersonline, 49(12), 261–266. https://doi.org/10.1016/j.ifacol.2016.07.614
- Holly, F., Zigart, T., Maurer, M., Wolfartsberger, J., Brunnhofer, M., Sorko, S. R., Moser, T., & Schlager, A. (2022). Gaining impact with mixed reality in industry – a sustainable approach. 2022 8th International Conference on Computer Technology Applications, 128–134. https://doi.org/10.1145/3543712.3543729
- Kadir, B. A., Broberg, O., & da Conceição, S. C. (2019). Current research and future perspectives on human factors and ergonomics in industry 4.0. Computers & Industrial Engineering, 137, 106004. https://doi.org/10.1016/j.cie.2019.106004
- Khokhlovskiy, V., Oleynikov, V., Kostenko, D., Onufriev, V., & Potekhin, V. (2019). Modernisation of a production process using multicriteria optimisation logic and augmented reality. In B. Katalinic (Ed.), DAAAM Proceedings (1st ed., Vol. 1, pp. 0500–0507). DAAAM International Vienna. https://doi.org/10.2507/30th.daaam.proceedings.067
- Kim, M., Choi, S. H., Park, K.-B., & Lee, J. Y. (2019). User interactions for augmented reality smart glasses: A comparative evaluation of visual contexts and interaction gestures. Applied Sciences, 9(15), 3171. https://doi.org/10.3390/app9153171
- Kortum, P. T., & Bangor, A. (2013). Usability ratings for everyday products measured with the system usability scale. International Journal of Human-Computer Interaction, 29(2), 67–76. https://doi.org/10.1080/10447318.2012.681221
- Kosch, T., Kettner, R., Funk, M., & Schmidt, A. (2016). Comparing tactile, auditory, and visual assembly error-feedback for workers with cognitive impairments. Proceedings of the 18th International ACM SIGACCESS Conference on Computers and Accessibility, 53–60. https://doi.org/10.1145/2982142.2982157
- Kostolani, D., Wollendorfer, M., & Schlund, S. (2022). ErgoMaps: Towards interpretable and accessible automated ergonomic analysis. 2022 IEEE 3rd International Conference on Human-Machine Systems (ICHMS), 1–7. https://doi.org/10.1109/ICHMS56717.2022.9980741
- Kugler, M., Bierwirth, M., Schaub, K., Sinn-Behrendt, A., Feith, A., Ghezel-Ahmadi, K., & Bruder, R. (2010). Ergonomie in der Industrie - aber wie? Handlungshilfe für den schrittweisen Aufbau eines einfachen Ergonomiemanagements (1. Aufl.). https://www.baua.de/DE/Themen/Arbeitsgestaltung-im-Betrieb/Physische-Belastung/Praevention/pdf/Muskel-Skelett-1.pdf?__blob=)
- Li, X., Yi, W., Chi, H.-L., Wang, X., & Chan, A. P. C. (2018). A critical review of virtual and augmented reality (VR/AR) applications in construction safety. Automation in Construction, 86, 150–162. https://doi.org/10.1016/j.autcon.2017.11.003
- Longo, L., & Federici, S. (2018). Experienced mental workload, perception of usability, their interaction and impact on task performance. PLOS ONE, 13(8), e0199661. https://doi.org/10.1371/journal.pone.0199661
- Lovasz-Bukvova, H., Hölzl, M., Kormann-Hainzl, G., Moser, T., Zigart, T., & Schlund, S. (2021). Usability and task load of applications in augmented and Virtual reality. In M. Yilmaz, P. Clarke, R. Messnarz, & M. Reiner (Eds.), Systems, software and services process improvement (Vol. 1442, pp. 708–718). Springer. https://doi.org/10.1007/978-3-030-85521-5_48
- Ma, J., Jaradat, R., Ashour, O., Hamilton, M., Jones, P., & Dayarathna, V. L. (2018). Efficacy investigation of virtual reality teaching module in manufacturing system Design course. ASME J Mech Des, 141(1), 012002. https://doi.org/10.1115/1.4041428. January 2019.
- Marino, E., Barbieri, L., Colacino, B., Fleri, A. K., & Bruno, F. (2021). An augmented reality inspection tool to support workers in industry 4.0 environments. Computers in Industry, 127, 103412. https://doi.org/10.1016/j.compind.2021.103412
- Mark, B., Gualtieri, L., Rauch, E., Rojas, R., Buakum, D., & Matt, D. (2019). Analysis of user groups for assistance systems in production 4.0. https://doi.org/10.1109/IEEM44572.2019.8978907
- Mark, B., Rauch, E., & Matt, D. T. (2022). Systematic selection methodology for worker assistance systems in manufacturing. Computers & Industrial Engineering, 166, 107982. https://doi.org/10.1016/j.cie.2022.107982
- Moser, T., Hohlagschwantner, M., Kormann-Hainzl, G., Pölzlbauer, S., & Wolfartsberger, J. (2019). Mixed reality applications in industry: Challenges and research areas. 11th International Conference SWQD, Vienna (pp. 95–105.
- Moser, T., Zigart, T., Kormann-Hainzl, G., & Lovasz-Bukvova, H. (2020). Assistenzsysteme der zukunft schon heute. Aktuelle anwendungsfälle von Mixed Reality in der Produktion. WINGBusiness, 53(2), 18–24. https://issuu.com/beablond/docs/heft_02_2020_end/18
- Niedermayr, D., & Wolfartsberger, J. (2021). Design and evaluation of a virtual training environment for industrial assembly tasks. SSRN Electronic Journal. https://doi.org/10.2139/ssrn.3862367
- Othman, M. K., Nogoibaeva, A., Leong, L. S., & Barawl, M., H. (2022). Usability evaluation of a virtual reality smartphone app for a living museum. Univ Access Inf Soc, 21(4), 995–1012. https://doi.org/10.1007/s10209-021-00820-4
- Pringle, A., Hutka, S., Mom, J., van Esch, R., Heffernan, N., & Chen, P. (2019). Ethnographic study of a commercially available augmented reality HMD app for industry work instruction. Proceedings of the 12th ACM International Conference on PErvasive Technologies Related to Assistive Environments, 389–397. https://doi.org/10.1145/3316782.3322752
- Quandt, M., Ait Alla, A., Meyer, L., & Freitag, M. (2017). Success factors for the development of augmented reality-based assistance systems for maintenance services. 7. WGP-Jahreskongress, Aachen (pp. 175–182).
- Quint, F., Loch, F., Orfgen, M., & Zühlke, D. (2016). A system architecture for assistance in manual tasks. Intelligent Environments. https://doi.org/10.3233/978-1-61499-690-3-43
- Rapaccini, M., Porcelli, I., Espíndola, D. B., & Pereira, C. E. (2014). Evaluating the use of mobile collaborative augmented reality within field service networks: The case of océ italia – canon group. Production and Manufacturing Research, 2(1), 738–755. https://doi.org/10.1080/21693277.2014.943430
- Ras, E., Wild, F., Stahl, C., & Baudet, A. (2017). Bridging the skills gap of workers in industry 4.0 by human performance augmentation tools: Challenges and roadmap. Proceedings of the 10th International Conference on PErvasive Technologies Related to Assistive Environments, 428–432. https://doi.org/10.1145/3056540.3076192
- Riener, R., & Harders, M. (2012). Virtual reality in medicine. Springer London.
- Roßmann, J. (2011). From space to the forest and to construction sites: Virtual testbeds pave the way for new technologies. In D. Ma, X. Fan, J. Gausemeier, & M. Grafe (Eds.), Virtual reality & augmented reality in industry (pp. 39–54). Springer.
- Rupprecht, P., Kueffner-Mccauley, H., Trimmel, M., Hornacek, M., & Schlund, S. (2022). Advanced adaptive spatial augmented reality utilizing dynamic in-situ projection in industrial site assembly. Procedia CIRP, 107, 937–942. https://doi.org/10.1016/j.procir.2022.05.088
- Sahu, C. K., Young, C., & Rai, R. (2021). Artificial intelligence (AI) in augmented reality (AR)-assisted manufacturing applications: A review. International Journal of Production Research, 59(16), 4903–4959. https://doi.org/10.1080/00207543.2020.1859636
- Sampaio, A. (2010). Virtual reality technology used in civil Engineering Education~!2010-02-18~!2010-06-15~!2010-09-02~! The Open Virtual Reality Journal, 2(1), 18–25. https://doi.org/10.2174/1875323X01002010018
- Sauro, J., & Lewis, J. R. (2016). Quantifying the user experience: Practical statistics for user research (2nd ed.). Elsevier, Morgan Kaufmann.
- Schumann, M., Schenk, M., & Bluemel, E. (2011). Numerically controlled virtual models for commissioning, testing and training. In D. Ma, X. Fan, J. Gausemeier, & M. Grafe (Eds.), Virtual reality & augmented reality in industry (pp. 163–170). Springer.
- Sırakaya, M., & Alsancak Sırakaya, D. (2018). Trends in Educational augmented reality studies: A systematic review. Malaysian Online Journal of Educational Technology, 6(2), 60–74. https://doi.org/10.17220/mojet.2018.02.005
- Stone, R. J., Panfilov, P. B., & Shukshunov, V. E. (2011). Evolution of aerospace simulation: From immersive virtual reality to serious games. Proceedings of 5th International Conference on Recent Advances in Space Technologies - RAST2011, 655–662. https://doi.org/10.1109/RAST.2011.5966921
- Terhoeven, J., Schiefelbein, F.-P., & Wischniewski, S. (2018). User expectations on smart glasses as work assistance in electronics manufacturing. Procedia CIRP, 72, 1028–1032. https://doi.org/10.1016/j.procir.2018.03.060
- Vacchetti, L., Lepetit, V., Ponder, M., Papagiannakis, G., Fua, P., Thalmann, D., & Thalmann, N. M. (2004). A stable real-time AR framework for training and planning in industrial Environments. In S. K. Ong & A. Y. C. Nee (Eds.), Virtual and augmented reality applications in manufacturing (pp. 129–145). Springer London. https://doi.org/10.1007/978-1-4471-3873-0_8
- Wang, X., & Dunston, P. S. (2007). Design, strategies, and issues towards an augmented reality-based construction training platform. ITcon, 12, 363–380.
- Webel, S., Bockholt, U., & Keil, J. (2011). Design criteria for AR-Based training of maintenance and assembly tasks. In R. Shumaker (Ed.), Virtual and mixed reality—new trends (pp. 123–132). Springer.
- Wenk, N., Penalver-Andres, J., Buetler, K. A., Nef, T., Müri, R. M., & Marchal-Crespo, L. (2023). Effect of immersive visualization technologies on cognitive load, motivation, usability, and embodiment. Virtual Reality, 27(1), 307–331. https://doi.org/10.1007/s10055-021-00565-8
- Zhou, Y., Ji, S., Xu, T., & Wang, Z. (2018). Promoting knowledge construction: A model for using virtual reality interaction to enhance learning. Procedia Computer Science, 130, 239–246. https://doi.org/10.1016/j.procs.2018.04.035
- Zigart, T. (2022). Entwicklung eines multikriteriellen Evaluierungsmodells für industrielle Assistenzsysteme [TU Wien]. https://doi.org/10.34726/HSS.2022.98440
- Zigart, T., & Schlund, S. (2020). Evaluation of augmented reality technologies in manufacturing – a literature review. In I. L. Nunes (Ed.), Advances in human factors and systems interaction (pp. 75–82). Springer International Publishing. https://doi.org/10.1007/978-3-030-51369-6_11
- Zigart, T., & Schlund, S. (2022). Ready for industrial use? A user study of spatial augmented reality in industrial assembly. 2022 IEEE International Symposium on Mixed and Augmented Reality Adjunct(ISMAR-Adjunct) , 60–65. https://doi.org/10.1109/ISMAR-Adjunct57072.2022.00022