
 ?Mathematical formulae have been encoded as MathML and are displayed in this HTML version using MathJax in order to improve their display. Uncheck the box to turn MathJax off. This feature requires Javascript. Click on a formula to zoom.
ABSTRACT
In the present work, the surface of the ZK60 Mg alloy was alloyed with tin (Sn), and the FSP process parameters have been optimized for the better mechanical properties by employing response surface methodology (RSM). Furthermore, RSM was combined with artificial neural networks (ANNs) to evaluate and compare the predictive capacity of both the models. FSP process parameters, namely, tool rotational speed (S), feed rate (F), number of passes (N), and weight percentage of Sn (W) were selected as influential parameters for optimization. The optimum conditions that were predicted by the RSM model to maximize the ultimate tensile strength (UTS) and % elongation (%EL) were a tool rotational speed of 2000 rpm, a feed rate of 0.39 mm/sec, 3 number of passes, and 8 wt.% of Sn which yields the maximum tensile strength of 217 MPa and the maximum %El of 26%.
1. Introduction
In the past few decades, the research on magnesium alloys has been tremendously increased for their applications in various fields like automotive, aerospace, and biomedical due to their excellent strength to weight ratio as compared to that of aluminium alloys (Radha & Sreekanth, Citation2017). In the biomedical industry, Mg alloys are more attractive as a biodegradable implant taking advantage of their high degradability (Radha & Sreekanth, Citation2020). Moreover, the modulus of Mg alloys is close to that of bone which avoids the stress-shielding effect. The bioactivity and compatibility with the roentgenogram are the other attractive properties of Mg alloys towards biomedical applications. For aerospace and automobile applications, their low strength to weight ratio is the most favourable property. However, their applications are limited by their poor corrosion resistance and formability at room temperature. The plastic deformation of Mg alloys at room temperature is limited because of the smaller number of active slip planes in the hcp close packed structure i.e. basal, pyramidal, and prismatic planes (Shi et al., Citation2023). Out of these planes, the basal slip plane is most dominant for the plastic deformation at room temperature. The addition of rare earth elements could improve the mechanical properties and formability at room temperature to some extent (Chaudry et al., Citation2022). On the other hand, severe plastic deformation is yet another technique for improving the ductility of Mg alloys by largely reducing the grain size and modifying the texture. Friction stir processing is one of the solid-state severe plastic deformation techniques used on Mg alloys for various motives such as to refine the grain size, surface modification, surface texturing, phase distribution and to prepare surface composites etc. Most of the recent research was focused on preparing surface composites using FSP by reinforcing ceramic particles. For the biomedical applications, hydroxyapatite particles are being reinforced on the surface of Mg alloys aimed to improve the bioactivity (Wu et al., Citation2023). This process is also useful in improving the tribological properties of the surface by incorporating various ceramic particles such as SiC (Vignesh Kumar et al., Citation2020), ZrO2 + CuO (Huang et al., Citation2024), and MnO + ZrO2 (Mao et al., Citation2024). Yue et al. (Citation2024) have used a high entropy alloy (AlCoCrFeNi2.1) in between the two blocks of AZ31 Mg alloys and friction stir processed to improve the tribological properties. WE43 Mg alloy modified with ZnO and Cu-ZnO nanoparticles has shown to be improving cell adhesion, biocompatibility, and cytotoxicity (Mehdizade et al., Citation2024). A submerged friction stir process on Mg-Li alloys aided to improve the mechanical properties significantly by the formation of dual-phase with fine distribution and dynamic recrystallization (Li et al., Citation2024). Marode et al. have investigated the effects of different process variables on the microstructural and corrosion behaviour of AZ91 Mg alloy reinforced with SiC and Gr and found that the mechanical and corrosion properties have largely increased due to the formation of surface hybrid composites (Bharti et al., Citation2023). Reinforcement of graphene nanoparticles in AZ91 has shown to improve ultimate tensile strength (Marode et al., Citation2024). Kumar et al. (Citation2024) have investigated the effect number of passes on the Mg-Hopetite surface composite prepared using FSP and stated that the reinforcement of hopetite has improved the bioactivity and corrosion resistance. A combination of ZeO2 and CeO2 particle reinforcement has shown to improve the hardness of the AZ31B alloy (Li et al., Citation2023).
To reduce the number of trial and experiments as well as reducing the production cost of the product, the researchers started to explore on different types of modelling, statistical and artificial intelligent (AI) techniques such as Taguchi, response surface methodology (RSM), artificial neural network (ANN), and hybrid models. Sivasamy et al. (Pravina et al., Citation2023) worked on prediction and optimization on the photodegradation of dye using nano-ZnO anchored glass fibre under solar light irradiation by using RSM, ANN, and genetic algorithm (GA) combinedly. From the study, it was found that hybridization of the prediction model (RSM + ANN + GA) has predicted more accurately (96.69%) than an individual prediction model (86.72%). Neellesh et al. (Sahu & Andhare, Citation2019) carried out work on optimizing machining parameters to enhance machinability of Ti-6Al-4 V by RSM and teaching learning based optimization (TLBO), ‘JAYA’ algorithm, and GA and was found that TLBO and JAYA algorithms performed better than GA. Ravi et al. (Tyagi et al., Citation2021) have investigated on the wear properties of AA7075-SiC surface composites fabricated by FSP. RSM and ANN techniques were used for optimisation of process parameters and found that ANN has the more predicting capacity than the RSM. In another study (Butola et al., Citation2022), the tensile properties of nano-surface composites of AA7075 aluminium alloy reinforced with B4C particles using FSP were optimized using RSM and ANN. From the investigations, it is observed that the percentage of absolute error in RSM and ANN for ultimate tensile strength were found to be 3.537 and 2.788 while for the % of elongation, it was found to be 2.865 and 2.578 and hence, ANN model’s prediction is more accurate than RSM.
Various parameters of the friction stir welding (FSW) or FSP such as tool rotational speed, feed rate of the tool, tool pin profile, tilt angle, axial force, and number of passes influence the mechanical properties of the processed region (Sevvel & Jaiganesh, Citation2016; Sevvel & Satheesh, Citation2018). The study conducted by Saravanakumar et al. (Citation2024) on optimization of friction stir processing parameters for aluminium alloy reinforced with SiC particles using the Taguchi L9 orthogonal array. The findings demonstrated the significant impact of process parameters, tool spinning speeds, and rotational speeds on the microstructure, wear rate, and microhardness. The study highlighted the potential benefits of using FSP to improve the mechanical characteristics and wear resistance of aluminium alloy composites reinforced with SiC nanoparticles. The other similar study has focused on the effects of varying FSP parameters, including tool rotational speed (TRS), tool traverse speed (TTS), and groove width (GW), on the production of AA8090/SiC surface composites. The study utilized response measures such as ultimate tensile strength (UTS) and surface roughness (SR) to understand the impact of these parameters. The investigation employed response surface methodology (RSM) to establish mathematical relationships between the input parameters and the UTS and SR of the surface composites. The results indicated that increasing TRS led to well-finished surface composites with decreased strength, while higher TTS and GW values generated rougher surfaces and higher strength (Adiga et al., Citation2024). Ragunath et al. (Citation2024) have demonstrated the successful surface modification of SS410 steel with gas atomization synthesized AlCrCoFeNi HEA powder through FSP, leading to significant enhancements in mechanical properties and wear resistance. The study provides valuable insights into the optimization of wear rate and the characterization of the HEA powder and FSP-HEA samples. The findings offer potential applications in industries such as aerospace, nuclear, and chemical, while also identifying limitations and further research directions. In another study, Liu et al. (Citation2024) provided valuable insights into the influence of FSP parameters on the microstructure and hardness of the Al-Si-Fe-Mg alloy, highlighting the significance of rotation speed, transverse speed, tilt angle, and penetration depth. The developed quadratic polynomial model and Taguchi method offer a robust framework for predicting and optimizing the FSP parameters to achieve superior mechanical properties in cast alloys. The study’s findings significantly contribute to the understanding of the FSP process and its potential for enhancing the mechanical properties of Al-Si-Fe-Mg alloys. Ghetiya et al. (Citation2023) concluded by determining the optimal FSP process parameters for the AA5083/(SiC-Gr) hybrid composite and conducting microstructural analysis to confirm the improved microstructure and uniform dispersion of the reinforcement material in the FSP specimen with these parameters. The findings provide valuable insights into the development and optimization of hybrid surface composites, with implications for various industries, including aerospace, automobile, and marine. The study emphasizes the potential for future research to explore additional properties and applications of the developed composite, as well as scalability and industrial feasibility.
Most of the previous studies have focused on preparation of metal matrix composites (MMCs) on the surface of various Mg alloys. The authors of this work have successfully developed a surface alloy on ZK60 Mg alloys by incorporating Sn using FSP (Lingampalli & Dondapati, Citation2024). In the present work, an attempt had been made to optimize the FSP process parameters for better mechanical properties. A hybrid approach by combining response surface methodology and artificial neural networks has been implemented to get the best fit between the predicted and experimental values.
2. Materials and methods
Rectangular plates measuring 150 mm × 80 mm × 6 mm were cut for fabricating the surface alloy of the as-cast ZK60 Mg alloy with Sn. The chemical composition and the mechanical properties of ZK60 magnesium alloy were listed in and . To perform FSP, a rectangular groove of size 150 mm × 1 mm × 2 mm was made in the middle of the plates, and Sn powder was packed inside the groove as shown in . The work specimen was firmly clamped to the worktable of the friction stir welding (FSW) machine (Kirloskar, 11 KW, 3-phase induction motor) used for FSP in this work which has the spindle speed range of 100 to 2800 rpm (infinitely variable) and the tool head tilt angle of 5° on either side. The tool used for FSP was made of H13 tool steel with a shoulder diameter of 20 mm with a cylindrical pin profile of 5 mm height. In order to prevent spillage of Sn powder, a capping process was done before FSP using a flat pin-less cylindrical tool with a shoulder diameter of 20 mm. The plunge depth was kept constant at 0.050 mm/sec during all the experiments.
Figure 1. (a) Friction stir processing machine used in this study. (b) Bare sample with the rectangular groove. (c) Capping the holes to avoid spillage of the tin powder. (d) Friction stir processed work specimen.
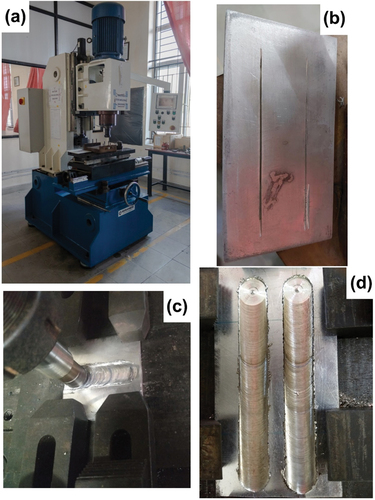
Table 1. Chemical composition of the ZK60 Mg alloy.
Table 2. Mechanical properties of the ZK60 Mg alloy.
2.1. Characterization
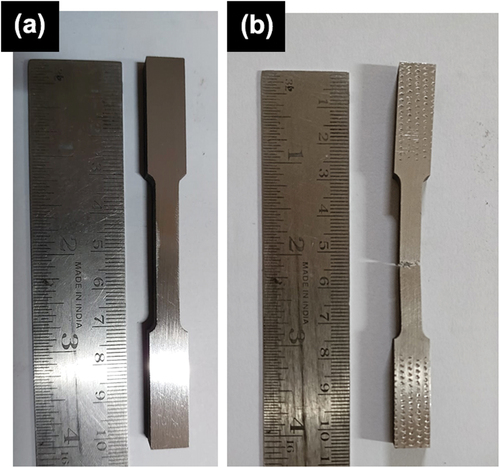
Phase analysis was done by carrying out scanning the samples using an X-ray diffractometer (XRD). Cu Kα radiation was employed where λ being 0.1540598 nm at a voltage of 45 kV and a current of 30 mA. The scanning speed used was 1°/min with a step size of 0.05° in the 2θ range of 20°–80°. For the microstructural observations, samples were cut from the base as well as cross section of FSP zones. They were then polished as per the ASTM E3–11 standard and were cleaned with ethanol to remove the residues generated from the polishing. The cleaned samples were etched with picral comprised of 0.4 g picric acid, 10 ml ethanol, 2 ml acetic acid, and 5 ml distilled water for 2–5 s. The microstructural observations were carried out using an optical microscope (Olympus, model BX 51 M, with a magnification range 50X–1000X), and a scanning electron microscope (SEM) operated at 20 kV attached with the energy dispersive spectroscopy (EDS) was also carried out to confirm the presence of Sn in the FSPed zones. Tensile test on all the 32 samples was conducted using a universal testing machine (UTM, Schimadzu). The tensile specimen was prepared as per the ASTM E8 standard. The sample tensile test specimen before and after the test was depicted in .
Figure 2. Tensile test specimen cut from the FSP region (a) before the test and (b) after the test.
In this research, the choice of ANOVA (analysis of variance), RSM (response surface methodology), and ANNs (artificial neural networks) for optimization is both strategic and synergistic. Each method brings unique strengths to the optimization process, creating a robust and comprehensive approach. Here is an in-depth look at why these methods were chosen and how they complement each other.
2.2. Analysis of variance (ANOVA)
ANOVA is a statistical tool used to analyze differences among group means in a sample. Its selection in this research is justified by several key advantages:
2.2.1. Identifying significant factors
ANOVA helps in determining which independent variables have a statistically significant effect on the dependent variable. This is crucial for optimizing processes, as it allows researchers to focus on the most impactful factors.
2.2.2. Variance decomposition
It decomposes the observed variance into components attributable to different sources, providing a clear understanding of the contribution of each factor.
2.2.3. Interaction effects
ANOVA can assess the interaction effects between factors, which is essential for understanding the combined influence of multiple variables on the response.
2.3. Response surface methodology (RSM)
RSM is a collection of mathematical and statistical techniques useful for developing, improving, and optimizing processes. The decision to use RSM is based on the following reasons:
2.3.1. Model building
RSM facilitates the creation of empirical models to approximate the true relationship between the input variables and the response. This is achieved through polynomial equations, making it easier to navigate complex relationships.
2.3.2. Optimization
It is specifically designed for optimization, enabling the determination of optimal conditions for the process. RSM uses designs like central composite design (CCD) and Box-Behnken design (BBD) to explore the response surface effectively.
2.3.3. Visualization
The methodology provides tools for visualizing the response surface and contour plots, aiding in the intuitive understanding of how variables interact and affect the outcome.
2.4. Artificial neural networks (ANNs)
ANNs are computational models inspired by the human brain, capable of recognizing patterns and making predictions. Their inclusion in this research offers several benefits:
2.4.1. Nonlinear relationships
ANNs excel at modeling complex, nonlinear relationships that are often difficult to capture with traditional statistical methods. This is particularly useful when the response surface is not well-approximated by simple polynomial models.
2.4.2. Adaptive learning
ANNs can learn from data and improve their performance over time. This makes them highly adaptable to changes and capable of handling large datasets with many variables.
2.4.3. Prediction accuracy
The predictive power of ANNs is often superior, providing accurate and reliable predictions of the response variable based on new input data.
The integration of ANOVA, RSM, and ANN in this research is a strategic choice designed to leverage the unique strengths of each method for a comprehensive optimization framework. ANOVA (analysis of variance) is employed to identify which factors significantly impact the response, enabling a focused analysis on the most influential variables. This initial step ensures that the optimization efforts are directed towards the most critical factors, enhancing efficiency and effectiveness. RSM (response surface methodology) then constructs detailed empirical models to explore the relationships between these factors and the response variable. It uses designs like central composite design (CCD) to systematically investigate and visualize the response surface, aiding in the identification of optimal process conditions. ANNs (artificial neural networks) further enhance the optimization process by capturing complex, nonlinear relationships that RSM might not fully address. ANNs offer high predictive accuracy through their ability to learn from data and adapt to new patterns, providing reliable predictions for process outcomes. Together, these methods ensure a thorough and multifaceted approach: ANOVA provides statistical significance, RSM offers a structured pathway to optimization, and ANN ensures robustness and precision in predictions. This combination maximizes the strengths of each method, ensuring a balanced and comprehensive optimization strategy that is both theoretically sound and practically applicable.
In this work, RSM with central composite design (CCD) was chosen to optimize the FSP parameters. The tool rotational speed (S), feed rate (F), and number of passes (N) are crucial parameters in determining the proper distribution of particles and enough heat generation for surface alloying. Hence, these parameters along with the wt.% of Sn (W) were chosen as variables, output parameters being the ultimate tensile strength (UTS), % elongation (%El). lists the chosen FSP variables and their levels.
Table 3. FSP parameters and their levels.
Upper and lower limits of parameters are denoted by + 2 and −2, respectively, and the following equation is used to determine the coded values for intermediate ranges are calculated using the below equation (Murugan & Parmar, Citation1994):
where xmin and xmax are the lower and upper levels of the parameters, respectively, whereas x denotes any number in the range of the parameter from xmax to xmin and xi is the desirable coded value of a parameter. A total of 31 experimental combinations were obtained by creating response surface design using Minitab software which are shown in .
Table 4. Experimental design matrix and their responses.
Tensile test samples were prepared from the FSP’ed region of the workpiece by the wire cut EDM machine carefully. The tensile test specimen was prepared as per the ASTM E8 guidelines, and the test was carried out using a universal testing machine of 50 kN capacity to measure tensile properties such as ultimate tensile strength (UTS), percentage elongation (%El), yield strength (YS), and modulus of elasticity (E). Out of the properties measured, UTS and % elongation were chosen as a response for RSM analysis.
3. Results and discussion
3.1. Phase and microstructural analysis
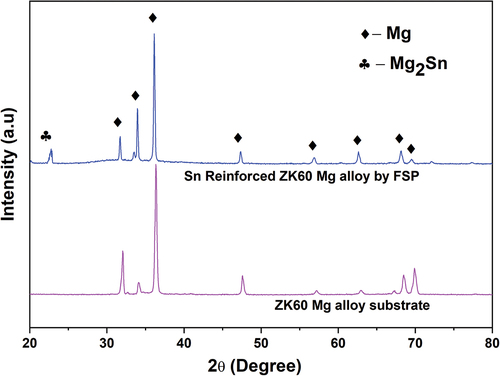
shows the XRD patterns of the friction stir processed ZK60 Mg alloy substrate in comparison with the sample reinforced with Sn using FSP. It can be observed that both the samples consisted of characteristic Mg peaks and the sample reinforced with Sn contains the characteristic peaks of Mg2Sn at 2θ = 22.7º which matched with the standard reference pattern of a Mg2Sn intermetallic phase of Mg-Sn alloys (JCPDS #:00-007-0274) indicating the formation of the alloy on the surface.
Figure 3. XRD spectra of the ZK60 Mg alloy substrate material and the sample reinforced with Sn by friction stir processing.
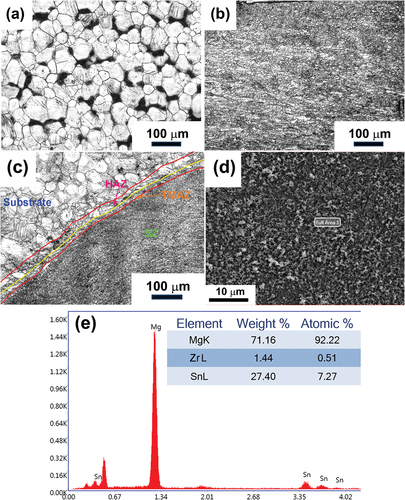
shows the optical micrographs of substrate material and the FSPed zone of the sample reinforced with Sn, respectively. It can be clearly observed that the FSPed zone has large reduction in the grain size due to severe plastic deformation and dynamic recrystallization. shows the FSPed region with different zones such as a stir zone (SZ), a thermo-mechanically affected zone (TMAZ), and a heat affected zone (HAZ). It is evident that the grain size in these zones is having different sizes, shape, and orientations. The TMAZ zone has elongated grains with different sizes and orientations since this zone is very near to the stir zone and experiences insufficient heat input and stirring action to generate irregular shaped grains. Furthermore, heat affected zones also experience insufficient heat input, and the generated heat is not sufficient for dynamic recrystallization. However, the stir zone is fully characterized by the development of the fine-grained microstructure. The average grain size of as-received pure magnesium was found to be in the range of ~ 8–9 µm and that of surface alloyed samples was found to be lesser average grain size in the range of ~ 3–5 µm. Scanning electron microscopic image of the FSP’ed region is shown in while the EDS spectrum taken in the FSPed zone was presented in . The presence of Sn in the FSPed zone can be clearly observed from EDS elemental mapping and spectroscopy conforming to the results of XRD.
Figure 4. (a) Optical microstructure of the ZK60 Mg alloy substrate. (b) Optical microstructure of the ZK60 Mg alloy reinforced with Sn using FSP. (c) Optical microstructure of the FSPed ZK60 Mg alloy showing the junction between both FSPed and non-FSPed zones. (d) SEM image of the FSPed zone of ZK60 Mg alloy reinforced with Sn. (e) EDS spectrum of the FSPed zone of ZK60 Mg alloy reinforced with Sn.
3.2. Mathematical modelling
The RSM is made up of mathematical and statistical techniques that are essential for modelling, analysis, and problem-solving. It estimates whether input parameters affect responses, establishes the relationship between input and output parameters, and finds the best design that produces a substantial (or minimal) response throughout a given region of interest.
The RSM-CCD matrix consisting of 31 experiments is conducted to develop the mathematical models showing the relationships between the output parameter Y (UTS, %EL) and the input parameters (S, F, N, and W). The second order response surface model for the four parameters is given as (Vasantha Kumar & Murugan, Citation2011)
For the four input parameters, the selected polynomial could be expressed as
where b0 is the free term of regression equation, b1, b2, … , bk are the linear terms, b11, b22, … , bkk are the quadratic terms, and b12, b13, … , bk–1 k is the interaction term.
Analysis of variance (ANOVA) is a known statistical tool to determine the adequacy of the developed model. It is also useful to verify which parameters have greater influence on the output and which factors can be eliminated. The fit of the model generally can be evaluated using the coefficient of regression (R2) and adjusted coefficient of regression (R2). In general, the P-value of < .05 indicates that the parameter has significant effect on the output. Similarly, the regression coefficient R2 describes the fit of the model and expressed in terms of the percentage of data that the model can be confident. In some of the cases, adjusted R2 value is more reliable as the R2 value has the influence from various predictors in the model. The adequacy of the model as determined by ANOVA was tabulated in .
Table 5. Calculation of variance for testing significance of the model for UTS.
The F-value of 38.66 and P-value less than 0.05 as seen from implies that the model is significant. It can also be noted that the parameters that have significant effect on the ultimate tensile strength are S, F, W, SF, SN, SW, FN, FW, NW, S2, F2, N2, and W2. Hence, it can be understood that the number of passes has no significant effect in determining the ultimate tensile strength. For this model, the regression coefficient, R2 value of 97.13% () indicates that the predicted values are in close agreement with the actual values. Furthermore, the low F-value of 4.60 and corresponding P-value of 0.038 for lack of fit implies that the chosen model is a good fit for the data. Similar observations can be made in the case of %EL as can be observed from however, in this case, feed rate and the weight percent of tin addition seems to have no significant effect on the % of elongation. The value of R2 for %EL was observed to be 87.14% as shown in which can also be deemed significantly close fit.
Table 6. Calculation of variance for testing significance of the model for %EL.
Table 7. Model summary for UTS and %EL.
Regression model equations for UTS and %EL given in EquationEquation 3(3)
(3) and Equation4
(4)
(4) , respectively, are checked for their accuracy by calculating the predicted values and found to be significantly close to the actual value.
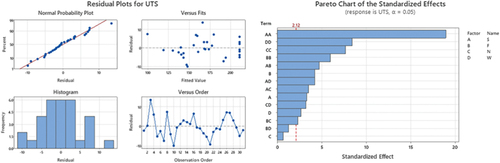
Pareto chart is yet another graphical tool used in design of experiments to identify and prioritize the most significant factors contributing to a problem. In principle, it states that the majority of the problems (80%) are often caused by a small number of factors (20%). It can be observed in from the pareto chart of the UTS, that the most effecting parameter is speed where F and W have moderate effect while N has no influence at all. In general, high rotational speed led to increase in heat generation due to higher friction between the tool and the workpiece. This increase in heat input could lead to extensive plastic deformation and thermal expansion, as a result, in higher residual stresses in FSP area. This could be one of the reasons for increase in UTS with tool rotational speed, while other reason could be because of the proper diffusion of on the surface of ZK60 Mg alloys leading to solid solution strengthening.
Figure 5. Residual plots and Pareto chart for ultimate tensile strength.
As for the percentage of elongation (%EL), the most influence is the number of passes (N) as observed in the pareto chart from the . Obviously, every single pass can alter the magnitude and distribution of residual stresses within the stir zone. Multiple passes result in a greater number of grain boundaries and smaller grain size, which can enhance the mechanical properties. A fine grain structure usually associated with increased strength and improved ductility. From the pareto chart, it is clear that the interaction between the speed and number of passes affects the elongation of the processed area.
Figure 6. Residual plots and Pareto chart for % elongation.
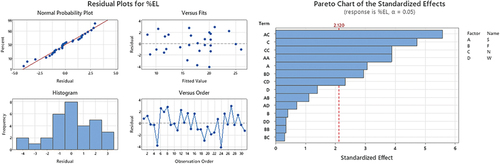
Residual graphs for developed model for UTS and %EL are plotted to check adequacy as shown in and . A normal plot of residuals depicting a straight line suggests that the data adhere to sample size guidelines, confidence intervals, and accurate P-values. In the residual versus fitted plot, the ideal scenario entails points being randomly distributed on both sides of zero without any discernible pattern. All points are observed to be dispersed around zero without exhibiting non-constant variance or outliers, confirming the random distribution of residuals with consistent variance. Regarding the residual versus order plot, it serves to showcase the sequential order of data collection and any discernible patterns therein. Ideally, residuals should scatter randomly about the centre line. However, it is apparent that nearby residuals are correlated, indicating a lack of independence among them.
and (main effects plot) depict the effect of individual parameters such as speed (S), feed rate (F), number of passes (N), and weight percentage of Sn (W) on the ultimate tensile strength (UTS) and percentage of elongation (%EL). It can be noted that with the increase in speed, UTS also increases initially and then decreases after 2000 rpm. The other parameters F, N, and W have also shown similar trend of increasing initially and falling thereof. The optimized values of parameters for the higher UTS are listed in , and the comparative analysis with the other similar studies is tabulated in to understand the most influential parameters on various responses. In the case of %EL, the trend was slightly different. The %EL increased up to the range of 1800–1900 rpm, and thereafter, it decreased whereas the curves of F and W are almost flat indicating no significant influence and the feed rate (F) has moderate influence on the response.
Figure 7. Interaction and main effect plots for UTS.
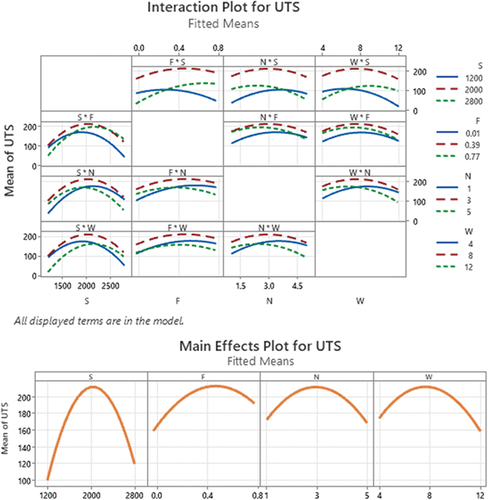
Figure 8. Interaction and main effect plots for %EL.
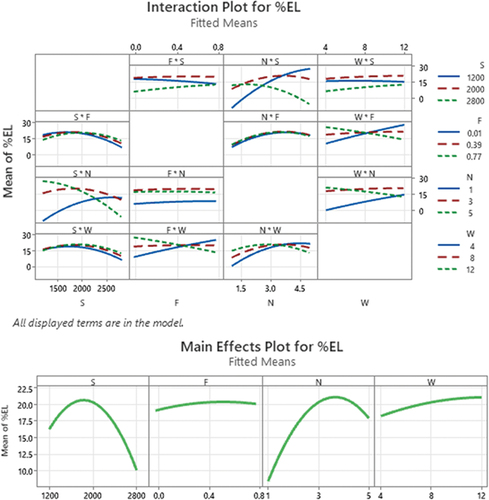
Table 8. Optimized process parameters and their responses.
Table 9. Comparative analysis of optimized process parameters and their responses from other previous research works.
3.3. Analysis of response surface and plots
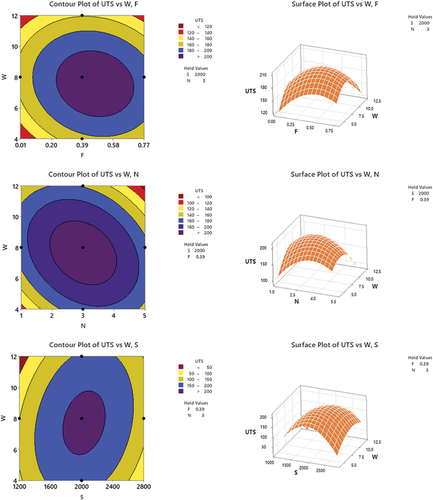
Contour plots are to examine the relationship between a response and two independent variables. In a contour plot, the values for two independent variables are represented on the x- and y-axes, and the values for the response variable are represented by shaded regions, called contours. A contour plot is like a topographical map in which x, y, and z values are plotted instead of longitude, latitude, and altitude, respectively. The interconnection effect on UTS, %EL has been analysed using the 2D contour and 3D surface plots. As observed from , the highest values of UTS are in the upper right corner of the plot, which corresponds to higher values of both feed rate and weight percentage. The lowest values of UTS are in the lower left corner of the plot, which corresponds with low values of both feed rate and weight percentage. The remaining predictors like number of passes and speed are not displayed in the plot. Minitab holds the values of speed and number of passes constant at approximately 2000 rpm and 3, respectively, when calculating the fitted response values of UTS. Changing these hold values will also change the contours. The shape of contour map reveals the actual and degree of interactions between independent variables. Circular contour plots typically indicate that the factors being studied do not interact with each other, suggesting independence. Elliptical contour plots indicate that the factors are not acting independently, and their combined influence may vary across different levels.
Figure 9. 2D contour plots and 3D surface plots for UTS.
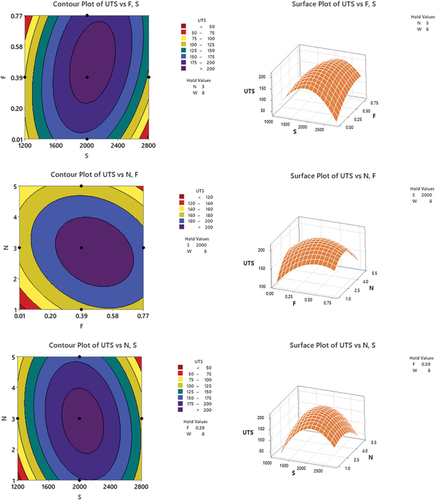
Figure 9. Continued.
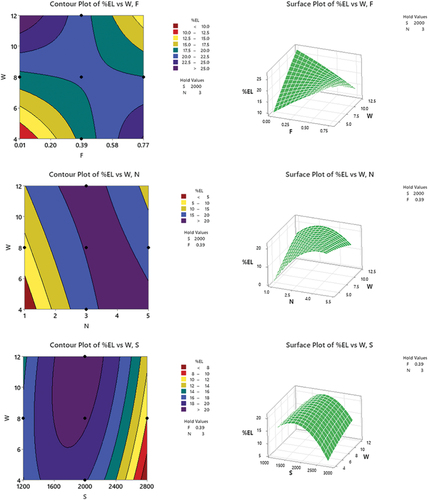
In the case of %EL (), the contour plots are mostly hyperbolic in nature, and some of the plots are falling into the category of falling ridge, rising ridge, or stationary ridge systems. The contour plots between feed rate and weight percentage lines are hyperbolic nature suggesting the complex interaction between factors, and the centre is neither a maximum nor a minimum point. This involves higher-order interactions and needs careful analysis to understand the specific nature of the interaction. The interaction between speed vs. feed and speed vs. number of passes both contour plot showed a falling ridge system suggesting a negative relation between factors and provide insights into how changes in one variable affect the response variable in a systematic way. Furthermore, the contour plots between feed vs. number of passes represent the ‘stationary ridge’ system indicating the region where the factors have limited influence on the outcome. Conversely, the contour plots of speed vs. number of passes and the number of passes vs. weight percentage depicted the rising ridge system implying a systematic influence on the response variable as the levels of factors change along the rising ridge.
Figure 10. 2D contour plots and 3D surface plots for %EL.
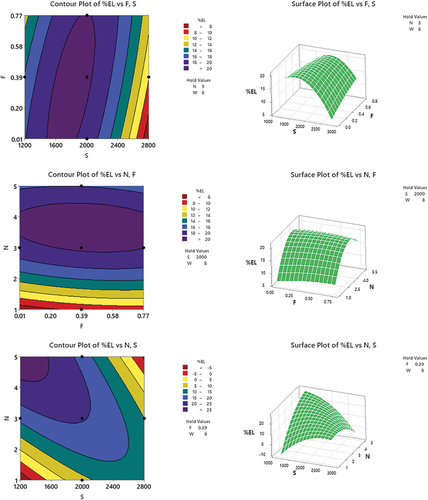
Figure 10. Continued.
3.4. Fractography analysis of the tensile fracture
shows the fractographic SEM images of the samples whose experimental conditions were given in . depicts the ductile fractures as the surface shows the characteristic dimpled structure derived from the growth of the micro-voids during plastic deformation and subsequent separation at the fracture. This kind of fractures signifies the homogeneous distribution and plastic flow of the material as observed by authors in the previous research (Gunasekaran et al., Citation2023; John Solomon, Sevvel, Gunasekaran, & Rajarajan, Citation2023; John Solomon, Sevvel, Gunasekaran, & Vasanthe Roy, Citation2023; Satheesh et al., Citation2020). shows the grainy appearance at the fracture indicating that it is the brittle fracture. As can be noted from , both feed rate and weight percentage of Sn have influence on the type of fracture and % elongation. As the feed rate increases and/or as the weigh percent of Sn decreases, the % elongation is decreased, in other words, the tensile fracture has transformed from ductile to brittle. It can be understood that the increase in the Sn content increases the ductility of the Mg alloy.
Figure 11. SEM micrographs of the tensile fracture surface showing different types of failure.
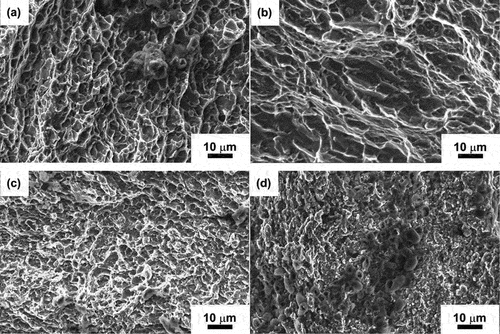
Table 10. Ultimate tensile strength and % elongation values of selected tensile fractured samples.
3.5. RSM-ANN model
From the previous sections, it can be understood that there exist several non-linear correlations, and it was thought to adopt a hybrid RSM-ANN (Artificial Neural Networks) approach since ANN can capture intricate non-linear correlations between input and output parameters. ANNs are a class of machine learning algorithms inspired by the structure and functioning of biological neural networks in the human brain. ANNs are widely used for various tasks such as classification, regression, pattern recognition, and optimization. Optimization methods for ANNs aim to improve the performance of the network by adjusting its parameters to minimize errors or maximize some objective function. Feed-forward back propagation is a widely used optimization algorithm in artificial neural networks (ANNs), particularly for supervised learning tasks such as classification and regression. The feedforward backpropagation algorithm optimizes the weights and biases of an artificial neural network by iteratively minimizing the error between predicted and actual outputs through forward propagation of inputs and backward propagation of errors. This process allows the network to learn complex patterns and relationships in the data and make predictions or classifications accordingly.
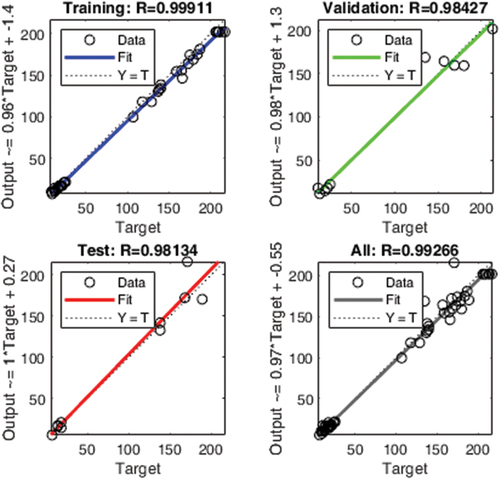
The ANN model is developed by using MATAB® software by applying the Levenberg Marquardt algorithm feed-forward back propagation algorithm. The 31 data sets from RSM experiments are divided into 70% of training data (21 data sets), 15% of validation data (5 data sets), and 15% of testing data (5 data sets). The model consists of four input factors, that is, speed, feed rate, number of passes, and weight percentage, 10 hidden layers, and the outputs generated using the models are UTS and % of elongation as depicted in showing the structural representation of the developed model. Using the neural network fitting tool in MATLAB®, the data were trained, validated, and tested, and the performance curves of which are shown in . The correlation coefficients were found to be 0.9991, 0.9843, and 0.9813 for training, validation, and testing, respectively, illustrating that the model has been trained well and the predicted and experimental values fit well.
Figure 12. Architecture feed forward neural network with back propagation model used for the present study.
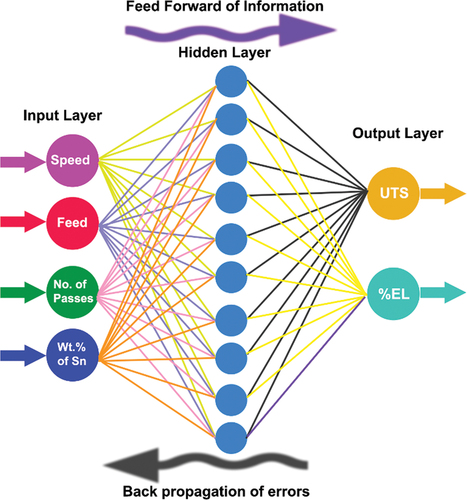
Figure 13. Scatter plots of predicted vs. actual values obtained from the RSM-ANN model in MATLAB®.
3.6. Discussion on limitations
The integration of ANOVA, RSM, and ANN in this research offers a comprehensive optimization framework, but each method has inherent limitations and biases that could impact results. ANOVA’s assumptions of normality and homogeneity of variances can lead to Types I and II errors if violated, potentially resulting in misleading conclusions about factor significance. Its focus on linearity and additivity might oversimplify complex interactions. RSM relies on polynomial models, which may not capture highly nonlinear relationships, and its effectiveness depends heavily on the chosen experimental design, risking suboptimal exploration and local optima identification. ANNs require large datasets for training, and insufficient data can lead to poor generalization. Additionally, ANNs are often seen as ‘black boxes,’ limiting interpretability, and are computationally intensive, which can restrict their practical use. Despite these limitations, combining these methods can mitigate some individual biases but introduces complexity in managing their integration.
4. Conclusion
The primary objective of this study was to optimize the process parameters of friction stir processing (FSP) to develop a surface alloy of ZK60 magnesium (Mg) alloy with tin (Sn) and to enhance its mechanical properties. In this work, response surface methodology was employed to predict the optimal FSP parameters to achieve maximum tensile strength and percentage of elongation in the Sn-reinforced ZK60 Mg alloy. Furthermore, a hybrid approach integrating RSM and artificial neural networks was utilized to improve prediction accuracy.
X-ray diffraction analysis revealed the presence of Mg2Sn peaks in the FSP zone of the ZK60 Mg alloy, confirming the successful formation of the Sn alloy. Optical and scanning electron microscopy images showed a significant reduction in grain size in the FSP region, and energy dispersive spectroscopy confirmed the presence of Sn.
The analysis of the results led to several conclusions. Among the FSP parameters evaluated, tool rotational speed (S) and feed rate (F) were identified as the most influential on ultimate tensile strength, whereas the number of passes (N) and the weight percentage of Sn (wt.% Sn) had minimal to no impact. For the percentage of elongation, all parameters except feed rate were influential, with the number of passes having the greatest effect. RSM proved to be an effective optimization tool, yielding optimal values for speed, feed rate, number of passes, and wt. % Sn as 2000 rpm, 0.39 mm/sec, 3 passes, and 8 wt. %, respectively. The regression equation obtained demonstrated high accuracy with an R2 value of 97.13%. The hybrid RSM-ANN approach further enhanced prediction efficiency, yielding correlation coefficients of 0.9991, 0.9843, and 0.9813 for training, validation, and testing respectively, indicating an excellent fit of the data.
Fractographic analysis of the tensile fracture sites revealed that an increase in feed rate led to a decrease in % elongation, whereas an increase in wt.% Sn resulted in improved elongation, indicating that Sn addition enhances ductility.
Disclosure statement
No potential conflict of interest was reported by the author(s).
References
- Adiga, K., Kumar Shettigar, A., Herbert, M. A., & Rao, S. S. (2024). Control factor optimization for friction stir processing of AA8090/SiC surface composites. https://doi.org/10.21203/rs.3.rs-4274038/v1
- Albaijan, I., Ahmed, M. M. Z., El-Sayed Seleman, M. M., Touileb, K., Habba, M. I. A., & Fouad, R. A. (2022). Optimization of Bobbin tool friction stir processing parameters of AA1050 using response surface methodology. Materials, 15(19), 19. https://doi.org/10.3390/ma15196886
- Bharti, S., Ghetiya, N. D., & Patel, K. M. (2023). Parametric optimization of process parameters during friction stir processing of AA5083/(SiC-gr) hybrid surface composite. Materials Today: Proceedings, 78, 420–29. https://doi.org/10.1016/j.matpr.2022.10.182
- Butola, R., Singari, R. M., Murtaza, Q., & Tyagi, L. (2022). Comparison of response surface methodology with artificial neural network for prediction of the tensile properties of friction stir-processed surface composites. Proceedings of the Institution of Mechanical Engineers, Part E: Journal of Process Mechanical Engineering, 236(1), 126–137. https://doi.org/10.1177/09544089211036833
- Chaudry, U. M., Noh, Y., Hamad, K., & Jun, T. S. (2022). Effect of deformation temperature on the slip activity in pure Mg and AZX211. Journal of Materials Research and Technology, 19, 3406–3420. https://doi.org/10.1016/j.jmrt.2022.06.050
- D Ghetiya, N., Bharti, S., Patel, K. M., Kumar, S., & Rahimian Koloor, S. S. (2023). An insight on optimization of FSP process parameters for the preparation of AA5083/(SiC-Gr) hybrid surface composites using the response surface methodology. Composites and Advanced Materials, 32. https://doi.org/10.1177/26349833231186162
- Gunasekaran, J., Sevvel, P., Vasanthe Roy, J., & Sivaramakrishnan, A. (2023). Analysis of sensitivity and formulation of empirical relationship between parameters of FSW process and tensile strength of AZ80A Mg alloy joints. Materials Research Express, 10(5), 056513. https://doi.org/10.1088/2053-1591/acd98f
- Huang, L., Paidar, M., Mohd Zain, A., Refaai, M. R. A., Abdullaev, S., & Šlapáková, M. (2024). Effect of processing environment during friction stir processing of AZ31/(ZrO2+CuO)p surface composite on the mechanical and tribological performance. Journal of Materials Research and Technology, 28, 1891–1899. https://doi.org/10.1016/j.jmrt.2023.11.222
- John Solomon, I., Sevvel, P., Gunasekaran, J., & Rajarajan, S. J. (2023). Establishment of empirical relations amidst mechanical attributes of friction stir welded distinctive alloys of Mg and optimized process parameters. Materials Research Express, 10(6), 6. https://doi.org/10.1088/2053-1591/acd5ae
- John Solomon, I., Sevvel, P., Gunasekaran, J., & Vasanthe Roy, J. (2023). Parametric based optimization of friction stir welded wrought AZ80A Mg alloy employing response surface methodology. Materials Research Express, 10(11), 116514. https://doi.org/10.1088/2053-1591/ad0ac4
- Kumar, A., & Kumar, V. (2023). Fabrication and optimization of AA7075- 7%SiC surface composites using RSM technique via friction stir processing. Journal of Alloys and Metallurgical Systems, 3, 3. https://doi.org/10.1016/j.jalmes.2023.100022
- Kumar, N., Singh, R. K., Srivastava, A. K., Nag, A., Petru, J., & Hloch, S. (2022). Surface modification and parametric optimization of tensile strength of Al6082/SiC/Waste material surface composite produced by friction stir processing. Coatings, 12(12), 12. https://doi.org/10.3390/coatings12121909
- Kumar, R., Mehrotra, N., & Pal, K. (2024). Effect of friction stir processing on mechanical, in vitro degradation, and biocompatibility behaviour of stir casted Mg-Zn-Rare earth oxide composites for biodegradable implant applications. Journal of Alloys and Compounds, 972, 972. https://doi.org/10.1016/j.jallcom.2023.172767
- Li, B., Sun, X., Chen, H., Yang, Y., Luo, Q., Yang, X., Chen, Y., Wei, G., Li, Q., & Pan, F. (2024). Enhancing Mg-li alloy hydrogen storage kinetics by adding molecular sieve via friction stir processing. Journal of Materials Science and Technology, 180, 45–54. https://doi.org/10.1016/j.jmst.2023.04.051
- Li, Y., Ojo, O. O., Salman, S., Paidar, M., Refaai, M. R. A., Zain, A. M., Nasution, M. K. M., & Xin, D. (2023). Fabrication of the novel hybridized AZ31B Mg/CeO2+ZrO2 composites via multiple pass friction stir processing. Journal of Materials Research and Technology, 24, 9984–10004. https://doi.org/10.1016/j.jmrt.2023.05.170
- Lingampalli, B., & Dondapati, S. (2024). Solid-state surface alloying of ZK60 Mg alloy with tin using friction stir processing. Materials Technology, 39(1), 1. https://doi.org/10.1080/10667857.2024.2318886
- Liu, Q., Chen, X., Liu, K., Cristino, V. A. M., Lo, K. H., Xie, Z., Guo, D., Tam, L. M., & Kwok, C. T. (2024). Influence of processing parameters on microstructure and surface hardness of hypereutectic Al-Si-Fe-Mg Alloy via Friction Stir Processing. Coatings, 14(2), 222. https://doi.org/10.3390/coatings14020222
- Mao, W., Paidar, M., Vaira Vignesh, R., Kharche, N. A., Mohanavel, V., & Mohd Zain, A. (2024). Exploring the impact of vibration on the tribological and mechanical performance of friction stir processing of AZ80/(MnO + ZrO2)p surface composite. Materials Letters, 358, 135794. https://doi.org/10.1016/j.matlet.2023.135794
- Marode, R. V., Awang, M., Lemma, T. A., Pedapati, S. R., Hassan, A., Janga, V. S. R., Alam, M. A., Loyte, A., & Devarajan, Y. (2024). Friction stir processing of AZ91 hybrid composites with exfoliated multi-layered graphene: A taguchi-grey relational analysis. Journal of Alloys and Compounds, 972, 172703. https://doi.org/10.1016/j.jallcom.2023.172703
- Mehdizade, M., Eivani, A. R., Esmaielzadeh, O., & Rostamian, P. (2024). ZnO and Cu/ZnO-modified magnesium orthopedic implant with improved osteoblast cellular activity: An in-vitro study. Journal of Materials Research and Technology, 28, 935–950. https://doi.org/10.1016/j.jmrt.2023.12.027
- Murugan, N., & Parmar, R. S. (1994). Effects of MIG process parameters on the geometry of the bead in the automatic surfacing of stainless steel. Journal of Materials Processing Technology, 41(4), 381–398. https://doi.org/10.1016/0924-0136(94)90003-5
- Pravina, R., Uthayakumar, H., & Sivasamy, A. (2023). Hybrid approach based on Response Surface Methodology and Artificial Neural Networks Coupled with Genetic Algorithm (RSM-GA-ANN) for the prediction and optimization for the photodegradation of dye using nano ZnO anchored glass fiber under solar light irradiation. Journal of the Taiwan Institute of Chemical Engineers, 153. https://doi.org/10.1016/j.jtice.2023.105248
- Radha, R., & Sreekanth, D. (2017). Insight of magnesium alloys and composites for orthopedic implant applications – a review. Journal of Magnesium and Alloys, 5(3), 286–312. https://doi.org/10.1016/j.jma.2017.08.003
- Radha, R., & Sreekanth, D. (2020). Mechanical and corrosion behaviour of hydroxyapatite reinforced Mg-sn alloy composite by squeeze casting for biomedical applications. Journal of Magnesium and Alloys, 8(2), 452–460. https://doi.org/10.1016/j.jma.2019.05.010
- Ragunath, S., Radhika, N., Krishna, S. A., & Rajeshkumar, L. (2024). A study on microstructural, mechanical properties and optimization of wear behavior of friction stir processed AlCrCoFeNi high entropy alloy reinforced SS410 using response surface methodology. Heliyon, 10(2), e24429. https://doi.org/10.1016/j.heliyon.2024.e24429
- Sahu, N. K., & Andhare, A. B. (2019). Multiobjective optimization for improving machinability of Ti-6Al-4V using RSM and advanced algorithms. Journal of Computational Design and Engineering, 6(1), 1–12. https://doi.org/10.1016/j.jcde.2018.04.004
- Saravanakumar, S., Prakash, K. B., Dinesh, D., Manoj Kumar, P., Fouad, Y., Soudagar, M. E. M., Ali, M. M., & Bashir, M. N. (2024). Optimizing friction stir processing parameters for aluminium alloy 2024 reinforced with SiC particles: A taguchi approach of investigation. Journal of Materials Research and Technology, 30, 4847–4855. https://doi.org/10.1016/j.jmrt.2024.04.066
- Satheesh, C., Sevvel, P., & Kumar, R. S. (2020). Experimental identification of optimized process parameters for Fsw of Az91c Mg alloy using quadratic regression models. Strojniski Vestnik/Journal of Mechanical Engineering, 66(12), 736–751. https://doi.org/10.5545/sv-jme.2020.6929
- Sevvel, P., & Jaiganesh, V. (2016). Impact of process parameters during friction stir welding of AZ80a Mg alloy. Science and Technology of Welding and Joining, 21(2), 83–90. https://doi.org/10.1179/1362171815Y.0000000068
- Sevvel, P.; Satheesh, C. (2018). Role of tool rotational speed in influencing microstructural evolution, residual-stress formation and tensile properties of friction-stir welded AZ80A Mg alloy. Materiali in tehnologije, 52(5), 607–614. https://doi.org/10.17222/mit.2017.213
- Shi, D. F., Ma, A., Pérez-Prado, M. T., & Cepeda-Jiménez, C. M. (2023). Activation of second-order pyramidal slip and other secondary mechanisms in solid solution Mg-Zn alloys and their effect on tensile ductility. Acta Materialia, 244, 118555. https://doi.org/10.1016/j.actamat.2022.118555
- Tyagi, L., Butola, R., Kem, L., & Singari, R. M. (2021). Comparative analysis of response surface methodology and artificial neural network on the wear properties of surface composite fabricated by friction stir processing. Journal of Bio- and Tribo-Corrosion, 7(2). https://doi.org/10.1007/s40735-020-00469-1
- Vasantha Kumar, V., & Murugan, N. (2011). Effect of FCAW process parameters on weld bead geometry in stainless steel cladding. Journal of Minerals and Materials Characterization and Engineering, 10(9), 827–842. https://doi.org/10.4236/jmmce.2011.109064
- Vignesh Kumar, M., Padmanaban, G., & Balasubramanian, V. (2020). Role of tool pin profiles on wear characteristics of friction stir processed magnesium alloy ZK60/Silicon carbide surface composites. Materwiss Werksttech, 51(2), 140–152. https://doi.org/10.1002/mawe.201900007
- Wu, B., Yusof, F., Li, F., Miao, H., Bushroa, A. R., Muhamad, M. R. B., Badruddin, I. A., Ibrahim, M. Z. (2023). Effects of friction stir processing and nano-hydroxyapatite on the microstructure, hardness, degradation rate and in-vitro bioactivity of WE43 alloy for biomedical applications. Journal of Magnesium and Alloys, 12(1), 209–224. https://doi.org/10.1016/j.jma.2023.10.010
- Yue, S., Huang, J., Ni, Y., Shen, L., Huang, Y., Fan, D., & Liu, J. (2024). Enhancing microstructural, mechanical, and tribological behavior of AZ31B magnesium alloy through friction stir processing. Journal of Materials Research and Technology, 29, 1441–1452. https://doi.org/10.1016/j.jmrt.2024.01.182