
ABSTRACT
Accounting studies have inconsistent conclusions about whether including Key Audit Matters (KAM) improves the communicative value of audit reports. We experimentally investigate the joint effect of investors’ trait scepticism and the familiarity and readability of KAM on the communicative value of audit reports. Our results indicate that KAM readability enhances the communicative value of audit reports for less (more) sceptical investors when they are less (more) familiar with the issues discussed in the KAM. Additionally, using an eye-tracking device, we find that the communicative value of audit reports for nonprofessional investors depends on their visual attention paid to the KAM. These findings show that the positive effect of including KAM in audit reports is contingent on the user’s trait scepticism and the content and form of the KAM. Our conclusions should be of interest to regulators and auditors when considering what and how to communicate to different financial statement users.
1. Introduction
Traditional audit reports have been criticised for their standardised content and limited communicative value (Church et al., Citation2008; Moroney et al., Citation2021), which make it difficult for stakeholders to obtain valuable information for decision-making (Bédard et al., Citation2016; Gold et al., Citation2012). Since 2016, worldwide institutions and regulators (e.g. Ministry of Finance in China and the International Auditing and Assurance Standard Board (IAASB)) begin to introduce a new reporting model, requiring auditors to communicate KAM in the audit reports. KAM provide users with the most significant issues in an audit of financial statements (the ‘Why’ paragraph) and offer guidance on how auditors deal with these issues (the ‘How’ paragraph) to help investors and other stakeholders learn about the auditing process and better acquire information from complex financial reports (Sirois et al., Citation2018).
By including KAM in audit reports, regulators and standard-setters aim to enhance the communicative value of audit reports and provide financial statement users with additional information to inform their decision-making (IAASB, Citation2011, Citation2013, Citation2015; PCAOB, Citation2016). However, conclusions of academic research on how KAM affect investors’ judgements and decision-making are inconsistent. Some studies show that KAM enhance investors’ understanding of audit reports and their investment confidence (Kipp, Citation2017; Köhler et al., Citation2020; Moroney et al., Citation2021; Reid et al., Citation2019). Other studies hold the opposite view, positing that KAM reduce invest intentions of non-professional investors (Christensen et al., Citation2014; Kachelmeier et al., Citation2017; Rapley et al., Citation2021). Although regulators require auditors to include KAM in the audit report, the form and content of KAM are not explicitly mandated. More and more studies focus on the effect of contingency factors (e.g. visual cues, tone, the number of KAM, audit firm size, and the investment professionals) on the communicative value of audit reports containing KAM (Dennis et al., Citation2019; Köhler et al., Citation2020; Moroney et al., Citation2021; Sirois et al., Citation2018).
As an information carrier, the communicative value of KAM is contingent on the characteristics of both the KAM and the information users. However, previous studies pay overwhelmingly attention on KAM characteristics, ignoring the characteristics of information users. There is limited understanding of the interactive effect of investor traits and the characteristics of KAM on the informational and communicative value of KAM-containing audit reports. To fill the gap, this study experimentally investigates how investors’ trait scepticism and KAM’s familiarity and readability jointly affect the communicative value of audit reports. Information does not affect decision-making directly; rather, it needs to be processed by users first (Chen et al., Citation2016; Clement, Citation2007). If it is not processed by the users, information has little impact on their decision-making, which indicates that the communicative value of KAM-containing audit reports depends on investors’ willingness to process the information disclosed in KAM.
Hidi (Citation1990) proposes that interests determine how individuals obtain and process information, and she divides interests into individual interest and situational interest. In this study, trait scepticism measures investors’ individual interest in searching information. More sceptical investors show greater individual interest than their less sceptical counterparts (Naess, Citation1969). The familiarity of KAM measures investors’ situational interest in seeking information of KAM. When investors are less familiar with the content of KAM, they perceive a larger discrepancy between their current state of knowledge and the state of knowledge required to understand the audit works, inducing greater situation interest to read and learn about the KAM than when they are more familiar with it (Moore & Lehmann, Citation1980; Snyder & Stukas, Citation1999; Srinivasan & Ratchford, Citation1991). We predict that readability of KAM, which induces a sense of processing fluency, will improve investors’ information processing behaviour only when their individual or situational interest is high. But the impact of readability disappears when both investors’ individual and situational interests are high or when both are low.
In line with our hypotheses, we find that when investors are less familiar with the issues discussed in the KAM, readability has a greater impact on less sceptical investors’ visual attention paid to the KAM. More sceptical investors, who are motivated by both individual and situational interests, spend similar time and effort to process KAM regardless of its readability. In contrast, when investors are more familiar with the issues discussed in the KAM, readability has a greater impact on more sceptical investors’ visual attention on KAM. Meanwhile, less sceptical investors, who are motivated by neither individual nor situational interests, exhibit little interest in dealing with the information in the KAM, spending less time and effort to read and understand them, irrespective of readability.
Additionally, we analyse the underlying mechanism through which communicative value of KAM-containing audit reports changes. For more familiar KAM, we find a positive relationship between visual attention paid to ‘How’ paragraph and the communicative value of the KAM. When investors are more familiar with the issues discussed in the KAM, they have already known the related accounting standards and treatments which are specified in the ‘Why’ paragraph; thus, only the ‘How’ paragraph, which describes the detailed auditing procedure, provides additional information for them. Hence, higher readability of KAM increases more sceptical investors’ attention to KAM when they are more familiar with the KAM, whereas only the increased attention paid to the ‘How’ paragraph improves their perceived communicative value of the audit report. However, when investors are less familiar with the KAM, we find that both the ‘Why’ and ‘How’ paragraphs provide them new information. Our results show that less sceptical investors expend more effort to process more readable KAM, and increased attention paid to both ‘Why’ and ‘How’ paragraphs improves their perceived communicative value of the audit report.
Our study makes three contributions to the literature. First, we extend the KAM literature by investigating the joint effect of investors’ trait characteristics and KAM’s form and content on the communicative value of audit reports. Our results provide an explanation to reconcile the inconsistent conclusions of previous studies regarding the effect of KAM by considering contingency factors from the viewpoint of individual and situational interests. Second, we reveal the role of visual attention in investors’ perceived communicative value of the audit report by using the eye-tracking device. Third, our findings have great implications for regulators to evaluate the effect of including KAM in the audit reports and for auditors to select and present KAM in the audit reports.
In Section II, we review the relevant literature and develop our guiding hypotheses. Section III describes the experimental method and design. Section IV presents the results. Section V concludes.
2. Theory and hypotheses
2.1. Information seeking behaviour
Information seeking is the purposive acquisition of information related to learning and problem solving (Savolainen, Citation2019), where interests are needed for people to select and process certain types of information (Bowler, Citation2010; Hidi, Citation1990). Hidi (Citation1990) separates interest into situational interest and individual interest: situational interest is evoked by the characteristics of tasks and environments, while individual interest depends on personal traits and preferences. Information seeking occurs either when a person has an individual interest in new information or when a person recognises a situational interest to narrow the discrepancy between their state of knowledge and the criterion state (Zerbinos, Citation1990).
Information seeking begins with situational interest, which is a need or necessity for information (Afifi & Weiner, Citation2004; Case & Given, Citation2016; Lu & Yuan, Citation2011). People perceive a need to seek information when details of a situation are ambiguous and complicated. Familiarity plays an important role in individuals’ decision to seek information. When people are familiar with a task or environment, they feel less anxious and believe that their current state of knowledge is sufficient to solve the problem and therefore have less situational interests to acquire and process new information (Moore & Lehmann, Citation1980; Srinivasan & Ratchford, Citation1991; Wood & Lynch, Citation2002). People who already know about a situation are susceptible to overconfidence, heuristic processing, and the ‘feeling-of-knowledge’ effects. Many marketing studies posit that consumers are less likely to engage in extensive information exploration regarding a product when they are exposed to an advertisement by a familiar brand (Keller, Citation1991; MacKenzie & Spreng, Citation1992; Snyder & Stukas, Citation1999). For example, Wood and Lynch (Citation2002) find that consumers with high prior knowledge are less likely to learn about a new product than those with less prior knowledge. Hence, they prefer to recall problem solutions rather than develop solutions based on the new information.
Individual interests also lead to different level of information seeking (Mikulincer, Citation1997). Trait scepticism measures decision makers’ tendency to discover and collect new information (Cohen et al., Citation2017; Hurtt, Citation2010; Quadackers et al., Citation2014). Prior auditing literature finds that auditors with higher level of trait scepticism are likely to require more evidence before making decisions and judgements (Hurtt, Citation2010; Naess, Citation1969). Compared with those with lower level of trait scepticism, more sceptical people show greater individual interests in experiencing new scenarios and discovering new information (Bowler, Citation2010; Collins et al., Citation2004; Litman, Citation2005; White & Roth, Citation2009).
In addition to interests, processing difficulty is another important determinant of individuals’ information seeking. Low readability increases processing difficulty (Tan et al., Citation2014, Citation2015). People tend to engage in heuristics processing and make judgements intuitively if the information is too complicated to process. For example, Tan et al. (Citation2014) find that non-professional investors are more likely to be misled by the sentiment portrayed in the wording of disclosure when financial disclosure is difficult to read. Dennis et al. (Citation2019) extend this stream of literature to KAM and find that non-professional investors find it more difficult to absorb information in KAM that are presented in a fully narrative form compared to KAM presented with several visual cues.
2.2. Less familiar KAM
As shown in , when investors are less familiar with the issue discussed in KAM, they have little prior knowledge about the recognition and measurement of the issue. Therefore, investors perceive a large discrepancy between their current state of knowledge and the state of knowledge required to understand the audit works, which induces strong situational interest to seek information in KAM. For investors who are more sceptical, they are motivated by both situational and individual interests when dealing with the KAM which they are less familiar with. These investors show great interests in searching information to support their evaluation of the audit report. They tend to pay great attention to processing information of the KAM no matter it is difficult to read or not. We propose that processing difficulty will not affect investors’ information seeking behaviour when they are motivated by both individual and situational interests.
Figure 1. The effect of internal interest, external interests, and process difficulty on information processing Behaviour” to “The effect of individual interest, situational interest, and process difficulty on information processing behaviour.
However, investors who have lower level of trait scepticism are motivated by only situational interest, showing less willingness to seek information than more sceptical investors. Under this circumstance, their information seeking behaviour depends on the processing difficulty. When the less familiar KAM is difficult to read, it takes greater cognitive effort to process the information, and thus weakening investors’ situational interest. They tend to devote less attention to processing and understanding the information in less familiar KAM. When investors are motivated by only situational interest, processing difficulty will reduce their information seeking behaviour. Hence, we propose the first hypothesis regarding investors’ information seeking behaviour towards KAM they are less familiar with as follows:
H1: Investors devote less attention to seeking information in less familiar KAM when the KAM are difficult to read than easy to read, and this difference is larger when the investors are less sceptical.
2.3. More familiar KAM
As shown in , when investors are more familiar with the issue discussed in KAM, there is a smaller gap between their current state of knowledge and the state of knowledge required to understand the audit works, which lowers their situational interest in exploring and learning the information in the KAM. Investors believe that more familiar KAM do not provide them new and valuable information and therefore tend to spend less time and cognitive effort to process the information in the KAM.
For less sceptical investors, they are motivated by neither individual nor situational interest when they are processing the KAM they are more familiar with. These investors are less likely to spend cognitive effort on the more familiar KAM regardless of the processing difficulty. They prone to ignore the KAM and engage in heuristic processing, relying on their current state of knowledge and prior attitude to make judgements and decisions instead of reaching out for the new information disclosed in the KAM.
In contrast, more sceptical investors, who are still motivated by individual interest, display greater information seeking even if they are familiar with the issues discussed in the KAM. However, unlike more sceptical investors processing KAM they are less familiar with, they are motivated only by individual interest when interpreting more familiar KAM. Therefore, their interests in seeking new information in the KAM largely depends on processing difficulty. High readability will increase their willingness to search information of the KAM they are more familiar with. Hence, we propose our second hypothesis regarding investors’ information seeking behaviour towards KAM they are more familiar with as follows
H2: Investors devote less attention to seeking information in more familiar KAM when those KAM are difficult to read than easy to read, and this difference is larger when the investors are more sceptical.
2.4. How information processing affects investors’ decision making
Birnberg and Shields (Citation1984) identify the important role that attention plays in people’s judgement and decision-making. They propose that an individual’s attention is first affected by the characteristics of information, which in turn has an impact on their decision-making. A positive relationship between the attention paid to the information and its perceived value and importance during decision-making is found by prior studies (Chen et al., Citation2016; Lynch & Andiola, Citation2019). Managers have less bias in subjective performance evaluation when they devote more attention to information processing (Fehrenbacher et al., Citation2018). The more attention a person invests in processing information, the better he/ she understands the information. Marketing research also documents the aforementioned positive relationship based on consumers’ purchasing behaviour (Clement, Citation2007). Therefore, in this study, we predict that the more attention an investor puts in processing the KAM, the more the KAM influences their investment decisions, which increases the communicative value of the audit report.
Hypotheses 1 and 2 predict that readability increases the KAM focus of investors who have only individual or situational interest. For investors whose both individual and situational interests are high or both are low, the positive effect of readability disappears. Based on the discussion above, we predict that the readability increases the KAM focus of less (more) sceptical investors when they are less (more) familiar with the KAM, which in turn improves the communicative value of the audit report. However, the readability of KAM has little impact on the communicative value of the audit report when less (more) sceptical investors are processing the KAM they are more (less) familiar with. Hence, we propose the third and fourth hypotheses as follows:
H3: Compared with audit reports containing low-readability KAM, audit reports containing high-readability KAM have stronger communicative value for less sceptical investors when the KAM is less familiar to them, and this effect operates through the increased attention paid to the KAM.
H4: Compared with audit reports containing low-readability KAM, audit reports containing high-readability KAM have stronger communicative value for more sceptical investors when the KAM is more familiar to them, and this effect operates through the increased attention paid to the KAM.
3. Method
3.1. Experimental design
We implemented a 2*2*2 between-subjects experiment for two times. The first between-subjects factor is the familiarity of the issue discussed in the KAM. We manipulate it by setting the content of KAM as either goodwill impairment (less familiar KAM) or fixed assets impairment (more familiar KAM).
The second between-subjects factor is readability of KAM. We manipulate this factor by modifying the presentation form of the KAM. Tabular displays and textual displays are the two main presentation formats of KAM in China. In 2020, half of the audit reports in China provided tabular KAM and the other half provided textual KAM. When the KAM are displayed in tabular form, ‘Why’ and ‘How’ paragraphs are presented horizontally with the ‘Why’ paragraph on the left and the ‘How’ paragraph on the right (see example in A1). When the KAM are displayed in text narrative form, ‘Why’ and ‘How’ paragraphs are presented vertically with the ‘Why’ paragraph at the top and the ‘How’ paragraph at the bottom (see examples in A2). On the one hand, information presented in tabular form is easier to read than narrative information (Dilla & Janvrin, Citation2010; Kelton et al., Citation2010). Individuals tend to be attracted by tabular information rather than narrative information (Zhang, Citation2020). On the other hand, horizontal displays are easier to process than vertical displays because they match the dominant direction of eye movements (Deng et al., Citation2016; Graham, Citation1956; Shi et al., Citation2013). Williams (Citation1966) finds that the muscles that control horizontal eye movements are stronger than those that control vertical eye movements. Reading from top to bottom causes a more rapid decline in the resolution of the retina than reading side to side (Gilchrist & Harvey, Citation2006). Relative to vertically displayed information, people take in horizontally displayed information more rapidly (Deng et al., Citation2016) and process it more fluently (Bettels et al., Citation2020; Duan & Meng, Citation2021). Therefore, tabular KAM provides high readability for investors and textual KAM provides low readability for investors.
The third between-subject factor is investors’ trait scepticism. We measure this based on their score of Hurtt Professional Scepticism Scales (HPSS, Hurtt, Citation2010). We divide participants into a more sceptical group and a less sceptical group based on the median score. The average scores for the more and less sceptical groups are 142.83 and 119.49 (p = 0.000), respectively.Footnote1
shows our experimental design. In the first round, each participant was randomly assigned to one of the four conditions: More familiar KAM with High readability, Less familiar KAM with Low readability, Less familiar KAM with High readability, and More familiar KAM with Low readability. To obtain more observation, we asked participants to take part in the second round, during which both readability of familiarity of KAM they read are different from the first round.
Figure 2. Overall experimental design.
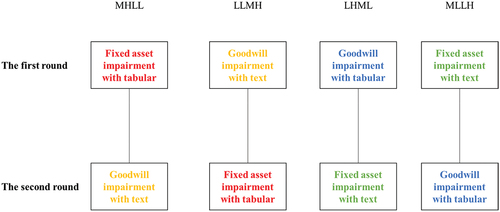
We define our experimental design as implementing a 2*2*2 between-subjects experiment for two times rather than a 2*2*2 within-subjects design for the following reasons. First, each participant in our study took part in two rounds of a between-subjects experiment. In each round of the experiment, they were randomly assigned to only one level of both readability, familiarity, and trait scepticism. Second, the experiment can be viewed and analysed as a between-subjects design even if participants experience more than one level of the manipulated factors when they treat each round of experiments independently (Charness et al., Citation2012). Specifically, we can make it a between-subjects analysis if order effect has little impact on participants’ behaviour and judgements.
In our study, order effects exist if a participant in the MHLL (MLLH) condition pays more visual attention or perceives lower material misstatement risk of the more/less familiar KAM than a participant in the LLMH (LHML) condition. To test for order effects, the dependent measures of visual attention paid to the KAM and communicative value of the audit report are compared between MHLL and LLMH and between MLLH and LHML. A2 suggests that no significant differences between any pairs of conditions for any variables. These results indicate that the participants evaluate the two rounds of KAM independently, and no order effects exist in our experiment.
Additionally, we examine whether our findings hold when we exclude data from the second round. We only use participants’ visual attention and risk evaluation of MH (LL) [LH] {ML} in the MHLL (LLMH) [LHML] {MLLH} condition. A3-1A8 show that similar results are obtained when we include the whole sample for the date from both the first and second round data, which provides further evidence that participants view the KAM in the two rounds independently and no order effects exist in our experiment.
3.2. Participants
Seventy-eight financial staff taking lessons at the Quality Improvement Project of Chief Accountants in Large and Medium-size Enterprises and institutions participated in our experiment. Our experiment focuses on non-professional investors, which play a critical role in capital market. Therefore, academic studies pay increasing attention to non-professional investors’ judgements and decision-making (Christensen et al., Citation2014; Elliott et al., Citation2018; Emett, Citation2019; Tan et al., Citation2014). Libby et al. (Citation2002) suggests that participants with basic accounting and investing knowledge are suitable for experiments focusing on non-professional investors. In our experiment, 56.4% of the participants had audit experience, 94.9% of the participants had read the audit report before, 74.4% had paid attention to KAM in an audit report, and 83.3% had used audit reports to invest. Hence, we believe that our participants are reasonable proxies for non-professional investors.
An eye-tracking device was set up in an office at the experiment office. Participants took the experiment individually during their spare time. As shown, 51.28% of the participants were female. They had an average age of 43.65 years old and had worked for an average of 18.74 years. All demographic factors exhibit insignificant differences between the different experimental conditions, indicating successful randomisation.
3.3. Apparatus
We used a desktop-mounted Gazepoint GP3 eye-tracker (Gazepoint, Vancouver, BC, Canada; www.gazept.com; dimensions: 320 mm × 45 mm) to record participants’ visual attention during the task. The device was placed below a 20-in computer monitor, on which an audit report was displayed, to track the eye movements of the participants, who sat directly in front of the monitor. The eye-tracker sampled at 60 Hz and the raw eye-tracking data were collected and analysed using the analysis software provided with the eye-tracking device.
3.4. Procedure
Before the experiment, each participant was required to complete the HPSS within five minutes. And they were led to the computer and performed a calibration procedure to ensure that the eye-tracker can capture their pupils successfully.
In the experiment, participants were required to read two KAM and rate their perceived risk of material misstatement of the KAM issues, respectively. The KAM discussing the goodwill impairment was adopted from the 2017 audit report of Beijing Capital Co., Ltd., and the KAM discussing the fixed asset impairment was adopted from an audit report of Sany Heavy Industry Co., Ltd. In the original audit reports, the auditors stated different reasons why they selected these two accounting issues as the KAM in the ‘Why’ paragraph and different instructions for how to deal with these issues. To avoid the effect of content in the ‘Why’ and ‘How’ paragraphs on investors’ perception of the communicative value of the audit report, we modified and kept the content of ‘Why’ and ‘How’ paragraphs of the two KAMs the same.
After the experiment, participants were asked to complete a post-experiment questionnaire including questions about manipulation checks and their demographic information. Finally, each participant can take two books with them as a gift for taking part in our experiment.
3.5. Measurement of visual attention: eye-tracking device
The development of eye-tracking technology provides a good opportunity for researchers to open the black box of the process of information understanding by measuring individuals’ visual attention (Rayner, Citation1998). Kahneman (Citation1973) notes that the cognitive effort used to process and understand information can be captured using eye fixation and eye movement data. When a person’s eye is fixated on certain information, the brain takes time to understand the relationship between the information and the goals (Monk, Citation1984). Longer eye fixations indicate deep processing, deliberate consideration, and information integration, whereas short fixations lead to superficial cognitive processing and little information extraction (Fehrenbacher et al., Citation2018; Glöckner & Herbold, Citation2011; Lynch & Andiola, Citation2019). A larger number of eye fixations indicates a greater relative importance of the information in decision-making (Fiedler et al., Citation2013; Fiske, Citation1980). In this study, we use the number of fixation to measure participants’ visual attention.
3.6. Dependent and mediating variables
3.6.1. Communicative value of the audit report
Each participant was required to evaluate the risk of material misstatement in the two KAM, respectively, on a scale of 1 (the risk of material misstatement is very low) to 9 (the risk of material misstatement is very high).Footnote2 The communicative value of an audit report refers to the extent to which it achieves its objectives (Coram et al., Citation2011). Companies aim to increase investors’ perceived credibility of the audit report by including the KAM (Velte & Issa, Citation2019). Following Köhler et al. (Citation2020) and Coram et al. (Citation2011), we calculate the communicative value of the KAM-containing audit reports by subtracting investors’ judgement of the material misstatement risk from 10; the higher the score, the better communicative value the KAM-containing audit report is assumed to have.
3.6.2. Attention paid to the ‘why’ paragraph
As show, Zone A is the area where contains the information of ‘Why’ paragraph presented in tabular form and text narrative form, respectively. We take the total number of fixations on Zone A as the proxy for the attention paid to the ‘Why’ paragraph. The more fixation number occurs in the ‘Why’ paragraph, the more attention an individual paid to process the information in the ‘Why’ paragraph.
Figure 3. The AOIs definition of KAM in tabular form.
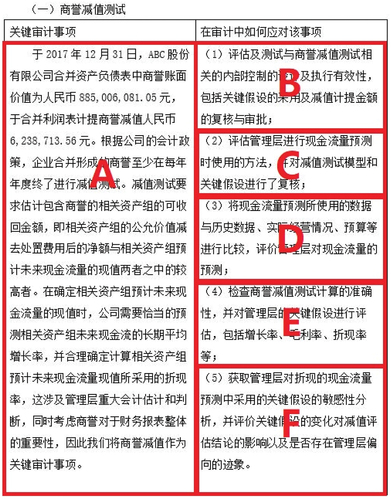
Figure 4. The AOIs definition of KAM in narrative form.

3.6.3. Attention paid to the ‘how’ paragraph
As show, Zones B-F are the areas where contains the information of ‘How’ paragraph presented in tabular form and text narrative form, respectively. We take the total number of fixations on Zones B–F as the proxy for the attention paid to the ‘How’ paragraph. The more fixation number occurs in the ‘How’ paragraph, the more attention an individual paid to process the information in the ‘How’ paragraph.
4. Results
4.1. Manipulation check
In the post-experiment questionnaire, all participants were required to answer the questions, ‘Is the Key Audit Matter discussing goodwill impairment presented in tabular form?’ and ‘Is the Key Audit Matter discussing fixed asset impairment presented in tabular form?’ All participants in the high-readability group correctly answered ‘Yes’ and all of the participants in the low-readability group correctly answered ‘No’, indicating that all the participants correctly perceived the form of the KAM we manipulated. Additionally, we invited another 41 subjects with similar demographic characteristicsFootnote3 as those participated in the main experiment to evaluate the readability of KAM presented in tabular/text form. Each participant was randomly assigned into one of two conditions. Twenty-one participants were asked to read a more familiar KAM with high readability (presented in tabular form), and the remaining participants were asked to read a more familiar KAM with low readability (presented in text form). Each participant evaluated the extent to which they think the message is difficult to read/difficult to understand/difficult to process on a 9-point Likert scale, ranging from 0 (‘extremely easy’) to 9 (‘extremely difficult’). The mean ratings in the high-readability condition (low-readability condition) are 4.38 (5.95)/4.43 (5.90)/5.29 (6.25) for the difficult to read/understand/process measures, respectively. The mean ratings in the high-readability condition are significantly lower than that in the low-readability condition (p = 0.015/0.010/0.069 for the difficult to read/understand/process, two-tailed). These results provide evidence that our manipulation of readability is successful.
In the questions ‘To what extent are you familiar with the provisions of goodwill impairment’ and ‘To what extent are you familiar with the provisions of fixed asset impairment’, participants were required to rate their familiarity of these two KAM items on a scale of 1 (Not familiar at all) to 9 (Very familiar). The average scores for goodwill impairment and fixed asset impairment were 4.69 and 6.18, indicating that participants believe that they are more familiar with fixed asset impairment than goodwill impairment (p = 0.000). These results show that our manipulation of familiarity is successful.Footnote4
4.2. Hypotheses testing
4.2.1. All investors
We measure the visual attention the participants devoted to processing the KAM by summing the total fixation numbers for the ‘Why’ and ‘How’ paragraphs. The descriptive statistics are presented in Panel A of . When investors are less familiar with the issue discussed in the KAM, there is no discernible effect of readability for more sceptical investors (average fixation number of 214.76 for the high-readability group and 227.25 for the low-readability group). Investors with lower trait scepticism is more vulnerable to KAM’s readability (average fixation number of 257.68 for the high-readability group and 138.23 for the low-readability group). The increased difficulty of information processing weakens investors’ willingness to pay attention to. In contrast, when investors are more familiar with the issue discussed in the KAM, their readability does not affect the visual attention that less sceptical investors paid to them (average fixation number of 215.44 for the high-readability group and 203.21 for the low-readability group). However, the visual attention that more sceptical investors paid to process the KAM largely depends on KAM’s readability (average fixation number of 306.79 for the high-readability group and 163.53 for the low-readability group).
Table 2. All participants’ visual attention on the KAM.
To test our hypotheses, we conduct a three-way analysis of variance (ANOVA) with investors’ trait scepticism, the readability of the KAM, and the familiarity of the KAM as the independent variables, and the attention investors pay to the KAM as the dependent variable. The results are shown in Panel B of . We found a significant three-way interaction effect (F = 7.70). Next, we examine how investors’ trait scepticism and the readability of the KAM influenced the attention investors paid to the KAM.
4.2.2. Test of H1: less familiar KAM
H1 posits that when dealing with less familiar KAM, less sceptical investors, who are motivated by only situational interest, will reduce their visual attention to KAM when it is difficult to read. However, more sceptical investors, who are motivated by both individual and situational interest, will devote similar visual attention to process KAM no matter it is difficult to read or not. To test H1, we first conduct an ANOVA with investors’ trait scepticism and the readability of the KAM as the independent variables and the visual attention investors paid to the KAM as the dependent variable. The descriptive statistics, ANOVA results, and simple effects are presented in Panels A, B, and C of , respectively. The results in support H1. Specifically, we observe a marginally significant main effect of KAM readability (average fixation number of 237.42 for the high-readability group vs. 189.10 for the low-readability group, F = 2.58) and an insignificant main effect of investors’ trait scepticism (average fixation number of 227.07 for more sceptical investors vs. 199.57 for less sceptical investors, F = 0.48). Additionally, we find a significant interaction effect of investors’ trait scepticism and KAM readability on the attention that investors paid to less familiar KAM (F = 3.92).
Table 3. Participants’ Visual Attention on Less Familiar KAM.
The results of the simple effects tests show that for less familiar KAM, less sceptical investors paid less attention to the KAM when they are more difficult to read. The results of the simple effects tests show that the average fixation number of KAM for low trait scepticism/high readability is 257.68, which is significantly higher than that for low trait scepticism/low readability (138.23; F = 6.20); meanwhile, the average fixation number of KAM for high trait scepticism/high readability is 214.76, which is slightly lower than that for high trait scepticism/low readability (227.25; F = 0.07). These results support H1.
4.2.3. Test of H2: more familiar KAM
H2 predicts that when dealing with more familiar KAM, less sceptical investors, who are motivated by neither situational and individual interest, will devote little attention to KAM no matter it is difficult to read or not. However, more sceptical investors, who are still motivated by individual interest, will increase their attention to process KAM when it is easy to read. To test H2, we first conduct an ANOVA with investors’ trait scepticism and KAM readability as the independent variables and the visual attention investors paid to KAM as the dependent variable. The descriptive statistics, ANOVA results, and simple effects are shown in Panels A, B, and C of , respectively. The results in support H2. Specifically, we observe a significant main effect of KAM readability (average fixation number of 267.64 for the high-readability group vs. 184.47 for the low-readability group; F = 5.33) and an insignificant main effect of investors’ trait scepticism (average fixation number of 247.39 for more sceptical investors vs. 209.21 for less sceptical investors; F = 0.59). Additionally, we find a significant interaction effect of investors’ trait scepticism and KAM readability on the attention that investors paid to more familiar KAM (F = 3.78).
Table 4. Participants’ Visual Attention on More Familiar KAM.
The results of the simple effects tests show that when investors are exposed to more familiar KAM, more sceptical investors paid more attention to KAM that are easy to read. The results of the simple effects tests show that the average fixation number for KAM for high trait scepticism/high readability was 306.79, which is significantly higher than that for high trait scepticism/low readability (163.53; F = 9.39); meanwhile, the average fixation number for KAM for low trait scepticism/high readability is 215.44, which is slightly higher than that for low trait scepticism/low readability (203.21; F = 0.06). These results support H2.
4.2.4. Test of H3 and H4: mediation test of more familiar KAM
H3 and H4 propose that there is a positive relationship between the attention that investors pay to KAM and the communicative value of the KAM-containing audit report. H3 predicts that the attention that investors paid to the KAM mediates the relationship between the readability of the KAM and the communicative value of the KAM-containing audit report for less sceptical investors when they are less familiar with the KAM. To test H3 and H4, we begin by performing a 2 × 2 ANOVA with KAM readability and trait scepticism as the independent variables and the communicative value of the audit report containing less (more) familiar KAM as the dependent variable. These analyses (see 15–17) reveal no significant total effects for either independent variable or their interaction, suggesting no significant differences in the communicative value of the audit report containing less (more) familiar KAM among the four conditions. Despite the lack of total effects, our manipulated variables can still indirectly influence the communicative value of the audit report containing less (more) familiar KAM through their impact on the attention paid to the KAM (Preacher & Hayes, Citation2004; Shrout & Bolger, Citation2002; Zhao et al., Citation2010).
To provide evidence for H3, we use a moderated mediation model with KAM readability as the independent variable, investors’ trait scepticism as the moderator, the attention that the investors paid to the KAM as the mediator,Footnote5 and the communicative value of the audit report containing less familiar KAM as the dependent variable, and then tested the indirect effect suggested by our hypothesis via a bootstrapping-based analysis (Hayes, Citation2012). Panel A of reports the descriptive statistics of the communicative value of audit reports with less familiar KAM for investors in different experimental groups. On average, investors with high trait scepticism perceive a stronger communicative value for the KAM-containing audit reports (5.41 for more sceptical investors vs. 5.22 for less sceptical investors). There is greater discernible effect of readability regarding communicative value for less sceptical investors (5.74 for the high-readability group and 4.67 for the low-readability group).
Table 5. Mediation Effect of Attention Paid to the KAM on the Relationship between Readability and Communicative Value of Less Familiar KAM.
The model estimation is presented in Panel B of . We find that investors’ trait scepticism significantly moderated the effect of KAM readability on the attention paid to the KAM. For less sceptical investors, high KAM readability led to more attention being paid to the KAM; however, the same is not true for more sceptical investors. Additionally, the attention paid to the KAM is found to be positively related to the perceived communicative value of the audit report. The results of the bootstrapping analysis are shown in Panel C of . We find an insignificant direct effect between KAM readability and investors’ perceived communicative value of the audit report (direct effect = 0.2553, 90% CI = [−0.6021, 1.1127]). However, we show that KAM readability had a significant indirect effect on the perceived communicative value of the audit report only for less sceptical investors (indirect effect = 0.5265, 90% CI = [0.1217, 1.0403]) but not for more sceptical investors (indirect effect = – 0.0550, 90% CI = [–0.4646, 0.3522]). These results support our arguments that more readable KAM have better communicative value for less sceptical investors when they are less familiar with the KAM and that this effect operates through the increased attention paid to the KAM.
H4 predicts that the attention paid to the KAM mediates the relationship between KAM readability and the communicative value of the KAM-containing audit report for more sceptical investors when they are more familiar with the KAM. To provide evidence for H4, we use a moderated mediation model with KAM readability as the independent variable, investors’ trait scepticism as the moderator, the attention investors pay to the KAM as the mediator, and the perceived communicative value of the audit report containing the more familiar KAM as the dependent variable, and tested the indirect effect suggested by our hypothesis using a bootstrapping-based analysis. Panel A of reports the descriptive statistics of the perceived communicative value of the audit report containing more familiar KAM for investors in different experimental groups. On average, investors with high trait scepticism perceived the KAM-containing audit report to have a slightly higher communicative value (5.15 for more sceptical investors vs. 5.11 for less sceptical investors). There is greater discernible effect of readability regarding communicative value for more sceptical investors (5.42 for the high-readability group and 4.76 for the low-readability group).
Table 6. Mediation effect of attention paid to the KAM on the relationship between readability and communicative value of more familiar KAM.
The model estimation is presented in Panel B of . We find that investors’ trait scepticism significantly moderated the effect of KAM readability on the attention paid to the KAM. Specifically, more sceptical investors tend to pay more attention to the highly readable KAM, but less sceptical investors do not. However, inconsistent with our hypothesis, the increased attention paid to the KAM does not improve the perceived communicative value of the audit report. Similarly, as shown in Panel C of , KAM readability has no significant indirect effect on the perceived communicative value of the audit report regardless of the level of trait scepticism (indirect effect for more sceptical investors = 0.2720, 90% CI = [–0.0948, 0.7081]; indirect effect for less sceptical investors = 0.0232, 90% CI = [–0.1265, 0.2372]).
One reason that the increased attention paid to more familiar KAM does not improve their communicative value is that only the ‘How’ paragraph provides additional information for investors when they are familiar with the KAM. Hence, we expect that only the attention paid to the ‘How’ paragraph improves the communicative value of the audit report containing familiar KAM. To provide evidence for this expectation, we use a moderated mediation model with KAM readability as the independent variable, investors’ trait scepticism as the moderator, attention paid to the ‘How’ paragraph as the mediator, and the communicative value of the audit report containing more familiar KAM as the dependent variable, and test the indirect effect suggested by the above hypothesis via a bootstrapping-based analysis.
The model estimation is presented in Panel A of . We find that investors’ trait scepticism significantly moderated the effect of KAM readability on the attention that the investors paid to the ‘How’ paragraph. Highly readable KAM are associated with greater attention paid to the ‘How’ paragraph for more sceptical investors, but not for less sceptical investors. Additionally, for more sceptical investors, increased attention paid to the ‘How’ paragraph is associated with a higher communicative value of the audit report. The bootstrapping results are shown in Panel B of . We find that there is an insignificant direct effect between KAM readability and the perceived communicative value of the audit report (direct effect = 0.2988, 90% CI = [−0.7134, 1.3110]). Furthermore, we find that KAM readability had a significant indirect effect on the communicative value of the audit report only for more sceptical investors (indirect effect = 0.3681, 90% CI = [0.0451, 0.7536]), but not for less sceptical investors (indirect effect = – 0.1113, 90% CI = [–0.4098, 0.1384]). These results support our arguments that KAM with higher readability have better communicative value for more sceptical investors when they are more familiar with the KAM and that this effect operates through the increased attention paid to the ‘How’ paragraph.
Table 7. Mediation Effect of Attention Paid to the ‘How’ Paragraph on the Relationship between Readability and Communicative Value of More Familiar KAM.
The results in indicate that only the increased attention paid to the ‘How’ paragraph improved the communicative value of audit reports for investors when they were more familiar with the KAM. When investors are reading a ‘Why’ paragraph containing information that is more familiar to them, they tend to experience mind-wandering because of the lack of new information that can be obtained. When individuals experience mind-wandering during information processing, their decision-making will not be affected by the information they process, regardless of how long they spend on this processing.
Mind-wandering is a common phenomenon, even during attention-demanding tasks, and fluctuations of attention due to mind-wandering are associated with poorer performance in external tasks (Smallwood & Schooler, Citation2015; Unsworth & Robison, Citation2016). Previous literature shows that individuals’ emotional arousal is relatively low when they are experiencing mind-wondering (Grandchamp et al., Citation2014; Mittner et al., Citation2014). Many psychological and marketing studies provide evidence that electrodermal activity (EDA) is a reliable indicator of emotional arousal (Gakhal & Senior, Citation2008; Gangadharbatla et al., Citation2013; Somervuori & Ravaja, Citation2013). In this study, we used an Empatica E4 wristband (https://www.empatica.com/en-int/) to record the participants’ EDA.
The results of the paired T-test for less familiar KAM are reported in Panel B of . When investors are less familiar with the KAM, their EDA is slightly higher when reading the ‘Why’ paragraph than when reading the ‘How’ paragraph (average difference = 0.07). However, this difference is not significant (0.88 for the ‘Why’ paragraph vs. 0.81 for the ‘How’ paragraph, t = 0.89). These results can be attributed to the fact that, when investors are less familiar with the KAM, both the ‘Why’ and ‘How’ paragraphs provide new information to them. Therefore, they do not treat ‘Why’ and ‘How’ paragraph differently.
Table 8. Paired T test of mind wandering.
In contrast, as shown in Panel C of , when investors are more familiar with the issues discussed in the KAM, their EDA is significantly lower when reading the ‘Why’ paragraph than when reading the ‘How’ paragraph (average difference = – 0.07, 0.84 for the ‘Why’ paragraph vs. 0.91 for the ‘How’ Paragraph, t = −1.94). This indicates that investors experienced more severe mind-wandering when reading the ‘Why’ paragraph than when reading the ‘How’ paragraph, which is consistent with the results in .
5. Conclusions
Our study investigates the joint effect of investors’ trait scepticism and the familiarity and readability of KAM on the communicative value of audit reports. By using an eye-tracking device, we provide evidence that this effect operates through the attention that investors devote to processing the information in KAM. When investors are less familiar with the issue discussed in KAM, less sceptical investors, who are motivated by situational interests, reduce their attention paid to the KAM with the decrease of KAM’s readability, which in turn lowers the communicative value of the audit report. However, readability has little impact for investors with higher trait scepticism. Inspired by both situational and individual interest, more sceptical investors exhibit a greater desire to seek and explore new information in KAM than their less sceptical counterparts no matter the KAM is difficult or easy to read. In contrast, when investors are more familiar with the issue discussed in the KAM, more sceptical investors increase their attention paid to the KAM with the increase of KAM’s readability. Furthermore, our results show that only the increased attention paid to the ‘How’ paragraph improves the communicative value of the audit report. However, readability has little impact on investors with lower trait scepticism. Inspired by neither situational nor individual interest, less sceptical investors has little motivation to seek and explore information in the KAM regardless of the readability.
This study provides insight into how investors’ characteristics and the characteristics of KAM jointly affect the communicative value of audit reports. We offer an explanation to reconcile the inconsistent results of prior literature concerning the effect of the inclusion of KAM in audit reports. And we reveal the role of visual attention in improving the communicative value of the audit report by using the eye-tracking device. However, our study has some limitations. First, we focus on the mediating role of information processing on the effect of the form and content of KAM on investors’ judgements and decision-making without examining the mediating effect of investors’ understanding. Second, participants in our experiment were asked to complete two tasks. Although we provide evidence that order effect does not exist and our findings still hold when we exclude data from the second round, our results may suffer from the concurrent construct effect from the two manipulated variables (i.e. readability and familiarity). Third, the KAM that we use in our study are relatively simple. To increase the similarity of the two types of KAM that we use (discussing goodwill impairment and fixed asset impairment, respectively), we simplify the ‘Why’ and ‘How’ paragraphs in the KAM and sacrifice some external validity to increase internal validity. Future research should include richer information in both the ‘Why’ and ‘How’ paragraphs (i.e. in terms of tone, quality, and quantity) to improve the external validity of the research. To the best of our knowledge, this is the first accounting study to consider mind-wandering when examining individuals’ information processing and decision-making using both an electrodermal device and an eye-tracking device. It thus provides a new approach for researchers to study how individuals make judgements and decisions.
Acknowledgments
The authors thank the National Natural Science Foundation of China (72172132) and the Chinese Fundamental Research Funds for the Central Universities (Grant# 20720151132) for their financial support. We also thank the Quality Improvement Project of Chief Accountants in Large and Medium-size Enterprises and institutions for the support of our experiment. This paper benefited from comments and suggestions from Kamber Hetrick from Northeastern University, Chunyan Wei from the Shanghai University of Finance and Economics, and the seminar participants at the 2021 conference of the China Journal of Accounting Studies and the 2020 annual conference of the American Accounting Association. The research instrument is available upon request from the corresponding author.
Disclosure statement
No potential conflict of interest was reported by the author(s).
Notes
1 In the robustness test, we remove the values for the three most sceptical participants from the more sceptical group and the values for the three least sceptical participants from the less sceptical group to determine whether our findings still hold. A9-IA14 find similar results to the main test.
Table 1. Participant demographics information.
2 We use participants’ risk judgements rather than investment decisions as the dependent variable for the following reasons. First, risk judgement is an important part of investment decisions (Köhler et al., Citation2020), reflecting people’s beliefs, understanding, and evaluation of the current situation. Investors need to assess risk before making up their minds to invest in the firm. Second, risk judgement is a more objective indicator than investment decision. Judgement refers to the evaluation of the current state of affairs or the future, whereas decisions may be driven by other factors (Bonner, Citation1999). Third, each participant was asked to read two different KAM in an audit report and assess the risk of these two KAM respectively. If we ask the participants to rate their willingness to invest in the firm, it is difficult for us to determine which KAM dominates participants’ investment decisions. Hence, in our study, we ask participants to rate the risk of each KAM respectively.
3 Participants in the Readability manipulation check had an average age of 44.18 years and had worked for an average of 21.13 years. A total of 56.10% of them were female.
4 Here, ‘prior knowledge’ refers to the amount of general accounting knowledge about goodwill impairment and fixed asset impairment. KAM provide firm-specific information about the auditing of financial statements and highlight the main critical accounting topics or items in a company (Velte & Issa, Citation2019). For investors, information disclosed in KAM are new to them regardless of whether they have prior knowledge about the item. When reading the KAM, prior knowledge gives investors the feeling of knowledge, which induces a sense of familiarity. Hence, the term ‘prior knowledge’ discussed here is more similar to familiarity than the knowledge or ability to deal with the KAM. More prior accounting knowledge about the item makes investors more familiar with it.
5 Visual attention indicates the process of information understanding (Kahneman, Citation1973; Monk, Citation1984) and risk judgement reflects the outcome of information understanding (Bonner, Citation1999). Behavioural studies often use judgement as the main dependent variable without using understanding as the mediator (Dennis et al., Citation2019; Johnson et al., Citation2020; Rennekamp, Citation2012; Theis et al., Citation2012). Hence, we do not use participants’ understanding as the mediator.
References
- Afifi, W.A., & Weiner, J.L. (2004). Toward a theory of motivated information management. Communication Theory, 14(2), 167–190. https://doi.org/10.1111/j.1468-2885.2004.tb00310.x
- Bédard, J., Coram, P., Espahbodi, R., & Mock, T.J. (2016). Does recent academic research support changes to audit reporting standards? Accounting Horizons, 30(2), 255–275. https://doi.org/10.2308/acch-51397
- Bettels, J., Haase, J., & Wiedmann, K.P. (2020). Shaping consumer perception: Effects of vertical and horizontal packaging alignment. Journal of Consumer Marketing, 37(4), 423–431. https://doi.org/10.1108/JCM-05-2019-3231
- Birnberg, J.G., & Shields, M.D. (1984). The role of attention and memory in accounting decisions. Accounting, Organizations and Society, 9(3–4), 365–382. https://doi.org/10.1016/0361-3682(84)90020-5
- Bonner, S.E. (1999). Judgment and decision-making research in accounting. Accounting Horizons, 13(4), 385–398. https://doi.org/10.2308/acch.1999.13.4.385
- Bowler, L. (2010). The self‐regulation of curiosity and interest during the information search process of adolescent students. Journal of the American Society for Information Science and Technology, 61(7), 1332–1344. https://doi.org/10.1002/asi.21334
- Case, D.O., & Given, L.M. (2016). Looking for information. A survey of research on information seeking, needs and behaviour (4th ed.). Emerald Group Publishing Limited.
- Charness, G., Gneezy, U., & Kuhn, M.A. (2012). Experimental methods: Between-subject and within-subject design. Journal of Economic Behavior & Organization, 81(1), 1–8. https://doi.org/10.1016/j.jebo.2011.08.009
- Chen, Y., Jermias, J., & Panggabean, T. (2016). The role of visual attention in the managerial Judgment of Balanced‐Scorecard performance evaluation: Insights from using an eye‐tracking device. Journal of Accounting Research, 54(1), 113–146. https://doi.org/10.1111/1475-679X.12102
- Christensen, B.E., Glover, S.M., & Wolfe, C.J. (2014). Do critical audit matter paragraphs in the audit report change nonprofessional investors’ decision to invest? Auditing: A Journal of Practice & Theory, 33(4), 71–93. https://doi.org/10.2308/ajpt-50793
- Church, B.K., Davis, S.M., & McCracken, S.A. (2008). The auditor’s reporting model: A literature overview and research synthesis. Accounting Horizons, 22(1), 69–90. https://doi.org/10.2308/acch.2008.22.1.69
- Clement, J. (2007). Visual influence on in-store buying decisions: An eye-track experiment on the visual influence of packaging design. Journal of Marketing Management, 23(9–10), 917–928. https://doi.org/10.1362/026725707X250395
- Cohen, J.R., Dalton, D.W., & Harp, N.L. (2017). Neutral and presumptive doubt perspectives of professional scepticism and auditor job outcomes. Accounting, Organizations and Society, 62, 1–20. https://doi.org/10.1016/j.aos.2017.08.003
- Collins, R.P., Litman, J.A., & Spielberger, C.D. (2004). The measurement of perceptual curiosity. Personality and Individual Differences, 36(5), 1127–1141. https://doi.org/10.1016/S0191-8869(03)00205-8
- Coram, P.J., Mock, T.J., Turner, J.L., & Gray, G.L. (2011). The communicative value of the auditor’s report. Australian Accounting Review, 21(3), 235–252. https://doi.org/10.1111/j.1835-2561.2011.00140.x
- Deng, X., Kahn, B.E., Unnava, H.R., & Lee, H. (2016). A “wide” variety: Effects of horizontal versus vertical display on assortment processing, perceived variety, and choice. Journal of Marketing Research, 53(5), 682–698. https://doi.org/10.1509/jmr.13.0151
- Dennis, S.A., Griffin, J.B., & Zehms, K.M. (2019). The value relevance of managers’ and auditors’ disclosures about material measurement uncertainty. The Accounting Review, 94(4), 215–243. https://doi.org/10.2308/accr-52272
- Dilla, W.N., & Janvrin, D.J. (2010). Voluntary disclosure in annual reports: The association between magnitude and direction of change in corporate financial performance and graph use. Accounting Horizons, 24(2), 257–278. https://doi.org/10.2308/acch.2010.24.2.257
- Duan, S., & Meng, L. (2021). The polarization effect of project presentation in ranking list on project evaluation. Acta Psychologica Sinica, 53(11), 1271–1285. https://doi.org/10.3724/SP.J.1041.2021.01271
- Elliott, W.B., Grant, S.M., & Hodge, F.D. (2018). Negative news and investor trust: The role of $ Firm and# CEO Twitter use. Journal of Accounting Research, 56(5), 1483–1519. https://doi.org/10.1111/1475-679X.12217
- Emett, S.A. (2019). Investor reaction to disclosure of past performance and future plans. The Accounting Review, 94(5), 165–188. https://doi.org/10.2308/accr-52343
- Fehrenbacher, D.D., Schulz, A.K.D., & Rotaru, K. (2018). The moderating role of decision mode in subjective performance evaluation. Management Accounting Research, 41, 1–10. https://doi.org/10.1016/j.mar.2018.03.001
- Fiedler, S., Glöckner, A., Nicklisch, A., & Dickert, S. (2013). Social value orientation and information search in social dilemmas: An eye-tracking analysis. Organizational Behavior and Human Decision Processes, 120(2), 272–284. https://doi.org/10.1016/j.obhdp.2012.07.002
- Fiske, S.T. (1980). Attention and weight in person perception: The impact of negative and extreme behavior. Journal of Personality and Social Psychology, 38(6), 889–906. https://doi.org/10.1037/0022-3514.38.6.889
- Gakhal, B., & Senior, C. (2008). Examining the influence of fame in the presence of beauty: An electrodermal ‘neuromarketing’ study. Journal of Consumer Behaviour: An International Research Review, 7(4‐5), 331–341. https://doi.org/10.1002/cb.255
- Gangadharbatla, H., Bradley, S., & Wise, W. (2013). Psychophysiological responses to background brand placements in video games. Journal of Advertising, 42(2–3), 251–263. https://doi.org/10.1080/00913367.2013.775800
- Gilchrist, I.D., & Harvey, M. (2006). Evidence for a systematic component within scan paths in visual search. Visual Cognition, 14(4–8), 704–715. https://doi.org/10.1080/13506280500193719
- Glöckner, A., & Herbold, A.K. (2011). An eye‐tracking study on information processing in risky decisions: Evidence for compensatory strategies based on automatic processes. Journal of Behavioral Decision Making, 24(1), 71–98. https://doi.org/10.1002/bdm.684
- Gold, A., Gronewold, U., & Pott, C. (2012). The ISA 700 auditor’s report and the audit expectation gap—Do explanations matter? International Journal of Auditing, 16(3), 286–307. https://doi.org/10.1111/j.1099-1123.2012.00452.x
- Graham, N.E. (1956). The speed and accuracy of reading horizontal, vertical, and circular scales. Journal of Applied Psychology, 40(4), 228–232. https://doi.org/10.1037/h0043653
- Grandchamp, R., Braboszcz, C., & Delorme, A. (2014). Oculometric variations during mind wandering. Frontiers in Psychology, 5, 31–41. https://doi.org/10.3389/fpsyg.2014.00031
- Hayes, A.F. (2012). PROCESS: A versatile computational tool for observed variable mediation, moderation, and conditional process modeling [white paper]. Retrieved from http://www.claudiaflowers.net/rsch8140/Hayesprocess.pdf
- Hidi, S. (1990). Interest and its contribution as a mental resource for learning. Review of Educational Research, 60(4), 549–571. https://doi.org/10.3102/00346543060004549
- Hurtt, R.K. (2010). Development of a scale to measure professional scepticism. Auditing: A Journal of Practice & Theory, 29(1), 149–171. https://doi.org/10.2308/aud.2010.29.1.149
- International Auditing and Assurance Standards Board (IAASB). (2011). Enhancing the value of auditor reporting: Exploring options for change. New York, NY: IASB. https://www.ifac.org/system/files/publications/exposur-drafts/CP_Auditor_Reporting-Final.pdf
- International Auditing and Assurance Standards Board (IAASB). (2013). Reporting on audited financial statements: Proposed new and revised international; standards on auditing. New York, NY: International Federation of Accountants. https://www.iaasb.org/publications/reporting-audited-financial-statements-proposed-new-and-revised-international-standards-auditing
- International Auditing and Assurance Standards Board (IAASB). (2015). International Standard on Auditing (ISA) 701, Communicating Key Audit Matters in the Independent Auditor’s Report. New York: International Federation of Accountants. https://www.ifac.org/publications-resources/international-standard-auditing-isa-701-new-communicating-key-audit-matters-i
- Johnson, J.A., Theis, J., Vitalis, A., & Young, D. (2020). The influence of firms’ emissions management strategy disclosures on investors’ valuation judgments. Contemporary Accounting Research, 37(2), 642–664. https://doi.org/10.1111/1911-3846.12545
- Kachelmeier, S.J., Schmidt, J.J., & Valentine, K. (2017). The disclaimer effect of disclosing critical audit matters in the auditor’s report. [ Unpublished manuscript]. Available at SSRN 2481284. Retrieved from https://pcaobus.org/News/Events/Documents/10272014_CEA/Disclaimer_Effect.pdf
- Kahneman, D. (1973). Attention and effort. Prentice-Hall.
- Keller, K.L. (1991). Memory and evaluation effects in competitive advertising environments. Journal of Consumer Research, 17(4), 463–476. https://doi.org/10.1086/208571
- Kelton, A.S., Pennington, R.R., & Tuttle, B.M. (2010). The effects of information presentation format on judgment and decision making: A review of the information systems research. Journal of Information Systems, 24(2), 79–105. https://doi.org/10.2308/jis.2010.24.2.79
- Kipp, P. (2017). The Effect of Expanded Audit Report Disclosures on Users’ Confidence in the Audit and the Financial Statements [ Dissertation]. University of South Florida. https://scholarcommons.usf.edu/etd/6718
- Köhler, A., Ratzinger-Sakel, N., & Theis, J. (2020). The effects of key audit matters on the auditor’s report’s communicative value: Experimental evidence from investment professionals and non-professional investors. Accounting in Europe, 17(2), 105–128. https://doi.org/10.1080/17449480.2020.1726420
- Libby, R., Bloomfield, R., & Nelson, M.W. (2002). Experimental research in financial accounting. Accounting, Organizations and Society, 27(8), 775–810. https://doi.org/10.1016/S0361-3682(01)00011-3
- Litman, J. (2005). Curiosity and the pleasures of learning: Wanting and liking new information. Cognition & Emotion, 19(6), 793–814. https://doi.org/10.1080/02699930541000101
- Lu, L., & Yuan, Y.C. (2011). Shall I Google it or ask the competent villain down the hall? The moderating role of information need in information source selection. Journal of the American Society for Information Science and Technology, 62(1), 133–145. https://doi.org/10.1002/asi.21449
- Lynch, E.J., & Andiola, L.M. (2019). If eyes are the window to our soul, what role does eye-tracking play in accounting research? Behavioural Research in Accounting, 31(2), 107–133. https://doi.org/10.2308/bria-52283
- MacKenzie, S.B., & Spreng, R.A. (1992). How does motivation moderate the impact of central and peripheral processing on brand attitudes and intentions? Journal of Consumer Research, 18(4), 519–529. https://doi.org/10.1086/209278
- Mikulincer, M. (1997). Adult attachment style and information processing: Individual differences in curiosity and cognitive closure. Journal of Personality and Social Psychology, 72(5), 1217. https://doi.org/10.1037/0022-3514.72.5.1217
- Mittner, M., Boekel, W., Tucker, A.M., Turner, B.M., Heathcote, A., & Forstmann, B.U. (2014). When the brain takes a break: A model-based analysis of mind wandering. Journal of Neuroscience, 34(49), 16286–16295. https://doi.org/10.1523/JNEUROSCI.2062-14.2014
- Monk, T.H. (1984). “Search”, in Sustained Attention in Human Performance (J.S. Warm, edited by). Wiley. (pp. 293321).293321).
- Moore, W.L., & Lehmann, D.R. (1980). Individual differences in search behaviour for a nondurable. Journal of Consumer Research, 7(3), 296–307. https://doi.org/10.1086/208817
- Moroney, R., Phang, S.Y., & Xiao, X. (2021). When do investors value key audit matters? European Accounting Review, 30(1), 63–82. https://doi.org/10.1080/09638180.2020.1733040
- Naess, A. (1969). Scepticism: International Library of Philosophy and Scientific Method. Humanities Press.
- Preacher, K.J., & Hayes, A.F. (2004). SPSS and SAS procedures for estimating indirect effects in simple mediation models. Behavior Research Methods, Instruments and Computers, 36(4), 717–731. https://doi.org/10.3758/BF03206553
- Public Company Accounting Oversight Board (PCAOB). 2016. Proposed Auditing Standard— The Auditor’s Report on an Audit of Financial Statements When the Auditor Expresses an Unqualified Opinion. No. 2016-003. Washington, DC: Public Company Accounting Oversight Board.
- Quadackers, L., Groot, T., & Wright, A. (2014). Auditors’ professional scepticism: Neutrality versus presumptive doubt. Contemporary Accounting Research, 31(3), 639–657. https://doi.org/10.1111/1911-3846.12052
- Rapley, E.T., Robertson, J.C., & Smith, J.L. (2021). The effects of disclosing critical audit matters and auditor tenure on nonprofessional investors’ judgments. Journal of Accounting and Public Policy, 106847. https://doi.org/10.1016/j.jaccpubpol.2021.106847
- Rayner, K. (1998). Eye movements in reading and information processing: 20 years of research. Psychological Bulletin, 124(3), 372–422. https://doi.org/10.1037/0033-2909.124.3.372
- Reid, L.C., Carcello, J.V., Li, C., Neal, T.L., & Francis, J.R. (2019). Impact of auditor report changes on financial reporting quality and audit costs: Evidence from the United Kingdom. Contemporary Accounting Research, 36(3), 1501–1539. https://doi.org/10.1111/1911-3846.12486
- Rennekamp, K. (2012). Processing fluency and investors’ reactions to disclosure readability. Journal of Accounting Research, 50(5), 1319–1354. https://doi.org/10.1111/j.1475-679X.2012.00460.x
- Savolainen, R. (2019). Modeling the interplay of information seeking and information sharing: A conceptual analysis. Aslib Proceedings, 71(4), 518–534. https://doi.org/10.1108/AJIM-10-2018-0266
- Shi, S.W., Wedel, M., & Pieters, F.G.M. (2013). Information acquisition during online decision making: A model-based exploration using eye-tracking data. Management Science, 59(5), 1009–1026. https://doi.org/10.1287/mnsc.1120.1625
- Shrout, P.E., & Bolger, N. (2002). Mediation in experimental and nonexperimental studies: New procedures and recommendations. Psychological Methods, 7(4), 422–445. https://doi.org/10.1037/1082-989X.7.4.422
- Sirois, L.P., Bédard, J., & Bera, P. (2018). The informational value of key audit matters in the auditor’s report: Evidence from an eye-tracking study. Accounting Horizons, 32(2), 141–162. https://doi.org/10.2308/acch-52047
- Smallwood, J., & Schooler, J.W. (2015). The science of mind wandering: Empirically navigating the stream of consciousness. Annual Review of Psychology, 66(1), 487–518. https://doi.org/10.1146/annurev-psych-010814-015331
- Snyder, M., & Stukas, A.A., Jr. (1999). Interpersonal processes: The interplay of cognitive, motivational, and behavioural activities in social interaction. Annual Review of Psychology, 50(1), 273–303. https://doi.org/10.1146/annurev.psych.50.1.273
- Somervuori, O., & Ravaja, N. (2013). Purchase behaviour and psychophysiological responses to different price levels. Psychology & Marketing, 30(6), 479–489. https://doi.org/10.1002/mar.2062
- Srinivasan, N., & Ratchford, B.T. (1991). An empirical test of a model of external search for automobiles. Journal of Consumer Research, 18(2), 233–242. https://doi.org/10.1086/209255
- Tan, H.T., Wang, E.Y., & Zhou, B.O. (2014). When the use of positive language backfires: The joint effect of tone, readability, and investor sophistication on earnings judgments. Journal of Accounting Research, 52(1), 273–302. https://doi.org/10.1111/1475-679X.12039
- Tan, H.T., Wang, E.Y., & Zhou, B. (2015). How does readability influence investors’ judgments? Consistency of benchmark performance matters. The Accounting Review, 90(1), 371–393. https://doi.org/10.2308/accr-50857
- Theis, J.C., Yankova, K., & Eulerich, M. (2012). Information order effects in the context of management commentary—initial experimental evidence. Journal of Management Control, 23(2), 133–150. http://dx.doi.org/10.1007/s00187-012-0160-0
- Unsworth, N., & Robison, M.K. (2016). Pupillary correlates of lapses of sustained attention. Cognitive, Affective, & Behavioural Neuroscience, 16(4), 601–615. http://dx.doi.org/10.3758/s13415-016-0417-4
- Velte, P., & Issa, J. (2019). The impact of key audit matter (KAM) disclosure in audit reports on stakeholders’ reactions: A literature review. Problems and Perspectives in Management, 17(3), 323–341. http://dx.doi.org/10.21511/ppm.17(3).2019.26
- White, R.W., & Roth, R.A. (2009). Exploratory search: Beyond the query-response paradigm. Synthesis Lectures on Information Concepts, Retrieval, and Services, 1(1), 1–98. https://doi.org/10.2200/S00174ED1V01Y200901ICR003
- Williams, C.M. (1966). Horizontal versus vertical display of numbers. Human Factors, 8(3), 237–238.https://doi.org/10.1086/344425
- Wood, S.L., & Lynch, J.G., Jr. (2002). Prior knowledge and complacency in new product learning. Journal of Consumer Research, 29(3), 416–426.
- Zerbinos, E. (1990). Information seeking and information processing: Newspapers versus videotext. Journalism Quarterly, 67(4), 920–929. https://doi.org/10.1177/107769909006700446
- Zhang, J.Y. (2020). The impact of vivid graphical presentation of financial information in digital annual reports on investors’ impressions of management and firm performance. Journal of Information Systems, 34(3), 233–253. https://doi.org/10.2308/isys-52533
- Zhao, X., Lynch, J.G., Jr, & Chen, Q. (2010). Reconsidering Baron and Kenny: Myths and truths about mediation analysis. Journal of Consumer Research, 37(2), 197–206. https://doi.org/10.1086/651257