
 ?Mathematical formulae have been encoded as MathML and are displayed in this HTML version using MathJax in order to improve their display. Uncheck the box to turn MathJax off. This feature requires Javascript. Click on a formula to zoom.
ABSTRACT
This study examines the effect of common analysts covering both suppliers and their major customers on suppliers’ investment efficiency. Using a sample of A-share listed firms in China from 2007 to 2018, we find that suppliers with common analyst coverage exhibit higher investment efficiency. This effect is stronger when suppliers have greater demand for obtaining customer information from common analysts, for example, when suppliers have shorter relationships with and are smaller than their customers, and when their customers have more fluctuating earnings and poorer accounting information quality. It is also stronger when common analysts possess a distinct information advantage about customers, for example, when they have relatively higher customer industry specialisation, more information about customers’ competitors, more experience, and are star analysts. Taken together, our results suggest that suppliers can obtain prospective information about their customers from common analysts, which facilitates suppliers’ efficient investment.
1. Introduction
The 19th National Congress of the Communist Party of China emphasised the continuation of supply-side structural reform and incremental high-quality supply. A high-quality supply system requires efficient investment. Therefore, it is important to study how to improve suppliers’ investment efficiency at the micro market level, which is beneficial for removing excess capacity, optimising the supply chain structure, and comprehensively improving the supply chain value.
When making investment decisions, suppliers select investment projects with a positive net present value based on expected returns and perceived risks. A supplier’s investment projects will have higher expected returns and lower perceived risks if the customer’s business prospects are promising. Therefore, suppliers must collect extensive information about customers’ business prospects to make efficient investment decisions. Analysts usually cover listed firms. As important information intermediaries in the capital market, analysts can obtain macro-, industry-, and firm-level information and analyse it with their superior ability (Boni & Womack, Citation2006; Hutton et al., Citation2012; Kadan et al., Citation2012). In addition, more than a third of the supplier-customer pairs are followed by common analysts over the period 2007 to 2018. In other words, suppliers, customers, and common analysts link to a network. According to the social network theory, information sharing within a network affects individual decisions (Granovetter, Citation2005). Will suppliers use the network formed by common analysts to gain more information about their customers’ business prospects and improve investment efficiency? Our study attempts to answer this question.
We argue that it is not only common analysts’ access to customer information but also their superior ability to analyse it, which affords them information advantages about customers’ business prospects. First, common analysts have more private communication with customers, which helps them obtain customer information. Second, common analysts benefit more from incorporating industry- and firm-level complementary information along the supply chain into customer prospect forecasts. At the industry level, common analysts covering both supplier and customer industries acquire intra-industry, cross-industry, and supply chain trends knowledge, to more accurately forecast the customer industry trend since they are often in different industries.Footnote1 At the firm level, the articulation between suppliers’ sales and customers’ costs helps common analysts disaggregate the core drivers of customer earnings and recognise the causes of abnormal earnings to forecast the sustainability of customers’ profitability. Consequently, suppliers can resort to common analysts for customers’ business prospect information and incorporate it into their investment decisions, leading to better investment efficiency. Therefore, we expect that suppliers will have higher investment efficiency when they and their major customers are covered by common analysts.
Using a sample of A-share listed firms in China from 2007 to 2018, we find that suppliers with common analyst coverage exhibit higher investment efficiency. This effect is stronger when suppliers have greater demand for obtaining customer information from common analysts, for example, when suppliers have shorter relationships with and are smaller than their customers, and when their customers have more fluctuating earnings and poorer accounting information quality. It is also stronger when common analysts possess a distinct information advantage about customers, for example, when they have relatively higher customer industry specialisation, more information about customers’ competitors, more experience, and are star analysts. Our results are robust to a series of robustness checks and endogeneity tests. Taken together, our results suggest that suppliers can obtain prospective information about their customers from common analysts, which facilitates suppliers’ efficient investment.
This study makes several important contributions to the literature. First, we add to the growing literature on how common analysts affect corporate economic decisions. Only a few studies have identified that common analysts can promote covered firms’ patent citations and innovation (Martens & Sextroh, Citation2021) and improve M&A performance (Ma, Citation2019). Our study shows that common analysts improve suppliers’ investment efficiency from a supply chain perspective.
Second, our study complements the literature on how supply chain networks affect corporate economic decisions. Existing studies have explored the influence of common auditors (Dhaliwal et al., Citation2017) and common directors (Minnick & Raman, Citation2017) between suppliers and customers on suppliers’ investment levels. It is more prevalent for suppliers and customers to be covered by common analysts than by common auditors and common directors.Footnote2 In addition, it is difficult to reflect the supply chain network’s influence on corporate decision efficiency by only studying investment level influence. Our study provides evidence that common analysts, an important new form of supply chain network, can improve suppliers’ investment efficiency.
Third, existing studies have found that analysts’ evaluation reports on firms’ investment activities affect firms’ investment decisions, while the conclusions are inconsistent. Choi et al. (Citation2020) and Bae et al. (Citation2022) find that investment evaluation information released by analysts can improve firms’ investment efficiency. While Becher et al. (Citation2015) show that analysts’ evaluation of firms’ investment activity would cause investors to overreact, leading to a decrease in information usefulness and ultimately reducing firms’ investment efficiency. Based on the setting of common analysts, our study shows that suppliers can improve investment efficiency by resorting to common analysts for customers’ business prospect information, which provides new evidence to coordinate the literature’s conclusions.
2. Literature review
2.1. Investment decisions in the supply chain
Suppliers must collect extensive information about their customers’ business prospects when making investment decisions. Prior studies have found that suppliers can resort to various information sources. First, suppliers can obtain investment-related information from customers’ public information. Chiu et al. (Citation2019) find that suppliers can predict customers’ prospects by analysing customers’ risk factor disclosures contained in annual reports. Therefore, more informative disclosures of customer risk factors are associated with more efficient supplier investment. Chen et al. (Citation2019) find that a higher linguistic information quality of customer management earnings forecast reports improves supplier investment efficiency. Chen et al. (Citation2021) find that customers’ high accounting information quality can help suppliers better predict customers’ future demand and improve their investment efficiency. Therefore, customers’ higher earnings quality improves suppliers’ investment efficiency. Second, suppliers can access private investment-related information through common networks with their customers. Previous studies have found that when suppliers and their customers have common auditors (Dhaliwal et al., Citation2017) and common directors (Minnick & Raman, Citation2017), suppliers can obtain more information about customers’ business prospects and expand investment levels.
2.2. Common analysts and corporate decisions
Multiple firms being covered by the same analyst form a common-analyst-coverage network. Social network theory posits that individuals are embedded in the network and that information flows within the network affect individual decisions (Granovetter, Citation2005). On the one hand, common analysts can obtain complementary information or cross-verify information within the network to make more accurate earnings forecasts. For example, Guan et al. (Citation2015) find that analysts who follow a covered firm’s customers provide more accurate earnings forecasts for the supplier than those who do not. On the other hand, common analysts can act as information intermediaries to promote information flow within the network and improve corporate financial decisions. Ma (Citation2019) finds that when an acquirer and its target share common analysts, the acquirer can obtain target information through common analysts to improve M&A performance. Martens and Sextroh (Citation2021) find that firms can learn about another firm’s technology and industry trends through common analysts. Therefore, firms are more likely to cite another firm’s patent if they are covered by the same analyst, and exhibit higher innovation levels.
Our study attempts to link these two fields of literature to explore whether common analysts can help suppliers improve investment efficiency.
3. Hypothesis development
When making investment decisions, suppliers need to expect returns and perceive risks of investment projects to undertake those with a positive net present value. A supplier’s investment projects will have higher expected returns and lower perceived risks if its customer’s business prospects are promising (Dou et al., Citation2013; Raman & Shahrur, Citation2008). Customers’ procurement demands for suppliers increase steadily when their business prospects are promising. By investing in capacity expansion, suppliers can not only meet customer procurement demands and increase earnings but also lower the risk of idle capacity. Therefore, suppliers have an incentive to collect extensive information about customers’ business prospects to make efficient investment decisions.
Analysts usually cover firms if they are listed. As important information intermediaries in the capital market, analysts can obtain macro-, industry-, and firm-level information and analyse it with their superior ability (Boni & Womack, Citation2006; Hutton et al., Citation2012; Kadan et al., Citation2012). We argue that common analysts can obtain more customer information to analyse customers’ business prospects when they cover both suppliers and their major customers. Therefore, common analysts may become an important information source for suppliers to obtain customer business prospect information because they have a superior information advantage.
First, common analysts have more opportunities to communicate privately with customer management to obtain customer information. According to a survey by Soltes (Citation2014), analysts have more than 70 private communications with the covered firms’ management annually. Common analysts can verify customers’ public information and obtain private and timely information through private communication with customer management (Park & Soltes, Citation2018).Footnote3
Second, common analysts can more accurately forecast customers’ business prospects and their impacts on suppliers. Economic links along the supply chain can promote information complementarity between supplier and customer firms. Such information complementarity increases common analysts’ information acquisition and production efficiency (Luo & Nagarajan, Citation2015). Common analysts can exploit industry- and firm-level information complementarities along the supply chain to produce more accurate forecasts of customer business prospects. At the industry level, about 51% (95%) of the listed supplier-customer pairs are from different industries according to one (three) CSRC industry codes in our sample period from 2007 to 2018. It is difficult for a supplier to predict its customer industry development when they belong to different industries. Common analysts covering both supplier and customer industries can acquire intra-industry and cross-industry knowledge to forecast customer industry trends more accurately (Kadan et al., Citation2012). At the firm level, supplier sales and customer procurements are interconnected. The growth of customer performance leads to an increase in procurement and then elevates suppliers’ sales, and the decline in customer performance leads to a decrease in procurement and further reduces suppliers’ sales (Hertzel et al., Citation2008). The articulation between suppliers’ sales and customers’ procurements helps common analysts disaggregate the core drivers of customer earnings and recognise the causes of abnormal earnings to forecast the sustainability of customers’ profitability. In addition, common analysts know more about the respective operations and the relationship between suppliers and customers, so they can more efficiently take into account the customer’s business prospects when assessing suppliers’ investment. For example, Guan et al. (Citation2015) find that common analysts can forecast the impact of customer profit information on suppliers’ business performance more accurately.
In summary, suppliers need to collect extensive information about customers’ business prospects, and common analysts possess a distinct information advantage about customers’ business prospects.Footnote4 Additionally, the network of suppliers and customers connected by common analysts facilitates information flow (Granovetter, Citation2005).Footnote5 Thus, we conjecture that suppliers can resort to common analysts for customer business prospect information and incorporate it into their investment decisions, leading to better investment efficiency. The hypothesis is stated as follows:
H1:
The supplier exhibits higher investment efficiency when the supplier and its major customer are covered by common analysts.
4. Research design
4.1. Sample and data
Our sample is based on firms listed on the Shanghai and Shenzhen stock exchanges that reported at least one public firm as their major customer from 2007 to 2018. We require customers to be public firms to obtain their financial data for empirical analysis. We manually retrieved the names of the top five customers from suppliers’ annual reports. We then search for customer information using the disclosed name on two searching websites for corporate information (Qichacha and Tianyancha) to determine whether the customer is publicly listed. When a supplier reports more than one listed customer in a year, we weigh each customer’s data with its percentage of sales and then aggregate the data for each supplier year in our main tests (Chen et al., Citation2019; Chiu et al., Citation2019). Our empirical analysis is conducted on a supplier-year basis. We disregarded firms with incomplete data, firms active in financial services, and ST firms. The final sample consists of 1,376 supplier-year observations and 1,846 supplier-customer-year observations from 650 unique suppliers.
An analyst is regarded as covering a firm in year t if he/she issues at least one research report for the firm in year t. We match analysts who follow supplier and customer firms to determine whether the supplier and customer are followed by common analysts. We obtain analyst data from RESSET, and all other data are from CSMAR. To mitigate the effect of outliers, we winsorised the continuous variables at 1% and 99%.
4.2. Measuring investment efficiency
Following Richardson (Citation2006) and Liu et al. (Citation2014), we measured investment inefficiency using the following model:
where Invest is firm i‘s investment level in year t, measured as the sum of the net cash of construction expenditure of fixed, intangible, and other long-term assets and acquisition expenditure of the subsidiary and other business units, minus the sum of the net cash of disposal gains of fixed, intangible and other long-term assets, depreciation of fixed assets, amortisation of intangible assets, long-term deferred expense. Then the difference is divided by total assets at the beginning. Other variables include sales growth (Growth), leverage (Leverage), cash and cash equivalents divided by total assets (Cash), firm age (Age), firm size (Size), and stock returns (Return). We also include firm fixed effects and year fixed effects. We define investment inefficiency (Absinv) as the absolute value of the residuals from estimating EquationEq. (1)(1)
(1) . This captures the extent to which a firm’s investment deviates from the optimal investment level. A higher value of Absinv reflects a greater degree of investment inefficiency.
4.3. Model specification and measurement of key research variables
Following Chiu et al. (Citation2019) and Chen et al. (Citation2019), we tested Hypothesis 1 using the following model:
Absinv is a proxy for the extent of investment inefficiency. Sranalyst is the sales-weighted average for common analysts. We construct Sranalyst by defining a dummy variable, Analyst, for each supplier-customer-year observation, which equals one if the supplier and its customer are covered by the same analyst and zero otherwise. For each supplier-year, Sranalyst equals the sales-weighted average of Analyst across all customers. Following prior studies (Shen & Yu, Citation2021; Shen et al., Citation2012), we control for suppliers’ and customers’ characteristics. All key variables are as defined in . We also include firm fixed effects and year fixed effects. According to Hypothesis 1, the sign of the coefficient on Sranalyst, , should be significantly negative.
Table 1. Definitions of key variables.
5. Empirical results
5.1. Descriptive statistics
presents sample distributions by year. In general, the sample first increased and then gradually decreased. reports the descriptive statistics for the variables used in our main analysis. It shows that: (1) the mean value of Absinv is 0.049. This indicates that on average, sample firms’ inefficient investment accounts for 4.9% of total assets at the period’s beginning. (2) The mean value of Sranalyst is 0.021 and the mean value of Analyst is 0.378, indicating that about 37.8% of the supplier-customer pairs in the sample are covered by common analysts.
Table 2. Sample distributions by year.
Table 3. Descriptive statistics.
5.2. Basic empirical results
reports the estimation results of EquationEq. (2)(2)
(2) . Consistent with our prediction, the coefficient on Sranalyst is significantly negative at the 1% level, indicating that when the supplier and customer are covered by common analysts, the supplier’s inefficiency investment is significantly lower, that is, supplier’s investment efficiency is significantly higher. Hypothesis 1 is supported. The estimated coefficient on Sranalyst is −0.062. It means a one standard deviation increase in Sranalyst would decrease Absinv by 0.41%, which corresponds to a decrease of 8.4% relative to the mean value of Absinv. Regarding the control variables, the results are largely consistent with the literature (Lu et al., Citation2015; Yang et al., Citation2017; Yao et al., Citation2020; Zhang et al., Citation2014).
Table 4. Common analysts and suppliers’ investment efficiency.
6. Cross-sectional tests
We argue that suppliers collect extensive information about customers’ business prospects when making investment decisions, whereas common analysts have an information advantage. Therefore, suppliers can resort to common analysts for customers’ business prospect information and incorporate it into their investment decisions, leading to better investment efficiency. Based on the argument, common analysts’ improving effect is closely related to suppliers’ demand for customers’ business prospect information from common analysts and common analysts’ information advantage about such prospects. Common analysts should have a greater effect on improving suppliers’ investment efficiency if suppliers have a higher demand for obtaining customers’ business prospect information from common analysts and common analysts have a greater information advantage about such prospects. We conduct several cross-sectional tests from the above two aspects to validate our primary findings.
6.1. Suppliers’ demand for obtaining customers’ business prospect information from common analysts
This section first analyses how suppliers’ demand for obtaining customer information from common analysts influences the relation between common analysts and suppliers’ investment efficiency. Given that common analysts have information advantages regarding customers’ business prospects, they would have greater effects on suppliers’ investment efficiency if suppliers have higher demands for obtaining customers’ business prospect information from common analysts. Suppliers can collect customers’ business prospect information by directly communicating with customers, analysing customers’ public information, or resorting to common analysts for their private information. Suppliers will experience higher demand for customers’ business prospect information from common analysts when directly communicating with customers is difficult (e.g. the supplier has a shorter relationship with and is smaller than its customers), or analysing customers’ public information is difficult (e.g. the customer has fluctuating earnings and poorer accounting information quality). Therefore, we expect common analysts to play a stronger role in improving suppliers’ investment efficiency under these circumstances.
6.1.1. The cooperation between suppliers and customers
Suppliers will be more familiar with customers and have more opportunities to communicate directly with them if they cooperate for a lengthy period. Suppliers are more able to analyse customer information and predict customers’ business prospects after communicating directly with them (Kadapakkam & Oliveira, Citation2021). In contrast, suppliers have fewer opportunities to communicate directly with customers and are less able to analyse customer information when they cooperate for a short time. In this situation, suppliers have a greater demand to obtain information about customers’ business prospects from common analysts, and they will play a stronger role in improving suppliers’ investment efficiency.
Following Kadapakkam and Oliveira (Citation2021), we partition our sample based on the median value of the cooperation year between suppliers and customers and estimate EquationEq. (2)(2)
(2) separately for each subsample. presents the results of each partitioned subsample based on the year of cooperation. The coefficient on Sranalyst is significantly negative at the 5% level when suppliers and customers have shorter cooperation. The coefficient on Sranalyst is significantly negative at the 10% level when they have longer cooperation. More importantly, the difference in the coefficients on Sranalyst between the two subsamples is statistically significant at the 1% level. The results suggest a stronger association between common analysts and supplier investment efficiency for suppliers with greater information demand, resulting from shorter cooperation with customers.
Table 5. Cross-sectional analysis based on suppliers’ demand: cooperation year.
6.1.2. Suppliers’ relative size
Suppliers with a smaller size relative to their customers tend to have weak bargaining power and have an information disadvantage (Chen et al., Citation2019). Therefore, such suppliers have diminished capacity to collect information directly from customers and have greater demand to obtain information about customers’ business prospects from common analysts. Consequently, we expect common analysts to have a stronger association with suppliers’ investment efficiency for relatively small suppliers.
We partition our sample based on the median value of the relative size of suppliers by year and estimate EquationEq. (2)(2)
(2) separately for each subsample. presents the results of each partitioned subsample based on the suppliers’ relative size. The coefficient on Sranalyst is significantly negative at the 5% level when suppliers are relatively smaller. The coefficient on Sranalyst is not significant when they are relatively larger. In addition, the difference in the coefficients on Sranalyst between the two subsamples is statistically significant at the 10% level. The results imply a stronger association between common analysts and supplier investment efficiency for suppliers with greater information demand, resulting from a relatively small size.
Table 6. Cross-sectional analysis based on suppliers’ demand: suppliers’ relative size.
6.1.3. Customers’ earnings fluctuation
It is more difficult for suppliers to predict customers’ business prospects by analysing their public information when customers have volatile earnings. These suppliers are likely to be more diligent in gathering information to better acquaint themselves with future customer profitability. An important task of analysts is to analyse and forecast the earnings of covered firms. For example, analysts disaggregate customer earnings’ core drivers and recognise the causes of abnormal earnings to forecast customer earnings. Therefore, common analysts can integrate supplier and customer information and analyse it with their superior ability. To optimise investment decisions, suppliers are more likely to resort to common analysts for customers’ business prospect information when customers have volatile earnings.
Following Zeng and Lu (Citation2016), we measure customers’ earnings fluctuation using the sales-weighted average of customers’ standard deviation of ROE in the last five years. We partition our sample based on the median value of customers’ standard deviation of ROE by year and estimate EquationEq. (2)(2)
(2) separately for each subsample. presents the results of each partitioned subsample based on the customers’ standard deviation of ROE. The coefficient on Sranalyst is significantly negative at the 5% level when customers have higher earnings fluctuation. The coefficient on Sranalyst is not significant when customers have lower earnings fluctuation. In addition, the difference in the coefficients on Sranalyst between the two subsamples is statistically significant at the 5% level. These results imply that common analysts are more helpful in improving suppliers’ investment efficiency when customers have volatile earnings.
Table 7. Cross-sectional analysis based on suppliers’ demand: customers’ earning fluctuation.
6.1.4. Customers’ accounting information quality
Accounting information is an important source of public information for firms. High-quality accounting information helps alleviate information asymmetry between firms and stakeholders. Comparability is an important characteristic of accounting information quality.Footnote6 Suppliers can only estimate customers’ business prospects based on the accounting information disclosed by them when the accounting information comparability is lower. Additionally, it is difficult to cross-verify the accounting information of customers’ comparable firms. In this case, the suppliers’ demand for obtaining customers’ business prospect information from common analysts increases and the role of common analysts in improving suppliers’ investment efficiency will be enhanced.
Following De Franco et al. (Citation2011), we measured the comparability of customer accounting information using the sales-weighted average of the comparability mean between customers and other firms in the same industry. We partition our sample based on the median value of customers’ accounting information comparability by year and estimate EquationEq. (2)(2)
(2) separately for each subsample. presents the results of each partitioned subsample based on this criterion. The coefficient on Sranalyst is significantly negative at the 5% level when customers have lower accounting information comparability. The coefficient on Sranalyst is not significant when customers have higher accounting information comparability. In addition, the difference in the coefficients on Sranalyst between the two subsamples is statistically significant at the 1% level. These results imply that common analysts are more helpful in improving suppliers’ investment efficiency when customers have poorer accounting information quality.
Table 8. Cross-sectional analysis based on suppliers’ demand: customers’ accounting information quality.
6.2. Common analysts’ information advantage regarding customers’ business prospects
This section analyses how common analysts’ information advantage regarding customers’ business prospects influences the relation between common analysts and suppliers’ investment efficiency. Given that suppliers have a certain demand to obtain customers’ business prospects from common analysts for investment decisions, the relation between common analysts and suppliers’ investment efficiency will be stronger if common analysts have a greater information advantage about customers’ business prospects. Following Martens and Sextroh (Citation2021), we investigate heterogeneity in common analysts’ information advantages from the following four perspectives:
Common analysts’ customer-industry specialisation. Industry knowledge is the most useful input for analysts’ earnings forecasts (Brown et al., Citation2015). Common analysts can accumulate more customer-industry knowledge to better estimate customers’ business prospects when they primarily cover customers’ industries. We divide the independent variable Sranalyst into two variables: Sranalyst_high1 equals one if common analysts primarily cover customers’ industries, and zero otherwise. Then we calculate the sales-weighted average value. Sranalyst_regular1 equals one if common analysts do not primarily cover customers’ industries, and zero otherwise, then the sales-weighted average value is calculated. To measure whether common analysts primarily cover the customer industry, we first calculate the ratio of the number of customer-industry firms in every analyst’s portfolio each year. Then, we classify common analysts to primarily cover the customer industry if more than half of common analysts’ ratios exceed the 90th percentile across all analysts’ ratios in the same year.
Common analysts’ information about customers’ competitors. Common analysts can combine information about customers’ competitors to more accurately estimate customers’ business prospects when they cover more firms in customers’ industries. We divide the independent variable Sranalyst into two variables: Sranalyst_high2 equals one if common analysts cover more firms in the customer’s industry, and zero otherwise. Then we calculate the sales-weighted average value. Sranalyst_regular2 equals one if common analysts cover regular firms in the customer’s industry, and zero otherwise, then the sales-weighted average value is calculated. To measure whether common analysts cover more firms in the customer industry, we first calculate the number of customer-industry firms in every analyst’s portfolio each year. We then classify common analysts to obtain more information about customers’ competitors if more than half of common analysts’ number covering customer-industry firms exceeds the 90th percentile across all analysts in the same year.
Whether common analysts are star analysts. Star analysts have higher positions, powerful influence on the capital market, and various sources of information (Liu & Chen, Citation2019). Therefore, common star analysts have more information sources and a stronger ability to predict customers’ business prospects. We divide the independent variable Sranalyst into two variables: Sranalyst_high3 equals one if more than half of the common analysts are star analysts, and zero otherwise, then the sales-weighted average value is calculated. Sranalyst_regular3 equals one if less than half of the common analysts are star analysts, and zero otherwise, then the sales-weighted average value is calculated.
Common analysts’ working experience. Common analysts can accumulate more industry and firm-level information if they have greater working experience. We divide the independent variable Sranalyst into two variables: Sranalyst_high4 equals one if common analysts have more working experience, and zero otherwise, then the sales-weighted average value is calculated. Sranalyst_regular4 equals one if common analysts have regular working experience, and zero otherwise, then the sales-weighted average value is calculated. To measure whether common analysts have more working experience, we first calculate every analyst’s years of experience each year. Then we classify common analysts as having more working experience if more than half of common analysts’ working years exceed the 90th percentile across all analysts in the same year.
We estimate EquationEq. (2)(2)
(2) using the above variable. First, we replace Sranalyst with Sranalyst_high1 and Sranalyst_regular1, which are proxies for common analysts’ customer-industry specialisation. column (1) shows that the coefficient on Sranalyst_high1 is significantly negative at the 1% level and that on Sranalyst_regular1 is significantly negative at the 5% level, indicating that common analysts with high or regular customer-industry specialisation can improve suppliers’ investment efficiency. The coefficient on Sranalyst_high1 is −0.681, and that on Sranalyst_regular1 is −0.055. The difference in the coefficients is significant at the 1% level, which suggests that common analysts with a higher customer-industry specialisation have a greater effect on suppliers’ investment efficiency.
Table 9. Cross-sectional analysis based on common analysts’ information advantage.
Second, we replace Sranalyst with Sranalyst_high2 and Sranalyst_regular2, which are proxies for common analysts’ information about customers’ competitors. column (2) shows that the coefficient on Sranalyst_high2 is significantly negative at the 1% level and that on Sranalyst_regular2 is significantly negative at the 5% level, indicating that common analysts with more or regular information about customers’ competitors can improve suppliers’ investment efficiency. The coefficient on Sranalyst_high2 is −0.107, and that on Sranalyst_regular2 is −0.048. The difference in the coefficients is significant at the 10% level, which suggests that common analysts with more information about customers’ competitors have a greater effect on suppliers’ investment efficiency.
Third, we replace Sranalyst with Sranalyst_high3 and Sranalyst_regular3, which are proxies for whether common analysts are star analysts. column (3) shows that the coefficient on Sranalyst_high3 is significantly negative at the 1% level and that on Sranalyst_regular3 is significantly negative at the 5% level, indicating whether common analysts are star analysts, they can improve suppliers’ investment efficiency. The coefficient on Sranalyst_high3 is −0.159 and that on Sranalyst_regular3 is −0.049. The difference in coefficients is significant at the 5% level, which suggests that common star analysts have a greater effect on suppliers’ investment efficiency.
Fourth, we replace Sranalyst with Sranalyst_high4 and Sranalyst_regular4, which are proxies for common analysts’ working experience. column (4) shows that the coefficient on Sranalyst_high4 is significantly negative at the 5% level and that on Sranalyst_regular4 is significantly negative at the 5% level, indicating that common analysts with more or regular working experience can improve suppliers’ investment efficiency. The coefficient on Sranalyst_high4 is −0.192, and that on Sranalyst_regular4 is −0.049. The difference in coefficients is significant at the 5% level, which suggests that common analysts with more working experience have a greater effect on suppliers’ investment efficiency.
7. Robustness tests
7.1. Alternative proxy for investment efficiency
We use the residuals estimated from the model of Biddle et al. (Citation2009) as an alternative proxy for suppliers’ investment efficiency (Absinv2). The model is a regression of the investment in lagged sales growth. shows that the coefficient on Sranalyst remains significantly negative at the 1% level, indicating that our main result holds for different measurements of investment efficiency.
Table 10. Alternative proxy for investment efficiency.
7.2. Control the influence of other information channels
Existing studies have explored the influence of common auditors (Dhaliwal et al., Citation2017) and common directors (Minnick & Raman, Citation2017) between suppliers and customers on suppliers’ investment decisions. To exclude the interference of common auditors and directors in our main result, we further control two variables: common auditors (Srcommonauditor) and common directors (Srcommondirector). As shows, the coefficient on Sranalyst remains significantly negative at the 1% level, which means that our main result holds after controlling for the influence of common auditors and directors. Meanwhile, the coefficients on Srcommonauditor and Srcommondirector are not significant. Possible reasons are as follows. First, Dhaliwal et al. (Citation2017) and Minnick and Raman (Citation2017) are based on listed firms in the United States. Owing to differences in the institutional environment between China and the United States, our study may not find corresponding significant results. Second, the proportion of suppliers and customers with common analysts is about 37.81%, while the proportion of common auditors is about 1.79%, and the proportion of common directors is about 4.66% in our sample. It is difficult to find significant results since it is relatively rare for suppliers and customers to share auditors and directors.
Table 11. Control the influence of other information channels.
7.3. Control the influence of customer accounting information quality
Existing studies have found that customers’ high accounting information quality can help suppliers better predict customers’ future demand and improve their investment efficiency (Chen et al., Citation2021). We further control the influence of customer accounting information quality. Following Chen et al. (Citation2021), we measure customer accounting information quality using the reverse of the three-year standard deviation of residuals from the DD model (AQ_cut_sd). A higher value of AQ_cut_sd reflects better customers’ accounting information quality. shows that consistent with Chen et al. (Citation2021), the coefficient on AQ_cut_sd is significantly negative, which means that customers’ high accounting information quality improves suppliers’ investment efficiency. Meanwhile, the coefficient on Sranalyst remains significantly negative at the 1% level, indicating that our main result is robust after controlling the influence of customer accounting information quality.
Table 12. Control the influence of customer accounting information quality.
7.4. Endogeneity
We use firm fixed effects, year fixed effects, and control for known factors associated with suppliers’ investment efficiency in the main model. However, it remains possible that some omitted factors contribute to both common analyst coverage and better supplier investment efficiency. In addition, suppliers with higher investment efficiency may attract analysts who follow customers to follow them at the same time. In conclusion, our study may have endogeneity concerns resulting from omitted variables and reverse causality. To address this concern, we use the propensity score matching method (PSM) and construct different-in-difference tests (DID) by investigating supplier firms that experience a decrease in the coverage of common analysts for relatively exogenous shock and M&A events.Footnote7
7.4.1. Propensity score matching
Analysts may obtain benefits by covering both suppliers and customers because of the economic link between them. If analysts endogenously make their coverage decisions, which leads to a positive association between common analyst coverage and suppliers’ investment efficiency, our main result may be affected. We use the PSM method to address this concern.
To construct the matched sample, we follow Guan et al. (Citation2015) to estimate EquationEq. (3)(3)
(3) for the presence of common analysts using the supplier-customer-year dataset.
The dependent variable Analyst equals one if the supplier and its customer are covered by the same analyst, and zero otherwise. According to Guan et al. (Citation2015), we include the following factors that may influence analysts’ coverage decisions: the natural logarithm of the supplier’s equity market capitalisation (Mktv_sup), the natural logarithm of the supplier’s annual trading volume (Volume_sup), the natural logarithm of the customer’s equity market capitalisation (Mktv_cut), the natural logarithm of the customer’s annual trading volume (Volume_cut), the customer’s leverage ratio (Leverage_cut), whether the supplier and customer are in the same industry (Sameind), and the percentage of supplier’s sales to its customers (Ratio). Controls represent all control variables in EquationEq. (2)(2)
(2) . The results show that the larger supplier’s equity market capitalisation, the smaller supplier’s trading volume, the higher percentage of supplier’s sales to its customers, and the same industry will result in a higher propensity for an analyst to cover both a supplier and its customer.
We use a 0.01 calliper and the 1:1 nearest neighbour matching method. Finally, we obtain 812 supplier-customer-year observations, and all variables pass the balance test. According to Luo and Yu (Citation2019), we use a sales-weighted average method to transform the matched samples and then estimate EquationEq. (2)(2)
(2) . shows that the coefficient on Sranalyst is significantly negative at the 1% level.
Table 13. PSM method.
7.4.2. Common analyst departures
In social network research, researchers usually search for shocks that lead to relatively exogenous changes in relationships. The common method is to construct a quasi-DID model by using events that lead to relationship interruption, such as individual departure, death, and retirement. Analyst departures are commonly used as exogenous shocks in analyst research.
Following Li et al. (Citation2020), we use the relatively exogenous shock of common analyst departures and examine its effect on suppliers’ investment efficiency to address endogeneity concerns resulting from omitted variables and reverse causality. Analysts choose to depart mainly for their career planning, which is less influenced by individual firms. Therefore, the departure shock is relatively exogenous. We should observe no significant difference between the effect of common analyst departures on a supplier’s investment efficiency, relative to non-common analyst departures, if the relation is driven by other unobservable factors (omitted variable), or if suppliers with higher investment efficiency attract analysts who follow customers to follow them simultaneously (reverse causal). Otherwise, we should observe that a supplier’s investment efficiency decreases after common analyst departures if they play a role in improving the supplier’s investment efficiency.
Following Li et al. (Citation2020), we consider an analyst to depart if she or he stops issuing forecasts. Specifically, we identify analyst departures when the analyst last issued a forecast in 2018 or earlier. We use EquationEq. (4)(4)
(4) to compare the effect of common analyst departures on suppliers’ investment efficiency relative to departures of non-common analysts. Treat equals one if departure analysts involve common analysts and zero otherwise. When we set a three-year observation period, Post equals one for the analyst’s departure year and the next year, and zero for the year before while he or she followed the firm. When we set a two-year observation period, Post equals one for the analyst’s departure year and zero for the year before while he or she follows the firm. To identify the effect of analyst departures on supplier investment efficiency more accurately, we delete the sample with two or more consecutive years of analyst departures. column (1) shows the result of the three-year observation period, and column (2) shows the result of the two-year observation period. The coefficient on Treat*Post is significantly positive, indicating that compared with non-common analyst departures, after common analyst departures, the supplier’s inefficiency investment increases significantly, that is, the investment efficiency decreases. These results show that common analysts do improve suppliers’ investment efficiency. The tests largely overcome potential endogeneity concerns caused by omitted variables and reverse causality.
Table 14. The influence of common analysts’ departures.
7.4.3. Supplier M&A performance
Following Chen et al. (Citation2019), we examine the effect of common analysts on supplier subsequent M&A performance. According to Chen et al. (Citation2019), first, M&A is an important investment activity. Good M&A performance reflects high investment efficiency. Second, comparing the performance differences between suppliers with and without common analysts before and after M&A events is equivalent to applying the difference-in-differences (DID) method. Finally, testing the influence of common analyst coverage in the current year on supplier M&A performance in subsequent years is equivalent to using lag regression. Therefore, supplier M&A performance analysis can alleviate the endogeneity concern.
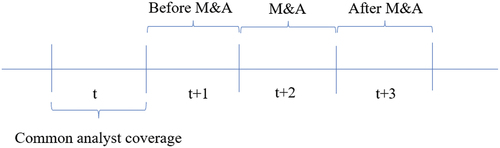
shows the timelines of common analyst coverage and supplier M&A performance. First, the supplier has common analysts with the customer in period t. Second, the supplier announces the M&A event in period t + 2. Finally, we examine the influence of common analyst coverage in period t on the supplier’s M&A performance in period t + 2 by measuring the change in performance of the supplier before and after the M&A event (the change in performance in period t + 1 and period t + 3).
Figure 1. The timelines of common analyst coverage and supplier M&A performance.
We set the following model:
The dependent variable Chg_ROAi,t+2 represents the supplier M&A performance in period t + 2. We set the benchmark as ROA of firms in the same industry without M&A and common analysts during the same period (Chen et al., Citation2019). We measure Chg_ROAi,t+2 in the following way.
First, we calculate the supplier ROA before the M&A announcement (period t + 1), subtracted by the mean ROA of all supplier firms without M&A and common analysts in the same industry during the same period. Second, we calculate the supplier ROA after the M&A announcement (period t + 3), subtracted by the mean ROA of all supplier firms without M&A and common analysts in the same industry during the same period. Third, we calculate the difference between the ROA difference before and after the M&A announcement as our dependent variable in EquationEq. (5)(5)
(5) . The independent variable Sranalysti,t indicates whether the supplier shares common analysts with its customer in period t. We restrict the sample to suppliers with M&A events in the period t + 2. shows that the coefficient on Sranalyst is significantly positive, indicating that common analysts can improve suppliers’ M&A performance in subsequent periods and improve their investment efficiency.
Table 15. Common analysts and suppliers’ M&A performance.
8. Conclusion
This study examines the effect of common analysts covering both suppliers and their major customers on suppliers’ investment efficiency. Using a sample of A-share listed firms in China from 2007 to 2018, we find that suppliers with common analyst coverage exhibit higher investment efficiency. This effect is stronger when suppliers have greater demand for obtaining customer information from common analysts, for example, when suppliers have shorter relationships with and are smaller than their customers, and when their customers have more fluctuating earnings and poorer accounting information quality. It is also stronger when common analysts possess a distinct information advantage about customers, for example, when they have relatively higher customer industry specialisation, more information about customers’ competitors, more experience, and are star analysts. Our results are robust to a series of robustness checks and endogeneity tests. Taken together, our results suggest that suppliers can obtain prospective information about their customers from common analysts, which facilitates suppliers’ efficient investment.
Our findings have several important implications. Firms can predict future demand more accurately and enrich the investment information set by resorting to common analysts for customers’ business prospect information. Investors can improve portfolio returns by selecting firms covered by common analysts because smooth information flow can improve the supply chain value.
Disclosure statement
No potential conflict of interest was reported by the authors.
Additional information
Funding
Notes
1 About 51% (95%) of the listed supplier-customer pairs are from different industries according to one (three) CSRC industry code in our sample.
2 The proportion of suppliers and customers with common analysts is about 37.81%, while the proportion of common auditors is about 1.79%, and the proportion of common directors is about 4.66% in our sample.
3 Park and Soltes (Citation2018) investigated questions that analysts might raise to the management in private communication. For example, analysts asked ‘The disclosed gross margin for this product is 20%. What is the gross margin broken down to each component?’ to verify public information, and asked ‘Are second-quarter earning guidance still valid?’ to obtain future performance information.
4 We verify common analysts’ information advantage about customers’ business prospects by providing empirical evidence that common analysts provide more accurate earnings forecasts for the customers than those who do not. It means common analysts possess a distinct information advantage about customers’ business prospects to some degree.
5 Similarly, existing studies have found that suppliers can expand specific investments by obtaining private information from the social network formed by common auditors (Dhaliwal et al., Citation2017) and common directors (Minnick & Raman, Citation2017) with customers.
6 In addition, we also use transparency to measure customers’ accounting information quality. Following Dechow et al. (Citation1995), we measure accounting information transparency using earnings management.The result shows that the coefficient on Sranalyst is negative and significant only for suppliers whose customers accounting information transparency is lower.
7 Besides, we also adopt the lag regression and use the number of departures for analysts who follow customers every year to construct instrumental variables for regression to alleviate the endogeneity concern. Our results are robust in these tests.
References
- Bae, J., Biddle, G. C., & Park, C. W. (2022). Managerial learning from analyst feedback to voluntary capex guidance, investment efficiency, and firm performance. Management Science, 68(1), 583–607. https://doi.org/10.1287/mnsc.2020.3896
- Becher, D. A., Cohn, J. B., & Juergens, J. L. (2015). Do stock analysts influence merger completion? An examination of postmerger announcement recommendations. Management Science, 61(10), 2430–2448. https://doi.org/10.1287/mnsc.2014.2065
- Biddle, G. C., Hilary, G., & Verdi, R. S. (2009). How does financial reporting quality relate to investment efficiency? Journal of Accounting and Economics, 48(2–3), 112–131. https://doi.org/10.1016/j.jacceco.2009.09.001
- Boni, L., & Womack, K. L. (2006). Analysts, industries, and price momentum. The Journal of Financial and Quantitative Analysis, 41(1), 85–109. https://doi.org/10.1017/S002210900000243X
- Brown, L. D., Call, A. C., Clement, M. B., & Sharp, N. Y. (2015). Inside the “black box” of sell-side financial analysts. Journal of Accounting Research, 23(1), 1–47. https://doi.org/10.1111/1475-679X.12067
- Chen, C., Kim, J. B., Wei, M. H., & Zhang, H. (2019). Linguistic Information Quality in Customers’ Forward-Looking Disclosures and Suppliers’ Investment Decisions. Contemporary Accounting Research, 36(3), 1751–1783. https://doi.org/10.1111/1911-3846.12471
- Chen, T. Q., Li, D. D., & Hong, J. Q. (2021). Customers’ earnings quality and suppliers’ investment efficiency: Evidence from A-share listed companies. Nankai Business Review, 3, 193–203. In Chinese. https://doi.org/10.3969/j.issn.1008-3448.2021.03.019
- Chiu, T. T., Kim, J. B., & Wang, Z. (2019). Customers’ risk factor disclosures and suppliers’ investment efficiency. Contemporary Accounting Research, 36(2), 773–804. https://doi.org/10.1111/1911-3846.12447
- Choi, J. K., Hann, R. N., Subasi, M., & Zheng, Y. (2020). An empirical analysis of analysts’ capital expenditure forecasts: Evidence from corporate investment efficiency. Contemporary Accounting Research, 37(4), 2615–2648. https://doi.org/10.1111/1911-3846.12597
- Dechow, P. M., Sloan, R. G., & Sweeney, A. P. (1995). Detecting earnings management. The Accounting Review, 70(2), 193–225. https://doi.org/10.2307/258852
- De Franco, G., Kothari, S. P., & Verdi, R. S. (2011). The benefits of financial statement comparability. Journal of Accounting Research, 49(4), 895–931. https://doi.org/10.1111/j.1475-679X.2011.00415.x
- Dhaliwal, D. S., Shenoy, J., & Williams, R. (2017). Common auditors and relationship-specific investment in supplier-customer relationships. Social Science Research Network.
- Dou, Y. W., Hope, O. K., & Thomas, W. B. (2013). Relationship-specificity, contract enforceability, and income smoothing. The Accounting Review, 88(5), 1629–1656. https://doi.org/10.2308/accr-50489
- Granovetter, M. (2005). The impact of social structure on economic outcomes. Journal of Economic Perspectives, 19(1), 33–50. https://doi.org/10.1257/0895330053147958
- Guan, Y., Wong, M. H., & Zhang, Y. (2015). Analyst following along the supply chain. Review of Accounting Studies, 20(1), 210–241. https://doi.org/10.1007/s11142-014-9295-6
- Hertzel, M. G., Li, Z., Officer, M. S., & Rodgers, K. J. (2008). Inter-firm linkages and the wealth effects of financial distress along the supply chain. Journal of Financial Economics, 87(2), 374–387. https://doi.org/10.1016/j.jfineco.2007.01.005
- Hutton, A. P., Lee, L. F., & Shu, S. Z. (2012). Do managers always know better? The relative accuracy of management and analyst forecasts. Journal of Accounting Research, 50(5), 1217–1244. https://doi.org/10.1111/j.1475-679X.2012.00461.x
- Kadan, O., Madureira, L., Wang, R., & Zach, T. (2012). Analysts’ industry expertise. Journal of Accounting and Economics, 54(2–3), 95–120. https://doi.org/10.1016/j.jacceco.2012.05.002
- Kadapakkam, P., & Oliveira, M. (2021). Binding ties in the supply chain and supplier capital structure. Journal of Banking & Finance, 130, 106183. https://doi.org/10.1016/j.jbankfin.2021.106183
- Liu, Q. Q., & Chen, S. S. (2019). Cast sheep’s eyes: Managements’ guidance and analysts’ earnings forecast errors. Nankai Business Review, 5, 207–224. In Chinese. https://doi.org/10.3969/j.issn.1008-3448.2019.05.018
- Liu, H. L., Wang, C. F., & Wu, L. S. (2014). Decision rights allocation, earning management and investment efficiency. Economic Research Journal, 49(8), 93–106. In Chinese. http://www.cnki.com.cn/Article/CJFDTOTAL-JJYJ201408008.htm
- Li, Z., Wong, T. J., & Gwen, Y. (2020). Information dissemination through embedded financial analysts: Evidence from China. The Accounting Review, 95(2), 257–281. https://doi.org/10.2308/accr-52521
- Luo, S., & Nagarajan, N. J. (2015). Information complementarities and supply chain analysts. The Accounting Review, 90(5), 1995–2029. https://doi.org/10.2308/accr-51011
- Luo, T., & Yu, J. (2019). Friends along supply chain and relationship-specific investments. Review of Quantitative Finance and Accounting, 53(3), 1–37. https://doi.org/10.1007/s11156-018-0770-1
- Lu, C., Tang, S. Y., & Liao, G. M. (2015). Labour protection, labour intensity and investment efficiency. Accounting Research, 6, 42–47. In Chinese. https://doi.org/10.3969/j.issn.1003-2886.2015.06.006
- Ma, H. (2019). Common analysts and corporate mergers and acquisitions: Evidence from a quasi-natural experiment. Journal of Finance and Economics, 45(2), 113–125. In Chinese. https://doi.org/10.16538/j.cnki.jfe.2019.02.009
- Martens, T., & Sextroh, C. J. (2021). Analyst coverage overlaps and interfirm information spillovers. Journal of Accounting Research, 59(4), 1425–1480. https://doi.org/10.1111/1475-679X.12391
- Minnick, K., & Raman, K. (2017). Board composition and relationship‐specific investments by customers and suppliers. Financial Management, 46(1), 203–239. https://doi.org/10.1111/fima.12150
- Park, J., & Soltes, E. (2018). What do investors ask managers privately? Social Science Research Network. https://doi.org/10.2139/ssrn.3087369
- Raman, K., & Shahrur, H. (2008). Relationship-specific investments and earnings management: Evidence on corporate suppliers and customers. The Accounting Review, 83(4), 1041–1081. https://doi.org/10.2308/accr.2008.83.4.1041
- Richardson, S. (2006). Over-investment of free cash flow. Review of Accounting Studies, 11(2), 159–189. https://doi.org/10.1007/s11142-006-9012-1
- Shen, H. H., & Yu, P. (2021). The effect of tax depreciation on investment structure. Accounting Research, 2, 133–148. In Chinese. https://doi.org/10.3969/j.issn.1003-2886.2021.02.010
- Shen, H. H., Yu, P., & Wu, L. S. (2012). State ownership, environment uncertainty and investment efficiency. Economic Research Journal, 7, 113–126. In Chinese. http://www.cnki.com.cn/Article/CJFDTOTAL-JJYJ201207010.htm
- Soltes, E. (2014). Private interaction between firm management and sell-side analysts. Journal of Accounting Research, 52(1), 245–272. https://doi.org/10.1111/1475-679X.12037
- Yang, Z., Liu, F., & Li, M. M. (2017). Interest rate marketization, inefficient investment and capital allocation: Based on the natural experiment of cancellation of upper and lower limits for loan interest rates set by PBoC. Journal of Financial Research, 5, 81–96. In Chinese. http://www.cnki.com.cn/Article/CJFDTOTAL-JRYJ201705006.htm
- Yao, L. J., Chen, X. Y., Zhou, Y., & Chen, X. J. (2020). Managerial ability and investment efficiency. Accounting Research, 4, 100–118. In Chinese. https://doi.org/10.3969/j.issn.1003-2886.2020.04.009
- Zeng, X. Y., & Lu, Z. F. (2016). The information risk of earnings management, performance volatility, and audit opinions: How to escape from listed companies with extremely suspect earnings management? Journal of Finance and Economics, 42(8), 133–144. In Chinese. https://doi.org/10.16538/j.cnki.jfe.2016.08.012
- Zhang, J. Y., Ge, S. J., Zhao, J. W., Zhang, S., Wu, H., Zhang, C., Ge, J., Zhao, D., Li, Q., Song, Y., & Zhu, R. (2014). Media reports and investment efficiency. Accounting Research In Chinese, 10, 59–65. https://doi.org/10.3969/j.issn.1003-2886.2014.10.008
