
Abstract
In a pioneering work, this study explores the potential that may be found in combining the environmental psychological concept environmental worldview with the neurocognitive study technique electroencephalography (EEG). With this research, we aim to bridge between the research traditions of environmental communication and neuro-cognition by investigating in an qEEG experiment (N = 19) if different levels of environmental worldview, measured by the NEP, influence the processing of visual climate change imagery, reflected by the theta and gamma oscillations in the frontal and parietal areas. Our results confirm the assumptions that there is a relationship between the degree of environmental worldview and visual environmental communication processing. The pattern is interpreted as an indication that people with weak pro-environmental worldviews show cognitive signs of mismatch between what is in line with their environmental worldview and what they are confronted with in the visual stimulus.
Resumen
En un estudio pionero, este artículo explora el potencial que puede encontrarse en la combinación del concepto de psicología ambiental visión del mundo ambiental con la técnica neurocognitiva de estudio del electroencefalograma (EEG). Con esta investigación pretendemos enlazar las tradiciones de investigación de la comunicación ambiental y la neurocognición, estudiando a través de un experimento qEEG (N = 19) si diferentes niveles de la visión del mundo ambiental, medidos a través del nuevo paradigma ambiental (NPA), influyen en el procesamiento de imágenes sobre el cambio climático, y su reflejo en las oscilaciones theta y gamma de las áreas frontal y parietal. Nuestros resultados confirman la hipótesis de que existe una relación entre el grado de filiación a la visión del mundo ambiental y el procesamiento visual de información ambiental. Este patrón se interpreta como un indicio de que las personas con un nivel bajo de visión del mundo pro-ambiental muestran signos cognitivos de desajuste entre lo que coincide con su visión del mundo ambiental y aquello que los estímulos visuales representan.
Visual representations of climate change are often used in media coverage (Sheppard, Citation2012) and in campaigns that aim to motivate citizens to mitigate and adapt to the predicted consequences of climate change (Klöckner, Citation2015). For this reason, the effect of climate change imagery on inducing behavioural change has been subject to a variety of studies (see Klöckner (Citation2015) for a summary). However, this research is almost exclusively built on self-report measures, while neurocognitive research, on the other hand, could provide a way to investigate these questions from a neuronal level. This might help environmental psychologists to understand how psychological constructs impact people’s reaction to visual information campaigns. This line of research is not well defined yet, therefore we decided to focus on a very selected section of analysis: how does the degree to which an environmental worldview is embraced affect the patterns of brain oscillations in the theta and gamma bands after exposure to visual representations of climate change? First we will present what is known about the relationship between visual communication, environmental worldviews and pro-climate action, to be followed by a description of what neurocognitive research could add to this line of research. Finally, the setup for the current study and the results will be presented and discussed.
Visual climate change communication, environmental worldviews and action
Footnote1Visual environmental communication has the potential to enhance the understanding of climate change among the general public, by bridging between the abstract concepts surrounding climate change and every day experiences (Nicholson-Cole, Citation2005). Therefore, it is a promising tool to induce behavioural change among the general public (Klöckner, Citation2015). However, its effectiveness depends on the match between the targeted construct and where in the multi-staged process towards behavioural change the recipient is (for more information, see Klöckner, Citation2015; Bamberg, Citation2013). For instance, environmental communication that aims to induce behavioural change by improving recipients’ knowledge regarding a specific environmental behaviour has shown to only influence individuals with strong environmental orientated values (Bolderdijk, Gorsira, Keizer, & Steg, Citation2013). This is in accordance with current neurocognitive theories, which state that the human brain uses knowledge stored in the architecture of the brain derived from prior experiences to steer attention or induce action based on the presented information (Engel, Fries, & Singer, Citation2001). In other words, the brain uses top-down processes to select input that is meaningful for the individual in that specific moment. Hence, how climate change images are perceived by the recipients is likely to vary due to differences in stored information. Although environmental and cognitive psychology theories seem to align perfectly, this has not yet been explored.
Environmental worldview has shown to be of influence when inducing behavioural change (Dunlap, Citation2008). One of the most widely used instruments to measure people’s general environmental worldview is the New Environmental Paradigm (NEP) (Dunlap, Citation2008; Dunlap & Van Liere, Citation1978; Dunlap, Van Liere, Mertig, & Jones, Citation2000). This scale measures people’s acceptance that resources are limited, that humans are part of nature and that the equilibrium of natural systems can be disrupted by human activity. It can therefore be seen as a general measure of worldview on humans’ place in the world in relation to nature (Stern, Citation2000). In order to embrace the environmental worldview, specific knowledge regarding the statements should be acquired by the individual and stored in his or her memory. This paper will investigate if individuals with varying levels of environmental worldview have different brain activation patterns while viewing climate change imagery.
Previous findings on the implications of differences in theta and gamma oscillations
With brain patterns we mean electrical signals measured on the scalp that oscillate within different frequency bands across different brain areas. These oscillations arise from hundreds of thousands of neuronal cells that produce electrical activity and it is a process the brain uses to communicate across different neuronal areas (Başar, Başar-Eroglu, Karakaş, & Schürmann, Citation2001; Pfurtscheller & Lopes, Citation1999; Teplan, Citation2002). They enable an individual to reconstruct a visual stimulus into unique spatiotemporal patterns, e.g., shape, colour, spatial orientation, location or movement (Ungerleider & Haxby, Citation1994). Simultaneously, they activate memory templates to enable the accessibility of stored knowledge while processing the incoming visual stimulus (Başar, Başar-Eroğlu, Karakaş, & Schürmann, Citation1999, Citation2001; Buschman & Miller, Citation2007; Engel et al., Citation2001). How these bottom-up and top-down processes interact is not yet fully understood (Engel et al., Citation2001; Milner & Goodale, Citation1995). However, it is thought that the information from both processes is being matched and that the information is utilized as a result of this match (Herrmann, Munk, & Engel, Citation2004). The frequency bands that have been associated with this top-down processing and with the matching between top-down and bottom-up processes in particular are the theta (~4 – 7 Hz) and gamma (~30 to 70 Hz) bands (Herrmann & Demiralp, Citation2005; Klimesch, Citation1996; Osipova et al., Citation2006). Additionally, these top-down processes are thought to originate in the frontal and parietal cortex, which are areas known for their involvement in semantic memory storage, of which environmental worldview is an example (Binder, Desai, Graves, & Conant, Citation2009).
Therefore, in this paper we will look into the effect of environmental worldview on the processing of climate change imagery reflected by the gamma and theta band oscillations in the frontal and parietal brain areas. Individuals with weak or strong environmental worldview might show different oscillatory patterns, due to their difference in prior stored general environmental knowledge. More embracement of the environmental worldview might be reflected by an increase in gamma and theta oscillations in the frontal and parietal areas, as more environmental knowledge is stored in those individuals (Binder et al., Citation2009).
Method
Participants
Twenty healthy volunteers took part in the study, of which one was excluded due to a software error. An almost equal amount of males (N = 11) and females took part. Nearly half were between 21–25 years (N = 12), the rest were between 26–30 years (N = 4), 36–40 years (N = 1) or 40–45 years (N = 2). The participants had finished high school (N = 7), bachelor (N = 8), master (N = 2) or PhD level (N = 2) as their highest education. As a response to the question ‘How often are you on average exposed to environmental communication?’, the participants reported zero to once (N = 8), two to five times (N = 9) or more than five times (N = 2) per week. As a response to the question ‘When was the last time that you were exposed to environmental communication?’, the participants reported the day of the test (N = 11), within the last week (N = 5) or before the last week (N = 3).
All participants were informed about the scope and design of the study and gave their written consent for participation.
Instruments
Environmental worldview: measured by the NEP (Cronbach’s Alpha = .64; M = 57.21; SD = 6.71), which contained 15 items that were rated on a five-point Likert scale (Dunlap, 2000). The overall score per subject was calculated by summing up all item scores, after inverting some of the questions to control for reverse wordings. High scores mean stronger embracement of limitation of resources, delicate equilibria in nature and humans as part of a natural system.
Climate change imagery: obtained, with permission, from a database with visual climate change imagery as often used by mass media. Containing images from UK, USA and Australian newspapers (O’Neill, Citation2013; O’Neill, Boykoff, Niemeyer, & Day, Citation2013; O’Neill & Smith, Citation2014).
Brain oscillations: measured by quantitative electroencephalography (qEEG), a device that captures electrical neuronal activity with a high temporal resolution (Pfurtscheller & Lopes, Citation1999; Teplan, Citation2002). Specifically, we used a 19-scalp site Tin-electrode cap (ElectroCap, United States) Mitsar amplifier (Mitsar EEG-201, St.Petersburg, Russia) and the WinEEG 2.84.44 software package (Mitsar, St.Petersburg, Russia). The arrangement of the electrodes was according to the International 10–20 system against linked earlobes reference electrodes. The ground electrode was placed 1.5 cm anterior to the frontal midline electrode (Fz). Electro Gel and NuPrep gel (50:50) (ElectroCap, United States) were used to achieve contact between the electrodes and the scalp, and Ten 20 EEG paste (D-O. Weaver and CO, USA) to attain contact between the earlobes and the reference electrodes. Impedance was kept below 10 kΩ. Sampling rate was 250 Hz, and band-pass filter ranged from 0 – 70 Hz. A notchfilter was set to 45–55 in order to reduce electrical inference. The electrodes used for analyses were those recording neuronal signals from the frontal (Fp1, Fp2, F3, Fz, F4) and parietal (P3, Pz, P4) areas.
Climate change recognition (error percentage): in the task described below, participants were instructed to press a response button when they viewed two climate change images in sequence. We were interested in how environmental worldview affects the processing of these images. However, a potential confound is the lack of recognizing the climate change image as such. Therefore, we additionally measured the percentage of erroneous responses (M = 30.79; SD = 20.62).
Design
After the participants filled in the NEP they were seated in a comfortable chair, 1.5 m in front of a computer screen, to view stimuli shown on a 38 cm monitor using the Psytask (Mitsar Ltd.) software, while the EEG was recorded.
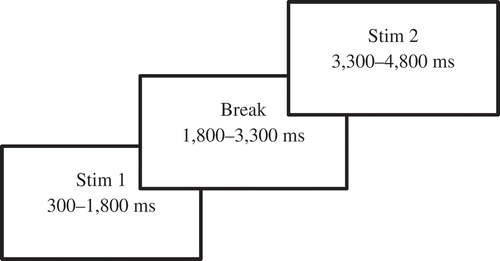
The task, a variant of the Visual Continuous Performance Task (Rosvold, Mirsky, Sarason, Bransome, & Beck, Citation1956), took approximately 45 minutes to complete. Three categories of images were used for the experiment: (1) climate change imagery (‘EC’); (2) images from category 1, but altered using Photoshop to remove the environmental message (‘non-EC’), e.g., in an image with a polar bear in a landscape, the polar bear was erased; (3) images of furniture (‘furniture’). Each trial consisted of a pair of stimuli: EC – EC, EC – non-EC, non-EC – non-EC or furniture – furniture. However, since the latter two consist of images that are not climate change related, they are beyond the scope of this paper. The brain signals while viewing the first stimuli of the EC – non-EC trails are of interest, but unfortunately were lost due to a software error and therefore not included in the analyses of this study. The trials were equally distributed and shown in random order with a total of 100 trials per participant. Participants were instructed to only press a response button when the two climate change images were shown subsequently. The Visual Continuous Performance Task was chosen because of its strong validity in the original version and known effects on brain signals (Rosvold et al., Citation1956). However, after a pilot test using the original presentation times (100 ms) we noticed that the stimulus presentation of the images was too short for participants to understand the images and needed to be prolonged. Therefore, each image was shown for 1,500 ms, with a 1,500 ms break (see ). One male participant stopped after 70 trials and three (two male) after 50 trials due to fatigue; the provided data was included in the analyses.
Figure 1. Schematic overview of EEG task.
EEG data modelling
Eye-blink artefacts were corrected by zeroing the activation curves of individual independent component analysis (ICA) corresponding to eye blinks (Vigário, Citation1997). In addition, the EEG was manually inspected to verify artefact removal. A filter was set at 4–8 Hz for the theta and 30–50 Hz for the gamma band. The data of stimulus presentation in EC-EC trails were computed into event-related oscillations, baseline corrected for activity prior to presenting stimulus one. Subsequently, the average power was calculated per electrode and frequency band while viewing stimulus one, two and during the break inbetween those images.
Statistics
Statistical analyses were performed by Statistical Package for Social Sciences (SPSS inc. Chicago, IL, USA) for Windows version 23. Spearman’s rank order correlation was used to analyse if the participants’ gender, age group, education, frequency and most recent exposure to environmental communication were related to the NEP score or percentage of trials that were answered erroneously. The correlation between the average theta or gamma power and NEP as well as the error percentage was calculated with Pearson coefficients.
Results
Gender, age, education, frequency and most recent exposure to environmental communication had no relation to the NEP score, or percentage of errors. Also, NEP [M = 57.21; SD = 6.71] and the percentage of errors [M = 30.79; SD = 20.62] were not significantly correlated (r = −.25, p = .31). However, age correlated positively with education (r = .52, p = .02) and education correlated positively with gender (r = .70, p = .00). Additionally, the last exposure to environmental communication correlated negatively with age (r = −.48, p = .04), with education (r = −.60, p = .01) and gender (r = −.48, p = .04).
shows the correlation coefficients between the NEP with the theta and gamma oscillation power in different brain regions. We analysed the correlation between the NEP and brain oscillations while viewing stimulus 1, stimulus 2 and inbetween both viewings. It shows that NEP was significantly negatively correlated with the power of gamma oscillations in the right prefrontal area while viewing stimulus 1 (r = −.51, p = .03) and inbetween viewing stimulus 1 and 2 (r = −.58, p = .01). This means that for participants with higher NEP scores gamma power decreased during and after processing a climate change related visual stimulus as compared to participants with lower NEP scores. It is important to note that no correction was performed to avoid alpha error inflation. This would exclude the two significant results. However, based on the rather substantial size of the correlation we chose to report them as preliminary results in an exploratory study. Additionally, the brain oscillations were correlated with percentage of error. There was no significant correlation between the percentage of error and the theta or gamma oscillations.
Table 1. Correlation coefficients between the NEP and the oscillations from different brain areas (Fp1, Fp2, F3, Fz, F4, P3, Pz, P4) in the theta and gamma frequency band. Stim 1 refers to the viewing of the first image, stim 2 to the viewing of the second image and break refers to the time inbetween the two viewings.
Discussion
This study analysed the processing patterns of climate change imagery in the brain by using qEEG. The purpose was to see if different degrees to which an environmental worldview is embraced influences how the brain processes visual climate change imagery as reflected by top-down processing. The results show that a stronger environmental worldview is negatively correlated with gamma oscillations in the right prefrontal cortex. In prior studies, the amount of gamma oscillations has been found to increase when new incoming information was matched with prior stored information (Herrmann & Demiralp, Citation2005). This is opposite to the pattern found in this study, where a stronger embracement of the environmental worldview led to a decrease in gamma oscillations. One could speculate that the oscillations do not reflect the amount of information that is already stored, but how the climate change issues are perceived. Since the oscillations were not correlated to the recognition of the climate change images and, additionally, a linguistic study that investigated the influence of worldview on information processing found an increase in gamma power when worldview was violated (Hagoort, Hald, Bastiaansen, & Petersson, Citation2004). Thus, individuals with more environmental worldview might have perceived the images (e.g., sea with windmills or polar bear on melting ice) as more compatible with their environmental worldview. This is in line with research showing that gamma oscillations are not only involved in matching new information with prior stored ones, but also with the utilization of that information (Herrmann et al., Citation2004). Thus, our data might confirm that humans evaluate presented information according to their own views (Nerlich, Koteyko, & Brown, Citation2010) and that their brain notices if information is violating the current worldview.
Participants with a higher environmental worldview were not more accurate in recognizing climate change images than those with lower environmental worldview. While this is a notable finding on the one hand, one should bear in mind that we used images as often used in mass media (O’Neill, Citation2013; O’Neill et al., Citation2013; O’Neill & Smith, Citation2014). Therefore, it is likely that participants have seen these or very similar images before.
Many oscillation bands did not show a correlation with environmental worldview. A part of these data does indicate a similar pattern in the gamma oscillations, but did not reach significance. One could speculate about what this result might reflect, for instance it could indicate that the top-down processes related to climate change information processing only take place in the gamma oscillations in the frontal areas. However, this line of research is too preliminary to speculate, since the non-significant findings could as well be due to some limitation(s). For instance, although the number of participants is not uncommon in EEG research (Fernández et al., Citation2007; Kelly, Gomez‐Ramirez, & Foxe, Citation2009; Siniatchkin et al., Citation2000; Tan et al., Citation2009), the number is relatively low, which makes it difficult to reach statistical significance even for relatively large correlation coefficients. Second, the scores on the NEP were normally distributed, but were all in the higher segment. This seems to be a characteristic of a university sample (Schultz & Zelezny, Citation1999). However, to get a clearer understanding of the influence of environmental worldview on information processing, it could be insightful for future studies to select participants with a wider range of NEP scores. Third, we prolonged the presentation time based on our pilot study to make sure participants had enough time to consciously process and understand the images. However, the increased duration may have lowered the concentration towards the end. Additionally, it makes it less clear which brain processes are captured in this prolonged presentation. Since power in oscillations can be altered by external events as viewing climate change images but as well by internal events as pondering. Therefore, the prolonged presentation time might have increased the chance of capturing cognitive functioning unrelated to visual environmental communication processing.
In this study we have chosen to investigate the effect of environmental worldview, since according to the Value-Belief-Norm theory (Stern, Citation2000), the step where the activation of norms most likely stops is between environmental worldview and the triggers of personal norm. However, this might also happen earlier in the chain, for instance at values, since this construct has shown to be most predictive for environmental behaviour (Steg, De Groot, Dreijerink, Abrahamse, & Siero, Citation2011). Therefore, we would like to encourage other researchers to continue this line of research. Also, because in other domains of communication the collaboration between neurocognitive psychology and marketing has been shown to be effective. Neurocognitive methods have been shown to be able to correctly predict effectiveness of commercials (Ariely & Berns, Citation2010) or product designs (Khushaba et al., Citation2013), without the social desirability bias self-report measurements can entail (Ariely & Berns, Citation2010). A similar collaboration has the potential to improve the effectiveness of environmental communication.
Environmental psychologists are vital in investigating which constructs are important in inducing behavioural change (e.g., beliefs, values, emotion, perceived control) (Kollmuss & Agyeman, Citation2002). Neurocognitive psychology can subsequently investigate what type of communication will target those constructs best. Therefore, we hope to inspire other neuroscientists and environmental psychologists to seek collaboration.
¿Cómo procesan la información visual relacionada con el cambio climático las personas con una visión del mundo ambiental arraigada o sin ella? Un estudio con EEG
Los medios de comunicación utilizan con frecuencia representaciones visuales del cambio climático (Sheppard, Citation2012), así como las campañas que pretenden motivar a la población para mitigar y adaptarse a las consecuencias previstas de este cambio (Klöckner, Citation2015). Por ello, la influencia de las imágenes sobre el cambio climático para propiciar cambios de conducta ha sido objeto de diversos estudios (véase Klöckner (Citation2015) para un resumen de ellos). No obstante, dichas investigaciones se basan casi exclusivamente en datos obtenidos a partir de auto-informes, mientras que la investigación neurocognitiva, por otro lado, podría ofrecer una forma de investigación en este campo a nivel neuronal. Este enfoque podría ayudar a los psicólogos/as ambientales a comprender el impacto de distintos constructos psicológicos en las reacciones de los individuos frente a contenido visual de este tipo de campañas. Dado que se trata de una línea de investigación que todavía no está bien definida, decidimos centrarnos en una sección muy particular del análisis: ¿Cómo influye el grado de afiliación a una visión del mundo ambiental en los patrones de oscilación cerebral en las bandas theta y gamma tras la exposición a diversas representaciones visuales del cambio climático? En primer lugar presentamos los conocimientos actuales sobre la relación entre comunicación visual, las diferentes visiones del mundo ambientales y la acción pro-climática, para continuar con una descripción de lo que el enfoque neurocognitivo podría aportar a esta línea de investigación. Por último, presentamos y debatimos la configuración de nuestro estudio y los resultados obtenidos.
Comunicación visual sobre cambio climático, visión del mundo ambiental y acción ambiental
La comunicación ambiental visual tiene el potencial de fomentar la comprensión del cambio climático de la población en general, actuando de puente entre los conceptos abstractos que rodean al cambio climático y nuestras experiencias cotidianas (Nicholson-Cole, Citation2005). Por ello, se trata de una valiosa herramienta para fomentar un cambio conductual en el público en general (Klöckner, Citation2015). No obstante, su efectividad depende del ajuste entre el constructo meta y el lugar en el complejo proceso hacia cambio conductual en el que se encuentra el receptor (para mayor información sobre este tema, véase Klöckner, Citation2015; Bamberg, Citation2013). Por ejemplo, se ha demostrado que la comunicación ambiental que pretende provocar un cambio conductual ampliando el conocimiento de los receptores sobre un comportamiento ambiental específico solo influye a aquellos individuos que poseen valores ambientales arraigados (Bolderdijk, Gorsira, Keizer, & Steg, Citation2013). Este punto concuerda con las teorías neurocognitivas actuales, que defienden que el cerebro humano utiliza los conocimientos almacenados en la arquitectura del cerebro originados por experiencias previas para dirigir la atención o provocar acción basada en la información presentada (Engel, Fries, & Singer, Citation2001). Dicho de otro modo, el cerebro hace uso de procesos top-down para seleccionar aquella información que resulta significativa para el individuo en un momento determinado. Por eso, el modo en que el individuo percibe las imágenes sobre el cambio climático puede variar debido a diferencias en la información almacenada. Si bien las teorías de la psicología cognitiva y ambiental parecen estar en perfecta sincronía, es un campo que todavía no ha sido explorado.
Se ha demostrado que la visión del mundo ambiental influye a la hora de provocar un cambio conductual (Dunlap, Citation2008). Uno de los instrumentos más ampliamente utilizados para medir la visión del mundo ambiental general de la población es el Nuevo Paradigma Ambiental (NPA) (Dunlap, Citation2008; Dunlap & Van Liere, Citation1978; Dunlap, Van Liere, Mertig, & Jones, Citation2000). Esta escala mide el acuerdo de las personas con las premisas de que los recursos son limitados, que las personas forman parte de la naturaleza y que el equilibrio de los sistemas naturales puede verse perturbado por la actividad humana. Esta escala, por tanto, puede considerarse una medida general de la visión del lugar que ocupan los seres humanos en el mundo en relación con la naturaleza (Stern, Citation2000). Para aceptar la visión del mundo ambiental, es necesario que el individuo adquiera conocimientos específicos sobre ciertas afirmaciones y los almacene en su memoria. En este artículo se investiga si los individuos con diferentes niveles de visión del mundo ambiental muestran diferentes patrones de activación cerebral durante el visionado de imágenes relacionadas con el cambio climático.
Resultados anteriores sobre las implicaciones de las diferencias en oscilaciones theta y gamma
Con el término patrones cerebrales nos referimos a los impulsos eléctricos que se detectan en el cuero cabelludo y que oscilan en diferentes bandas de frecuencias cerebrales. Estas oscilaciones surgen de cientos de miles de células nerviosas que producen actividad eléctrica en un proceso que el cerebro utiliza para comunicarse entre diferentes áreas neuronales (Başar, Başar-Eroglu, Karakaş, & Schürmann, Citation2001; Pfurtscheller & Lopes, Citation1999; Teplan, Citation2002). Estos procesos permiten al individuo reconstruir un estímulo visual en patrones espaciotemporales únicos tales como forma, color, orientación espacial, ubicación o movimiento (Ungerleider & Haxby, Citation1994). Simultáneamente se activan patrones de la memoria para permitir el acceso a los conocimientos almacenados, al tiempo que se procesan los estímulos visuales que van llegando (Başar, Başar-Eroğlu, Karakaş, & Schürmann, Citation1999, Citation2001; Buschman & Miller, Citation2007; Engel et al., Citation2001). Todavía no comprendemos del todo cómo interactúan estos procesos bottom-up y top down (Engel et al., Citation2001; Milner & Goodale, Citation1995). No obstante, se cree que la información de ambos procesos se va contrastando y ajustando, y que la información se utiliza como resultado de ese ajuste (Herrmann, Munk, & Engel, Citation2004). Las bandas de frecuencia tradicionalmente asociadas a este procesamiento top-down y al ajuste entre los procesos top-down y bottom-up en particular son las bandas theta (~4–7 Hz) y gamma (~30 a 70 Hz) (Herrmann & Demiralp, Citation2005; Klimesch, Citation1996; Osipova et al., Citation2006). Además, se cree que estos procesos top-down se originan en el córtex frontal y parietal, que son áreas conocidas por su función en el almacenamiento de la memoria semántica, uno de cuyos ejemplos es la visión del mundo ambiental (Binder, Desai, Graves, & Conant, Citation2009).
Por tanto, en este artículo examinaremos el efecto de la visión del mundo ambiental en el procesamiento de imágenes relacionadas con el cambio climático a través de las oscilaciones en la banda gamma y theta de las áreas cerebrales frontal y parietal. Individuos con una visión del mundo ambiental fuerte o débil podrían mostrar distintos patrones oscilatorios debido a las diferencias en sus conocimientos previos almacenados. Un mayor grado de acuerdo con la visión del mundo ambiental podría verse reflejada por un incremento en las oscilaciones gamma y theta en las zonas frontal y parietal, dado el mayor volumen de conocimientos almacenados por dichos individuos (Binder et al., Citation2009).
Método
Participantes
Participaron en el estudio 20 individuos voluntarios sanos, uno de los cuales quedó excluido debido a un error informático. Hubo casi el mismo número de hombres (N = 11) que de mujeres, y casi la mitad de la muestra tenían entre 21 y 25 años (N = 12), mientras que el resto tenían entre 26 y 30 años (N = 4), 36–40 años (N = 1) y 40–45 años (N = 2). El nivel de estudios de los participantes era: educación secundaria (N = 7), bachillerato (N = 8), máster universitario (N = 2) o doctorado (N = 2). En respuesta a la pregunta ‘¿Con qué frecuencia sueles estar expuesto/a a información ambiental?’, los participantes declararon entre 0 y 1 vez por semana (N = 8), entre dos y cinco veces (N = 9) o más de cinco veces por semana (N = 2). A la pregunta ‘¿Cuándo fue la última vez que estuviste expuesto/a a información ambiental?’, los participantes respondieron que en ese mismo día (N = 11), durante la semana anterior (N = 5) o con anterioridad a la semana anterior (N = 3).
Se informó a todos los participantes sobre el alcance y el diseño del estudio y todos facilitaron su consentimiento escrito.
Instrumentos
Visión del mundo ambiental: se midió a través del NPA (Alfa de Cronbach = .64; M = 57.21; DT = 6.71), que consta de 15 ítems valorados sobre una escala tipo Likert de cinco puntos (Dunlap, 2000). La valoración total por individuo se calculó sumando las valoraciones de todos los ítems, después de invertir algunas preguntas para controlar enunciados negativos. Las puntuaciones más altas indicaban mayor grado de acuerdo sobre la limitación de los recursos, el delicado equilibrio de la naturaleza y los seres humanos como parte del sistema natural.
Imágenes sobre cambio climático: se obtuvieron, previa autorización, de una base de datos con imágenes relacionadas con el cambio climático como las publicadas por los medios de comunicación. Las imágenes procedían de la prensa británica, estadounidense y australiana (O’Neill, Citation2013; O’Neill, Boykoff, Niemeyer, & Day, Citation2013; O’Neill & Smith, Citation2014).
Oscilaciones cerebrales: las medimos a través de electroencefalogramas cuantitativos (qEEG), un aparato que captura la actividad neuronal eléctrica con alta resolución temporal (Pfurtscheller & Lopes, Citation1999; Teplan, Citation2002). En particular, utilizamos un gorro de electrodos de estaño de 19 derivaciones (ElectroCap, Estados Unidos), un amplificador Mitsar (Mitsar EEG-201, San.Petersburgo, Rusia) y el programa WinEEG 2.84.44 (Mitsar, San.Petersburgo, Rusia). Los electrodos se colocaron de acuerdo al sistema internacional 10–20 con electrodos de referencia en los lóbulos de las orejas. El electrodo de tierra se colocó en posición anterior a 1.5 cm del electrodo frontal medio (Fz). Se aplicó Electro Gel y NuPrep gel (50:50) (ElectroCap, Estados Unidos) para facilitar el contacto entre los electrodos y el cuero cabelludo, así como la pasta conductora Ten 20 EEG (D-O. Weaver and CO, EEUU) para los electrodos de referencia en los lóbulos de las orejas. La impedancia se mantuvo por debajo de 10 kΩ. La frecuencia de muestreo era de 250 Hz, y el filtro pasabanda oscilaba entre 0 y 70 Hz. El filtro de corte se fijó entre 45 y 55 para reducir las interferencias eléctricas. Los electrodos utilizados en los análisis eran los utilizados para registrar las señales neuronales de las áreas frontales (Fp1, Fp2, F3, Fz, F4) y parietales (P3, Pz, P4).
Reconocimiento del cambio climático (porcentaje de error): en la tarea que se describe más adelante, se indicó a los participantes que pulsaran un botón de respuesta cuando vieran dos imágenes seguidas sobre cambio climático. Estábamos interesados en observar cómo influye la visión del mundo ambiental en el procesamiento de estas imágenes. Sin embargo, un posible factor de confusión es la falta de reconocimiento de las imágenes sobre el cambio climático como tales. Por tanto, también analizamos el porcentaje de respuestas erróneas (M = 30.79; DT = 20.62).
Diseño
Después de contestar la escala NPA, se acomodó a los participantes una silla cómoda, a 1.5 m de distancia frente a una pantalla de ordenador, para visualizar estímulos mostrados en un monitor de 38 cm utilizando el programa Psytask (Mitsar Ltd.), al tiempo que se registraba un EEG.
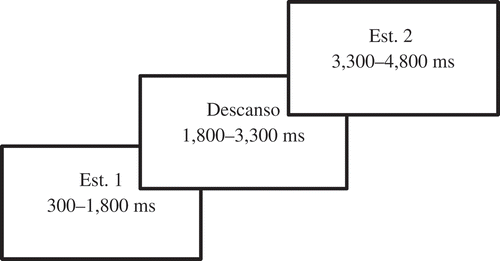
Para completar la tarea, una variante de la tarea visual de rendimiento continuo (visual continuous performance task; Rosvold, Mirsky, Sarason, Bransome, & Beck, Citation1956), fueron necesarios aproximadamente 45 minutos. En el experimento se utilizaron tres categorías: (1) imágenes sobre el cambio climático (‘EC’); (2) imágenes de la categoría 1, alteradas por medio de Photoshop para eliminar el mensaje ambiental (‘no-EC’), e.g., en una imagen con un oso polar en un paisaje natural, se eliminó el oso polar; (3) imágenes de muebles (‘muebles’). Cada ensayo consistía en un par de estímulos: EC – EC, EC – no-EC, no-EC – no-EC o muebles – muebles. No obstante, dado que los dos últimos estaban formados por imágenes no relacionadas con el cambio climático, quedan fuera del alcance de este artículo. Las señales cerebrales emitidas durante el visionado del primer estímulo EC – no-EC son de interés, pero desafortunadamente se perdieron a causa de un error informático y por lo tanto no se incluyen en los análisis de este estudio. Los ensayos se distribuyeron equitativamente y se mostraron en orden aleatorio con un total de 100 ensayos por participante. Se instruyó a los participantes para que presionaran el botón de respuesta solamente cuando se mostraran dos imágenes consecutivas sobre cambio climático. Se escogió esta tarea por su gran validez en su versión original y por sus conocidos efectos en las señales cerebrales (Rosvold et al., Citation1956). No obstante, tras una prueba piloto aplicando los tiempos de presentación originales (100 ms), observamos que la presentación de los estímulos era demasiado breve para que los participantes pudieran comprender las imágenes y fue necesario prolongar el tiempo de exposición. Por tanto, cada imagen se mostró durante 1,500 ms, con un descanso de 1,500 ms (véase ). Uno de los participantes masculinos abandonó la tarea después de 70 ensayos, y tres participantes (dos hombres), lo hicieron tras 50 ensayos debido a la fatiga. No obstante, los datos obtenidos se incluyeron en los análisis.
Figura 1. Visión esquemática de un ejercicio de EEG.
Modelado de los datos de EEG
Se corrigieron los artefactos por parpadeo anulando las curvas de activación de los análisis de componentes individuales (ACI) correspondientes a los parpadeos (Vigário, Citation1997). Además, se inspeccionó el EEG manualmente para verificar la eliminación de artefactos y se establecieron filtros a 4–8 Hz para la banda theta y a 30–50 Hz para la banda gamma. Los datos de presentación de estímulos en los ensayos EC-EC se computaron como oscilaciones relacionadas con eventos, con corrección de datos basales por actividad anterior a la presentación del primer estímulo. A continuación, se calculó la potencia media por electrodo y banda de frecuencia durante la visualización del primer y segundo estímulo, y durante el descanso entre estos.
Estadísticos
Se realizaron análisis estadísticos con el programa SPSS (SPSS inc. Chicago, IL, EEUU) para Windows versión 23. Se recurrió al coeficiente de correlación de Spearman para analizar si el sexo, la edad, el nivel educativo, la frecuencia o la exposición reciente del participante a información ambiental estaban relacionados con la puntuación del NPA o con el porcentaje de ensayos que se respondieron erróneamente. La correlación entre la potencia media theta o gamma y el NPA, así como el porcentaje de error, se calcularon por medio de coeficientes de Pearson.
Resultados
Ni el sexo, ni la edad, el nivel educativo, la frecuencia o la exposición reciente a información ambiental estuvieron relacionados con la valoración del NPA o con el porcentaje de errores. Además, ni el NPA (M = 57.21; DT = 6.71) ni el porcentaje de errores (M = 30.79; DT = 20.62) mostraron correlaciones significativas (r = −.25, p = .31). Sin embargo, la edad mostró una correlación positiva con el nivel educativo (r = .52, p = .02), y este con el sexo (r = .70 p = .00). Además, la última exposición a información ambiental mostró una correlación negativa con la edad (r = −.48, p = .04), con el nivel educativo (r = −.60, p = .01) y con el sexo (r = −.48, p = .04).
En la se muestran los coeficientes de correlación entre el NPA y la potencia de las oscilaciones theta y gamma en diferentes áreas del cerebro. Analizamos la correlación entre el NPA y las oscilaciones cerebrales durante el visionado de los estímulos 1 y 2 y en el descanso entre ambos. El análisis muestra una correlación significativamente negativa entre el NPA y las oscilaciones gamma en la zona prefrontal derecha durante el visionado del estímulo 1 (r = −.51, p = .03), así como en el descanso entre el visionado del estímulo 1 y el 2 (r = −.58, p = .01). Esto significa que en los participantes con puntuaciones más altas en NPA, la potencia de las oscilaciones de banda gamma disminuyó durante y tras el procesamiento del estímulo visual asociado con cambio climático, en comparación con los participantes con puntuaciones más bajas en NPA. Es importante destacar que no se realizó ninguna corrección para evitar la inflación del error del alfa, lo que excluiría los dos resultados significativos. No obstante, basándonos en el importante tamaño de la correlación, decidimos informar sobre ellos como resultados preliminares en un estudio exploratorio. Además, las oscilaciones cerebrales se correlacionaban con el porcentaje de error. Por otro lado, no había correlación entre el porcentaje de error y las oscilaciones theta o gamma.
Tabla 1. Coeficientes de correlación entre el NPA y las oscilaciones en distintas áreas cerebrales (Fp1, Fp2, F3, Fz, F4, P3, Pz, P4), en la banda de frecuencia theta y gamma. Est. 1 hace referencia a la visualización de la primera imagen, Est. 2 hace referencia a la segunda imagen y Descanso hace referencia al periodo intermedio entre las dos visualizaciones.
Discusión
En este estudio analizamos los patrones de procesamiento cerebral de imágenes relacionadas con el cambio climático utilizando qEEG. El objetivo del estudio era comprobar si los diferentes grados de acuerdo con una visión del mundo ambiental influyen en el modo en que el cerebro procesa las imágenes relacionadas con el cambio climático, según se refleja en un procesamiento top-down. Los resultados muestran que un alto grado de acuerdo con una visión del mundo ambiental correlaciona negativamente con las oscilaciones gamma en el córtex prefrontal derecho. En estudios previos, se comprobó que el número de oscilaciones gamma se incrementa cuando nueva información recibida es ajustada con a información ya almacenada (Herrmann & Demiralp, Citation2005). Esta es una situación opuesta al patrón observado en nuestro estudio, en el que un mayor acuerdo con una visión del mundo ambiental se traduce en una disminución de las oscilaciones gamma. Podríamos especular que las oscilaciones no reflejan la cantidad de información que ya está almacenada, sino el modo en que se perciben las cuestiones relacionadas con el cambio climático. Igualmente, las oscilaciones no se correlacionaban con el reconocimiento de imágenes relacionadas con el cambio climático. Además, un estudio lingüístico que investigó la influencia de la visión del mundo del individuo en su procesamiento de la información descubrió un incremento de oscilaciones gamma cuando se producía una violación de dicha visión del mundo (Hagoort, Hald, Bastiaansen, & Petersson, Citation2004). Así pues, los individuos con una visión del mundo ambiental más arraigada podrían haber percibido las imágenes (e.g., molinos eólicos en el mar o un oso polar en el deshielo) como algo más compatible con su visión del mundo ambiental. Estos resultados están en línea con otras investigaciones que demuestran que las oscilaciones gamma no solo están involucradas en el ajuste entre la nueva información recibida y la información preexistente ya almacenada, sino también en el uso de dicha información (Herrmann et al., Citation2004). Por tanto, nuestros datos podrían confirmar que los humanos evaluamos la información que recibimos según nuestras propias perspectivas (Nerlich, Koteyko, & Brown, Citation2010) y que nuestros cerebros perciben si dicha información contraviene nuestra visión del mundo actual.
Los participantes con mayor nivel de visión del mundo ambiental no mostraron mayor exactitud en el reconocimiento de imágenes relacionadas con el cambio climático que los individuos con menor nivel de dicha visión del mundo. Si bien, en primera instancia, se trata de un hallazgo notable, debemos tener en cuenta que se utilizaron imágenes que eran habituales en los medios de comunicación (O’Neill, Citation2013; O’Neill et al., Citation2013; O’Neill & Smith, Citation2014), y, por tanto, es posible que los participantes hubieran visto ya estas u otras imágenes muy similares.
Muchas bandas de oscilación no mostraron ninguna correlación con la visión del mundo ambiental. Una parte de estos datos sí parecía indicar un patrón similar en las oscilaciones gamma, pero no alcanzaron significación estadística. Se podría especular sobre el significado de estos resultados; por ejemplo, podrían indicar que los procesos top-down relacionados con el procesamiento de la información sobre cambio climático solo tienen lugar en las oscilaciones gamma de las áreas frontales. Sin embargo, esta línea de investigación es demasiado preliminar para especular sobre ella, ya que los resultados no significativos podrían deberse también a ciertas limitaciones del estudio. Por ejemplo, si bien el número de participantes no es infrecuente en investigaciones basadas en EEG (Fernández et al., Citation2007; Kelly, Gomez‐Ramirez, & Foxe, Citation2009; Siniatchkin et al., Citation2000; Tan et al., Citation2009), es un número relativamente bajo, lo que dificulta lograr resultados estadísticamente significativos, incluso para coeficientes de correlación relativamente altos. En segundo lugar, las puntuaciones del NPA mostraban una distribución normal, pero estaban todas en el segmento más alto. Este aspecto parece ser característico de las muestras universitarias (Schultz & Zelezny, Citation1999). No obstante, para poder comprender mejor la influencia de la visión del mundo ambiental en el procesamiento de la información, en futuras investigaciones podría resultar útil seleccionar participantes con una gama más amplia de valoraciones en el NPA. En tercer lugar, decidimos prolongar el tiempo de presentación basándonos en nuestro estudio piloto, para asegurarnos de que los participantes disponían de tiempo suficiente para procesar y comprender conscientemente las imágenes mostradas. Sin embargo, esta mayor duración podría haber disminuido su concentración hacia el final del periodo. Esta prolongación, además, dificulta la identificación de los procesos cerebrales capturados en esta presentación prolongada, dado que la potencia de las oscilaciones puede verse alterada no solo por acontecimientos externos como el visionado de imágenes relacionadas con el cambio climático, sino también por sucesos internos como la reflexión. Por tanto, la ampliación del tiempo de presentación podría haber incrementado la posibilidad de capturar funcionamientos cognitivos ajenos al procesamiento de la información ambiental visual.
En este estudio decidimos investigar el efecto de una visión del mundo ambiental dado que, según la teoría Valor-Creencia-Norma (Stern, Citation2000), el punto en que suele detenerse la activación de la norma está entre la visión del mundo ambiental y los detonantes de la norma personal. No obstante, esto también puede ocurrir en un momento anterior de la cadena, por ejemplo, en los valores, ya que se ha demostrado que constituyen el constructo más predictivo de la conducta ambiental (Steg, De Groot, Dreijerink, Abrahamse, & Siero, Citation2011). Por tanto, quisiéramos animar a otros investigadores a seguir con esta línea de investigación. Entre otras cosas, porque en otros campos de la comunicación, la colaboración entre la psicología neurocognitiva y el marketing ha demostrado ser eficaz. Los métodos neurocognitivos han demostrado ser capaces de predecir correctamente la eficacia de los anuncios publicitarios (Ariely & Berns, Citation2010) o del diseño de productos (Khushaba et al., Citation2013), sin el sesgo de deseabilidad social en los que pueden incurrir los auto-informes (Ariely & Berns, Citation2010). Una colaboración similar podría mejorar también la eficacia de la comunicación ambiental.
Los psicólogos ambientales desempeñan una función crucial en la investigación sobre cuáles son los constructos más importantes a la hora de inducir un cambio de conducta (e.g., creencias, valores, emociones, control percibido) (Kollmuss & Agyeman, Citation2002). Consecuentemente, la psicología neurocognitiva puede investigar el tipo de comunicación que mejor se adaptaría a dichos constructos. Por lo tanto, esperamos inspirar a otros especialistas en neurociencia y psicología ambiental a buscar esta colaboración.Footnote1
Disclosure statement
No potential conflict of interest was reported by the authors. / Los autores no han referido ningún potencial conflicto de interés en relación con este artículo.
Notes
1. At the time of the study this researcher was not employed at Wageningen UR, but a student of the University of Amsterdam.
1. En el momento del estudio, esta investigadora no era una empleada de Wageningen UR, sino una estudiante de la Universidad de Amsterdam.
References / Referencias
- Ariely, D., & Berns, G. S. (2010). Neuromarketing: The hope and hype of neuroimaging in business. Nature Reviews. Neuroscience, 11, 284–292. doi:10.1038/nrn2795
- Bamberg, S. (2013). Changing environmentally harmful behaviors: A stage model of self-regulated behavioral change. Journal of Environmental Psychology, 34, 151–159. doi:10.1016/j.jenvp.2013.01.002
- Başar, E., Başar-Eroglu, C., Karakaş, S., & Schürmann, M. (2001). Gamma, alpha, delta, and theta oscillations govern cognitive processes. International Journal of Psychophysiology, 39, 241–248. doi:10.1016/S0167-8760(00)00145-8
- Başar, E., Başar-Eroğlu, C., Karakaş, S., & Schürmann, M. (1999). Are cognitive processes manifested in event-related gamma, alpha, theta and delta oscillations in the EEG? Neuroscience Letters, 259, 165–168. doi:10.1016/S0304-3940(98)00934-3
- Binder, J. R., Desai, R. H., Graves, W. W., & Conant, L. L. (2009). Where is the semantic system? A critical review and meta-analysis of 120 functional neuroimaging studies. Cerebral Cortex, 19, 2767–2796. doi:10.1093/cercor/bhp055
- Bolderdijk, J. W., Gorsira, M., Keizer, K., & Steg, L. (2013). Values determine the (in) effectiveness of informational interventions in promoting pro-environmental behavior. PloS ONE, 8(12), e83911. doi:10.1371/journal.pone.0083911
- Buschman, T. J., & Miller, E. K. (2007). Top-down versus bottom-up control of attention in the prefrontal and posterior parietal cortices. Science, 315, 1860–1862. doi:10.1126/science.1138071
- Dunlap, R. E. (2008). The new environmental paradigm scale: From marginality to worldwide use. The Journal of Environmental Education, 40, 3–18. doi:10.3200/JOEE.40.1.3-18
- Dunlap, R. E., & Van Liere, K. D. (1978). The “new environmental paradigm”. The Journal of Environmental Education, 9, 10–19. doi:10.1080/00958964.1978.10801875
- Dunlap, R. E., Van Liere, K. D., Mertig, A. G., & Jones, R. E. (2000). New trends in measuring environmental attitudes: Measuring endorsement of the new ecological paradigm: A revised NEP scale. Journal of Social Issues, 56, 425–442. doi:10.1111/0022-4537.00176
- Engel, A. K., Fries, P., & Singer, W. (2001). Dynamic predictions oscillations and synchrony in top-down processing. Nature Reviews Neuroscience, 2, 704–716. 10.1038/35094565
- Fernández, T., Harmony, T., Fernández-Bouzas, A., Díaz-Comas, L., Prado-Alcalá, R. A., Valdés-Sosa, P., … Aubert, E. (2007). Changes in EEG current sources induced by neurofeedback in learning disabled children. An exploratory study. Applied Psychophysiology and Biofeedback, 32, 169–183. doi:10.1007/s10484-007-9044-8
- Hagoort, P., Hald, L., Bastiaansen, M., & Petersson, K. M. (2004). Integration of word meaning and world knowledge in language comprehension. Science, 304, 438–441. doi:10.1126/science.1095455
- Herrmann, C. S., & Demiralp, T. (2005). Human EEG gamma oscillations in neuropsychiatric disorders. Clinical Neurophysiology, 116, 2719–2733. doi:10.1016/j.clinph.2005.07.007
- Herrmann, C. S., Munk, M. H., & Engel, A. K. (2004). Cognitive functions of gamma-band activity: Memory match and utilization. Trends in Cognitive Sciences, 8, 347–355. doi:10.1016/j.tics.2004.06.006
- Kelly, S. P., Gomez‐Ramirez, M., & Foxe, J. J. (2009). The strength of anticipatory spatial biasing predicts target discrimination at attended locations: A high‐density EEG study. European Journal of Neuroscience, 30, 2224–2234. doi:10.1111/ejn.2009.30.issue-11
- Khushaba, R. N., Wise, C., Kodagoda, S., Louviere, J., Kahn, B. E., & Townsend, C. (2013). Consumer neuroscience: Assessing the brain response to marketing stimuli using electroencephalogram (EEG) and eye tracking. Expert Systems with Applications, 40, 3803–3812. doi:10.1016/j.eswa.2012.12.095
- Klimesch, W. (1996). Memory processes, brain oscillations and EEG synchronization. International Journal of Psychophysiology, 24, 61–100. doi:10.1016/S0167-8760(96)00057-8
- Klöckner, C. A. (2015). The psychology of pro-environmental communication – going beyond standard information strategies. London: Palgrave Macmillan. http://www.palgrave.com/us/book/9781137348319
- Kollmuss, A., & Agyeman, J. (2002). Mind the Gap: Why do people act environmentally and what are the barriers to pro-environmental behavior? Environmental Education Research, 8, 239–260. doi:10.1080/13504620220145401
- Milner, A. D., & Goodale, M. A. (1995). The visual brain in action (Vol. 27) (Oxford Psychology Series). Oxford: Oxford University Press. Retrieved from http://www.theassc.org/files/assc/2367.pdf
- Nerlich, B., Koteyko, N., & Brown, B. (2010). Theory and language of climate change communication. Wiley Interdisciplinary Reviews: Climate Change, 1, 97–110. doi:10.1002/wcc.2
- Nicholson-Cole, S. A. (2005). Representing climate change futures: A critique on the use of images for visual communication. Computers, Environment and Urban Systems, 29, 255–273. doi:10.1016/j.compenvurbsys.2004.05.002
- O’Neill, S. J. (2013). Image matters: Climate change imagery in US, UK and Australian newspapers. Geoforum, 49, 10–19. doi:10.1016/j.geoforum.2013.04.030
- O’Neill, S. J., Boykoff, M., Niemeyer, S., & Day, S. A. (2013). On the use of imagery for climate change engagement. Global Environmental Change, 23, 413–421. doi:10.1016/j.gloenvcha.2012.11.006
- O’Neill, S. J., & Smith, N. (2014). Climate change and visual imagery. Wiley Interdisciplinary Reviews: Climate Change, 5, 73–87. doi:10.1002/wcc.249
- Osipova, D., Takashima, A., Oostenveld, R., Fernández, G., Maris, E., & Jensen, O. (2006). Theta and gamma oscillations predict encoding and retrieval of declarative memory. The Journal of Neuroscience, 26, 7523–7531. doi:10.1523/JNEUROSCI.1948-06.2006
- Pfurtscheller, G., & Lopes, F. H. (1999). Event-related EEG /MEG synchronization and desynchronization: Basic principles. Clinical Neurophysiology, 110, 1842–1857. doi:10.1016/S1388-2457(99)00141-8
- Rosvold, H. E., Mirsky, A. F., Sarason, I., Bransome, E. D., Jr., & Beck, L. H. (1956). A continuous performance test of brain damage. Journal of Consulting Psychology, 20, 343–350. doi:10.1037/h0043220
- Schultz, P. W., & Zelezny, L. (1999). Values as predictors of environmental attitudes: Evidence for consistency across 14 countries. Journal of Environmental Psychology, 19, 255–265.
- Sheppard, S. R. J. (2012). Visualizing climate change. London: Routledge. Retrieved from http://www.publish.csiro.au/nid/17/pid/7000.htm
- Siniatchkin, M., Hierundar, A., Kropp, P., Kuhnert, R., Gerber, W.-D., & Stephani, U. (2000). Self-regulation of slow cortical potentials in children with migraine: An exploratory study. Applied Psychophysiology and Biofeedback, 25, 13–32. doi:10.1023/A:1009581321624
- Steg, L., De Groot, J. I., Dreijerink, L., Abrahamse, W., & Siero, F. (2011). General antecedents of personal norms, policy acceptability, and intentions: The role of values, worldviews, and environmental concern. Society and Natural Resources, 24, 349–367. doi:10.1080/08941920903214116
- Stern, P. C. (2000). New environmental theories: Toward a coherent theory of environmentally significant behavior. Journal of Social Issues, 56, 407–424. doi:10.1111/0022-4537.00175
- Tan, G., Thornby, J., Hammond, D. C., Strehl, U., Canady, B., Arnemann, K., & Kaiser, D. A. (2009). Meta-analysis of EEG biofeedback in treating epilepsy. Clinical EEG and Neuroscience, 40, 173–179. doi:10.1177/155005940904000310
- Teplan, M. (2002). Fundamentals of EEG measurement. Measurement Science Review, 2, 1–11. doi:10.1021/pr070350l
- Ungerleider, L. G., & Haxby, J. V. (1994). ‘What’and ‘where’in the human brain. Current Opinion in Neurobiology, 4, 157–165. doi:10.1016/0959-4388(94)90066-3
- Vigário, R. N. (1997). Extraction of ocular artefacts from EEG using independent component analysis. Electroencephalography and Clinical Neurophysiology, 103, 395–404. doi:10.1016/S0013-4694(97)00042-8