
 ?Mathematical formulae have been encoded as MathML and are displayed in this HTML version using MathJax in order to improve their display. Uncheck the box to turn MathJax off. This feature requires Javascript. Click on a formula to zoom.
ABSTRACT
Nanostructured zinc oxide (ZnO) thin films were deposited on glass substrates using various molar concentrations of zinc acetate dihydrate as the starting precursor at 400°C by the spray pyrolysis technique. The structural, morphological, and optical properties of the samples were investigated. X-ray diffraction studies showed thin films with a polycrystalline nature of the hexagonal wurtzite phase type. The preferred orientation was observed along the (002) direction. The crystallite size increased from 16.18nm to 20.42nm with increases in the molar concentration from 0.1M to 0.3M and then decreased further to 17.85nm at a molar concentration of 0.4M. SEM micrographs showed significant changes in the zinc oxide thin films with increases in the molar concentration of the precursor. Room-temperature Raman spectra confirmed typical electron-phonon coupling in the ZnO thin films. The optical band gap of the zinc oxide thin films was calculated using the Tauc plot. The sensitivity and selectivity of such toxic volatile organic vapors as benzene, toluene, ethylbenzene, and xylene (BTEX) were studied at room-temperature and reported.
1. Introduction
Zinc oxide (ZnO) thin films have attracted considerable attention in recent years due to their potential applications in the fields of catalysis, biology, and electronic and optoelectronic devices, such as transparent electrodes, thin film transistors [Citation1], gas sensors [Citation2], pressure sensors [Citation3], microbicides [Citation4], photocatalysis [Citation5], blue and ultraviolet (UV) light emitters, room-temperature ultraviolet lasers [Citation6], photovoltaic devices [Citation7], and solar cell windows [Citation8]. They are also among the most important transparent conductive oxide (TCO) materials [Citation9]. ZnO thin films have been deposited by such different methods as sputtering techniques [Citation10–Citation12], metal oxide chemical vapor deposition (MOCVD) [Citation13], molecular beam epitaxy (MBE) [Citation14], pulsed laser deposition [Citation15], sol-gel processing [Citation16,Citation17], and spray pyrolysis [Citation18]. Among these methods, the spray pyrolysis method has attracted the especially great attention among researchers due to its simpler mechanism, low setup costs, and ability to spray large areas [Citation19]. Volatile organic carbon compounds (VOCs) create significant impacts on the environment. The presence of these gases in the atmosphere poses a serious threat to human beings and may lead to extreme health issues, and sometimes to death. Their existence presence also contributes to stratospheric ozone depletion and the greenhouse effect.
Monoaromatics hydrocarbons such as benzene, toluene, ethylbenzene, and xylene (BTEX) are a group of hazardous pollutants which originate from sources such as gas and oil extraction fields and refineries and the paint, glue and petrochemicals industries. Among them, benzene-based compounds have been commonly using in the paint industry during the recent past. Hence, gaseous pollutants have been released into the atmosphere. Toluene is used in the rubber industry, printing inks, leather tanners, adhesives, and disinfectants. It is also used as an octane booster reagent in gasoline fuels for internal combustion engines and as solvents, paint thinners, and many chemical reactants. Ethylbenzene is widely used in the petrochemical industry as an intermediate compound for the production of styrene. It is used as a fuel and solvent and in the preparation of other chemicals. Xylene is a sweet-smelling, colorless aromatic hydrocarbon available in vapor or liquid form. It is extensively used in the rubber and petrochemical industries and refineries. Inhalation of these BTEX gases may lead to dizziness, nausea, vomiting, headache, carcinogenic and mutagenic problem, and effects on other severe health issues [Citation20]. A mechanism for recognizing these gases as quickly and accurately as possible, notably in very low concentrations (ppm levels), is, therefore, essential. The various available methods for recognizing BTEX gases have many drawbacks, such as slow response, high equipment costs, and complications in analysis as well as energy consumption. Recently, many researchers have been working on gas sensors to overcome the above shortcomings. The sensors facilitate detection of these gases and feature very high sensitivity and selectivity with low cost and high portability. The present study examines the deposition of ZnO thin films by a spray pyrolysis technique at various precursor concentrations with optimized deposition parameters. Showing the influence of the precursor concentrations on their microstructures is systematically reported, and the films are also exposed to different concentrations (in ppm) of benzene, toluene, ethylbenzene, and xylene to measure their sensitivity and selectivity as sensors.
2. Experimental techniques
ZnO thin films were deposited on glass substrates (Bluestar, India) with zinc acetate dehydrate (Sigma Aldrich) as a starting precursor at an optimised substrate temperature of 400°C, and with other deposition parameters as tabulated in . The structural properties of ZnO thin films were characterized using an X-ray diffractometer (STOE, Germany) with Cu Kα radiation (0.154nm) in the mode of grazing incidence. The X-ray diffraction patterns of the films were measured in the range of 20–80° in a step size of 0.1°. Morphological analyses of ZnO films were studied with the help of a scanning electron microscope (SEM) (Zeiss Evo18 special edition). Raman spectra were recorded using an Argon laser as an excitation source emitting at 488 nm coupled to a Labram–HR800 micro Raman spectrometer. The optical properties of ZnO thin films were studied using a double beam spectrophotometer (Shimadzu UV-3100) at a scan rate of 50nm/min in the wavelength range of 200–800nm. A characterization of gas sensing by ZnO films was conducted in the presence of BTEX vapors using a static mode gas-sensing system.
Table 1. Deposition parameters.
3. Results and discussion
3.1. Structural characterization
3.1.1. X-ray diffraction
The structural characterization is very important to the investigation of the crystal structure and orientation of ZnO thin films and to explaining the optical and gas-sensing properties of these thin films. depicts the XRD patterns of samples deposited at a substrate temperature of 400°C in different precursor concentrations, namely 0.1M, 0.2M, 0.3M, and 0.4M. The peaks are identified to the (1 0 0), (0 0 2), (1 0 1), (1 0 2), (1 1 0), (1 0 3), and (1 1 2) planes of reflection. These reflections are indexed by analyzing our experimental data with cards from the Joint Committee of Powder Diffraction Standards (JCPDF). The observed data for all the zinc oxide thin films sprayed at various precursor concentrations are in good agreement with data in a ZnO powder showing standard values obtained from JCPDS data card number 89–0510, which corresponds to a single-phase hexagonal wurtzite-type structure. Indeed, reflections common to the polycrystalline phase randomly orientated with a preferred orientation along the (002) direction in ZnO thin films appear in the XRD spectra. The average grain size of the polycrystalline material can be calculated from the Scherrer formula [Citation21]:
Figure 1. XRD pattern of ZnO thin films at various precursor concentrations.
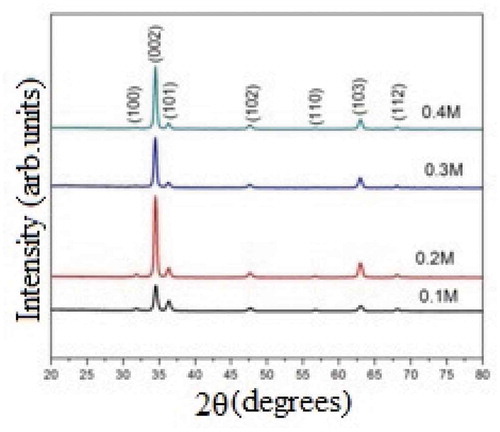
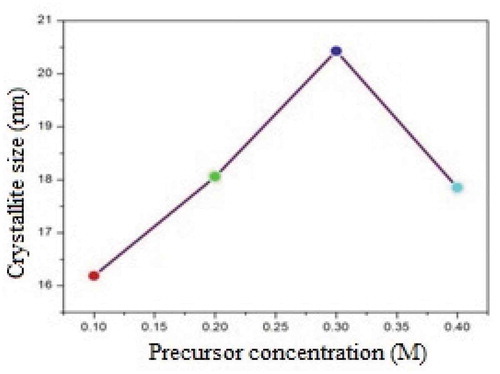
where β is the observed angular width at half maximum intensity (FWHM) of the corresponding peak, λ is the wavelength associated with X-rays (15.4nm), and θ is the Bragg’s angle. It is observed that the crystallite size values for ZnO thin films increase with increases in the precursor molar concentration from 0.1M to 0.3M and then increase further as the precursor concentration, crystallite decreases. The increase in crystallite size is due to the coalescence/agglomeration and nucleation of islands during the deposition process of thin film growth, and a decrease in the preferred orientation with reduced crystallite size is also observed with increases in the precursor concentration. Losurdo et al. reported that the phenomenon of agglomeration of crystallites causes a change in the crystallite size [Citation22]. The variations in the crystallite size with the precursor concentration are shown in .
Figure 2. Variations in grain size with precursor concentration.
3.1.2. Scanning electron microscopy
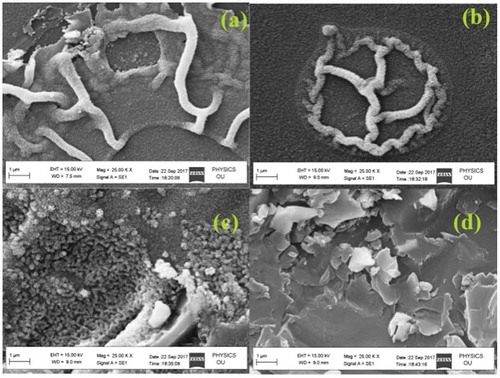
The surface morphology of ZnO thin films deposited at different precursor concentrations was examined by SEM. Thin films deposited at 0.1M and 0.2M have a similar wrinkled slab network structure morphology [Citation23], whereas film deposited at 0.3M showed homogeneity and agglomerated nanospheres a large surface area. The surface morphology of the thin films was transformed from agglomerated nanospheres to nanoflakes as the concentration increased further. SEM micrographs of ZnO thin films deposited in various precursor concentrations are depicted in .
Figure 3. SEM micrographs of ZnO thin films deposited at (a) 0.1M, (b) 0.2M, (c) 0.3M, and (d) 0.4M.
3.1.3. Raman spectroscopy
ZnO is among the wide band gap semiconductors with wurtzite-type structures belonging to the C6v4(P63mc) space group and possessing 12 phonon branches, nine optical modes, and three acoustic modes. The primitive cell incorporates two formula units with two atoms each and with all the atoms occupying 2b sites of symmetry C3v. In a perfect ZnO crystal, only the optical phonons at the Γ point of the Brillouin zone are associated in the first-order Raman scattering. The group theory estimates the presence of the following optical modes:
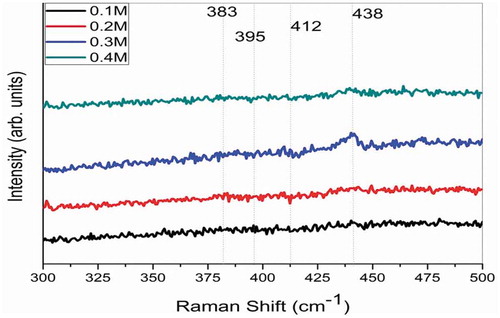
where the A1, E1, and E2 modes are first-order Raman active, while the B1 modes are Raman inactive [Citation24]. shows Raman spectra of ZnO thin films deposited in different precursor concentrations. All the samples exhibit a peak with a strong intensity corresponding to E2 (H) (438cm−1). The E2 (H) mode involves mainly Zn motion, which corresponds to the band characteristics of the Wurtzite phase. The high intensity of the E2 mode corresponds to the 0.3 M concentration, indicating formation of high-crystalline ZnO films.
Figure 4. Raman spectra of zinc oxide thin films deposited in different precursor concentrations.
3.2. Optical properties
By plotting the absorption coefficient (α) times the energy of a photon squared (αhν)2 versus the energy of a photon to create a Tauc plot, we can calculate the optical band gap. depicts Tauc plots of ZnO thin films sprayed in various precursor molar concentrations. The linearity of the plots themselves confirms the direct optical transition of ZnO . Extrapolation of the linear segment of the curve toward the photon energy axis reveals the optical band gap. The optical transmission spectra determine the optical band gaps for ZnO thin films sprayed in various precursor concentrations with the following equation:
Figure 5. Tauc plot of ZnO thin films as a function of precursor concentration.
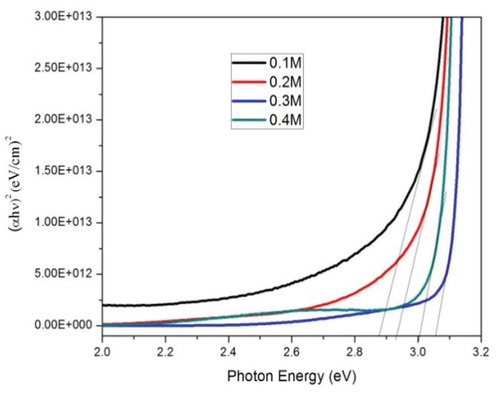
where hv is the energy of the incident photon, Eg is the optical band gap, and B and y are constants. The value of y depends upon the nature of the optical transition. The variations in the optical direct band gap as a function of the precursor concentration of thin films deposited at a substrate temperature of 400°C are tabulated in . In this study, we observed that, as the precursor concentration was increased from 0.1M to 0.3M, the optical band gap increased due to the Burstein–Moss effect or quantum confinement effect, and that when the precursor concentration was increased to a critical value (0.4M), the potential at the grain boundaries broke down, leading to a decrease in the optical band gap. This was attributed to the anomalous behavior of the optical band gap of ZnOfilms [Citation25].
Table 2. Variations in the optical band gap with the precursor concentration.
3.3. Gas sensing properties
The sensors’ response to BTEX gases such as benzene, toluene, ethylbenzene, and xylene with 100 ppm as a function of precursor concentration is plotted in . The response of the sensors to these gases was measured at an operating temperature of 27°C by the two-probe static method. The response of the thin films is calculated using the following formula:
Figure 6. Response of BTEX gases toward ZnO thin films deposited in different precursor concentrations.
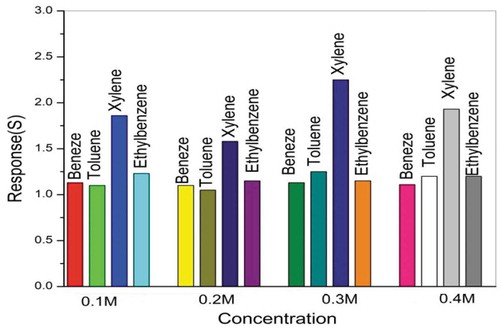
where Rg and Ra are the electrical resistance of the sensor material in the presence of the test gas and dry air.
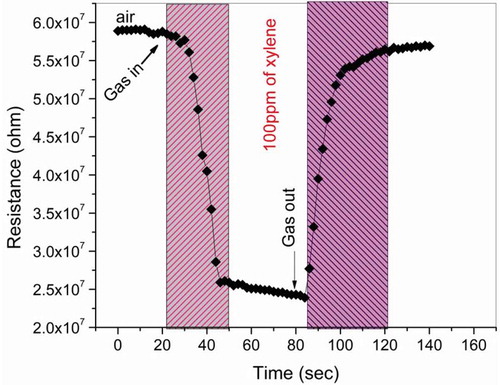
It is well known that the gas response of ZnO-based sensors is of the surface-controlled type, which is a resistance variation regulated by the species and the chemisorbed oxygen on the surface. Hence, it is obvious that the larger the surface area of the sensor material, the stronger interaction between the sensor material surface and the adsorbed gases, i.e. the gas response is higher [Citation26]. In this investigation, it is clear from the scanning electron microscopy images that the samples deposited in a 0.3M precursor concentration show homogeneity and agglomerated nanospheres with the large surface area, which exhibits improved responsiveness in detecting BTEX gases. Among all the target gases, xylene shows the best response toward ZnO thin films due to its small bond dissociation energy as compared with other gases [Citation27]. depicts the response and recovery characteristics of ZnO thin film that is deposited in a 0.3M precursor concentration toward xylene vapors of 100 ppm at room temperature. The times of the response and recovery are 20 s and 29 s, respectively.
Figure 7. Transient response of zinc oxide thin films exposed to 100 ppm of xylene.
4. Conclusions
Polycrystalline ZnO thin films with different solution molarities were prepared using a spray pyrolysis technique at an optimized substrate temperature of 400°C on glass substrates. XRD analysis shows that sprayed ZnO thin films have a polycrystalline texture and hexagonal wurtzite structure with a preferred orientation along the (002) direction. XRD results confirm the crystallinity of the films and the nature of the phases. A significant effect of the precursor concentration on the morphology of the thin films is observed from in SEM micrographs. The optical band gaps of the ZnO thin films are determined by a Tauc plot and show values in the range of 2.87 to 3.06 eV. Gas-sensing investigations reveal that ZnO thin films that are sprayed in a 0.3 M precursor concentration show the best responsiveness to BTEX gases. Among all these gases, xylene shows the maximum responsiveness to the sensor element.
Acknowledgments
The authors are greatful to the Chairman and Director, CMR Technical Campus, Hyderabad, for their support during the present work. We would also like to thank Dr GLN Reddy, NCCCM, Hyderabad, for providing X-ray diffraction studies. P. Nagaraju wishes to acknowledge the Department of Science and Technology, Science and Engineering Regulatory Board, Government of India, New Delhi, for providing financial assistance under the early career research scheme (file number ECR/2016/000534) for completion of the present work. The authors would also like to thank Dr Vasant Sathe, UGC-DAE-Indore, for providing Raman characterization facilities.
Disclosure statement
No potential conflict of interest was reported by the authors.
Additional information
Funding
References
- Fortunato E, Gonçalves A, Pimentel A, et al. Zinc oxide, a multifunctional material: from material to device applications. Appl Phys A. 2009;96:197–205.
- Devi S, Subrahmanyam VB, Gadkari SC, et al. NH3 gas sensing properties of nanocrystalline ZnO based thick films. Anal Chim Acta. 2006;568:41.
- Shaohong W, Youjuan Z, Jing C. Research progress of 1D ZnO-based gas-sensing materials. Electron Compon Mater. 2013;32: 8–12. Bookmark and Share Email this article Print this article.
- Devipriya S, Yesodharan S. Photocatalytic degradation of pesticide contaminants in water. Sol Energy Mater Sol C. 2005;86:309–348.
- Gupta SM, Tripathi M. An overview of commonly used semiconductor nanoparticles in photocatalysis. High Energy Chem. 2012;46:1–9.
- Bangall DM, Chen YF, Zhu Z, et al. Optically pumped lasing of ZnO at room temperature. Appl Phys Lett. 1997;70:2230.
- Pauporte T, Lincot D. Electrodeposition of semiconductors for optoelectronic devices: results on zinc oxide. Electrochim Acta. 2000;45:3345.
- Jeongs WJ, Kim SK, Park GC. Preparation and characteristic of ZnO thin film with high and low resistivity for an application of solar cell. Thin Solid Films. 2006;506–507:180.
- Golshahi S, Rozati SM, Martins R, et al. P-type ZnO thin film deposited by spray pyrolysis technique: the effect of solution concentration. Thin Solid Films. 2009;518:1149–1152.
- Wang Y, Wang HL, Liu CQ, et al. Effect of NaOH solution on surface textured ZnO: Al films prepared by pulsed direct current magnetron sputtering. Mater Sci Semicond Proc. 2012;15:555–558.
- Zhang XL, Hui KN, Hui KS, et al. Structural and optical characterization of high-quality ZnO thin films deposited by reactive RF magnetron sputtering. Mater Res Bull. 2013;48:1092–1098.
- JongWoo Lee KN, Hui KS, Hui YR, et al. Low resistivity of Ni–Al co-doped ZnO thin films deposited by DC magnetron sputtering at low sputtering power. Appl Surf Sci. 2014;293:55–61.
- Ghandhi SK, Field RJ, Shealy JR. Highly oriented zinc oxide films grown by the oxidation of diethylzinc. Appl Phys Lett. 1980;37:449.
- Yang F, Liang Y, Liu L-X, et al. Controlled growth of complex polar oxide films with atomically precise molecular beam epitaxy. Front Phys. 2018;13:136802.
- Snure M, Tiwari A. Structural, electrical, and optical characterizations of epitaxial Zn1−xGaxO films grown on sapphire (0001) substrate. J Appl Phys. 2007;101:124912.
- Li YM, Xu L, Li XY, et al. Effect of aging time of ZnO sol on the structural and optical properties of ZnO thin films prepared by sol-gel method. Appl Surf Sci. 2010;256:4543–4547.
- Lei L, Hui KS, Hui KN, et al. Synthesis and characterization of NiO-doped p-type AZO films fabricated by sol–gel method. Mater Lett. 2012;68:283–286.
- LazharHadjeris L, BadreddineAssouar M, Easwarakhanthan T, et al. Transparent and conducting ZnO films grown by spray pyrolysis. Semicond Sci Technol. 2009;24:035006–035012.
- Bouzidi A, Benramdane N, Nakrela A, et al. First synthesis of vanadium oxide thin films by spray pyrolysis techniqueMater. Sci Eng. 2002;B95:141.
- Wang L, ShurongWang M, Xiaojing H, et al. A Au-functionalized ZnO nanowire gas sensor for detection of benzene and toluene. Phys Chem Chem Phys. 2013;15:17179–17186.
- Nagaraju P, Vijayakumar Y, Choudhary RJ, et al. Preparation and characterization of nanostructured Gd doped cerium oxide thin films by pulsed laser deposition for acetone sensor application. Mater Sci Eng, B. 2017;226:99–106.
- Losurdo M, Barreca D, Capezzuto P, et al. Interrelation between nanostructure and optical properties of oxide thin films by spectroscopic ellipsometry. Surf CoatTechnol. 2002;151–152:2–8.
- Khan ZR 1, Khan M 2, Zulfequar M 1, et al. Optical and structural properties of zno thin films fabricated by sol-gel method. Mater Sci Appl. 2011;2:340–345.
- Yamlahi Alami Z 1, Salem M, Gaidi M, et al. effect of Zn concentration on structural and optical properties of ZnO thin films deposited by spray pyrolysis. Adv Energy. 2015 Oct;2(4):11-24.
- Nagaraju P, Vijayakumar Y, Ramana Reddy MV. Effect of oxygen partial pressure on the microstructural, optical and gas sensing characterization of nanostructured Gd doped ceria thin films deposited by pulsed laser deposition. J Asian Ceram Soc. 2017;5:402–409.
- Shinde VR, Gujar TP, Lokhande CD. LPG sensing properties of ZnO films prepared by spray pyrolysis method: effect of molarity of precursor solution. Sens Actuators B. 2007;120:551–559.
- Dean JA. Handbook of chemistry. 15th ed. New York (NY): McGraw Hill Inc.; 1999.