
 ?Mathematical formulae have been encoded as MathML and are displayed in this HTML version using MathJax in order to improve their display. Uncheck the box to turn MathJax off. This feature requires Javascript. Click on a formula to zoom.
ABSTRACT
Four types of low-cost, high-performance ceramic microfiltration membranes have been fabricated and characterized using different analytic approaches for oily wastewater treatment. Mullite, mullite-alumina (MA) with 10–50 wt% alumina, mullite-alumina-zeolite (MAZ) with 10–40 wt% zeolite/alumina and mullite-zeolite (MZ) with 10–50 wt% zeolite content have been made using local clays. Factors such as their pure water permeation flux, oil rejection performance and permeation flux (PF) have been compared. Experimental results showed that MA 50% membranes have the highest steady-state PF of 549 Lm−2h−1 among all the membranes at operating conditions with a cross-flow of velocity (CFV) = 1.5 m s−1, transmembrane pressure (TMP) = 3 bar and temperature (T) = 35 ○C. The lowest and highest oil rejection results for the membranes were 95.89% and 98.77% for MZ 10% and MZ 50% membranes, respectively. Also, Hermia’s models accurately predict experimental data showing a PF decline over time during treatment.
1. Introduction
Oily wastewater is discharged by petrochemical and refinery plants, transportation vehicles, machinery and various other types of industrial plants, fueled by the global increase in the world population and rising demand for fossil fuels such as gasoline. Releasing this type of wastewater into the environment without treatment can contaminate soil and water and cause serious environmental problems for humans, plants and animal species [Citation1,Citation2]. Many methods of oily wastewater treatment have been developed by researchers in response, including flotation, coagulation, adsorption, sedimentation and membrane processes [Citation3–Citation5]. Among these methods, the membrane separation process is one of the most promising, since it can be used widely for oily wastewater treatment due to such advantages as its high separation efficiency, low energy consumption, extremely compact design and small space requirements [Citation6]. In recent years, research in the field of ceramic membrane preparation is rising sharply due to their mechanical, chemical and thermal stability of these membranes, as well as their wide range of pHs, easy washing and superior separation performance [Citation7–Citation9]. Despite these advantages, the use of ceramic membranes for wastewater treatment is limited by the cost of the membranes, which is often 5 to 10 times higher than that of organic membranes. Development of new types of ceramic membranes including zeolites has been therefore pursued by researchers [Citation10]. As a new idea in this area, employing natural zeolite powder in the ceramic membrane structure can increase PF and oil rejection performance [Citation11–Citation13]. Several studies published for the treatment of wastewater by ceramic microfiltration membranes such as alumina [Citation14–Citation16], but a search of the available uncovered a few reports on ceramic-zeolite membranes. Cui et al. [Citation13] investigated the treatment of oil-contaminated water using alumina/NaA zeolite membranes with pore sizes of 1.2 μm, 0.4 μm and 0.2 μm. The results showed that 99% of oil rejection was obtained. Abdi et al. [Citation17] used ceramic α-alumina MF membrane for treatment of oily wastewater from the API unit of a Tehran refinery. The results showed that these membranes can remove 95% of total organic carbons. Kwan et al. [Citation18] investigated zirconia and alumina ceramic membranes for oil-in-water emulsion treatment. The oil rejection performance was equivalent but the PF of zirconia membranes was higher than that of alumina. Emani et al. [Citation19] studied cross-flow microfiltration of oil–in-water emulsions using low-cost ceramic membranes. The results obtained for steady-state PF and oil rejection were 22.14 × 10⁻⁶ m3m−2s−1 and 98.52%, respectively. Abbasi et al. [Citation20] presented the results of an experimental study on the separation of oil from real and synthetic oily wastewaters using cheap mullite and MA tubular membranes. The results for the treatment of emulsions showed that mullite ceramic membranes have the highest oil rejection performance (93.8%). They also showed that MA membranes with 75% alumina register high PF (244 Lm−2 h−1) and low oil rejection (81.3%). In some other published papers, researchers have used various types of ceramic membranes in order to achieve marked oil rejection and PF, whilst the introduction of cheap natural zeolite into the structure of membranes is rarely reported.
Figure 1. Schematic representation of blocking mechanisms: (a) complete pore-blocking model, (b) intermediate blocking model, (c) standard blocking model and (d) cake layer formation model.
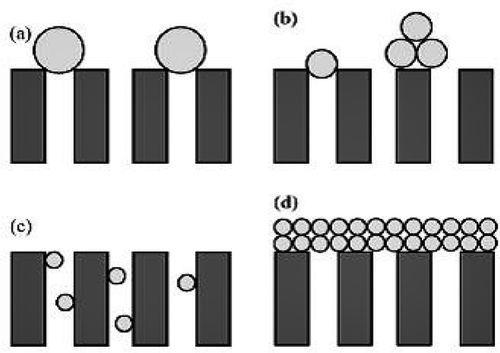
Figure 2. Schematic representation of procedures for membrane fabrication.
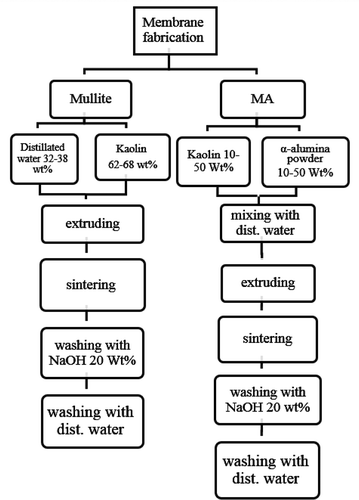
Figure 2. Schematic representation of procedures for membrane fabrication.
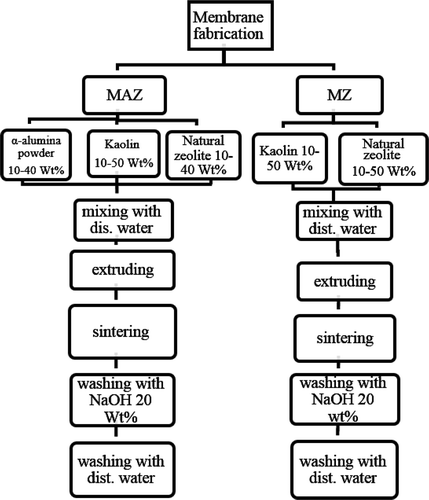
Figure 3. Schematic diagram of MF experimental setup.
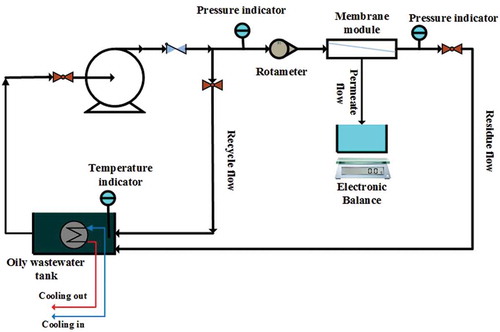
Figure 4. (a) UV-visible absorption curve for synthetic oily wastewater and (b) calibration curve.
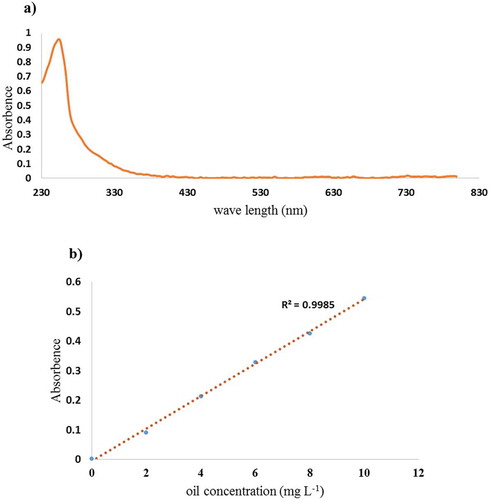
Figure 5. Micrograph of membranes (5000 X): (a) mullite, (b) MA 50%, (c) MAZ 20% and (d) MZ 20%.
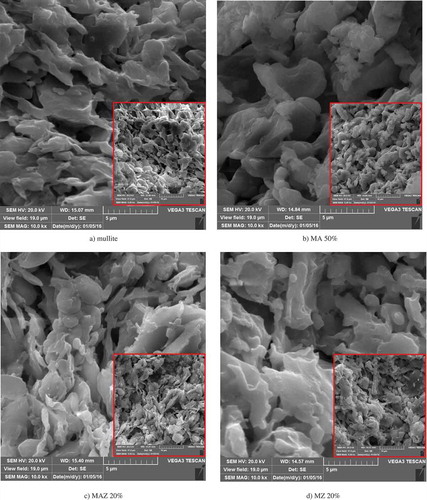
Figure 6. XRD pattern of (a) mullite, (b) MA 50%, (c) MAZ 20% and (d) MZ 20% membranes.
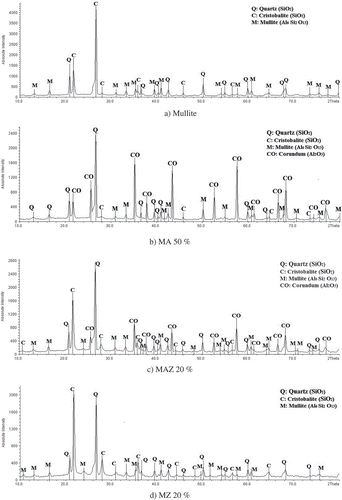
Figure 7. TG analysis of mullite membrane sample at 10◦C min−1.
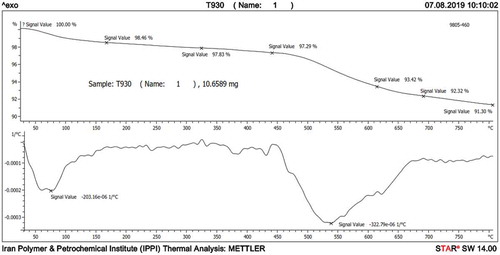
Figure 8. Droplet size distribution of oil-in-water emulsion.
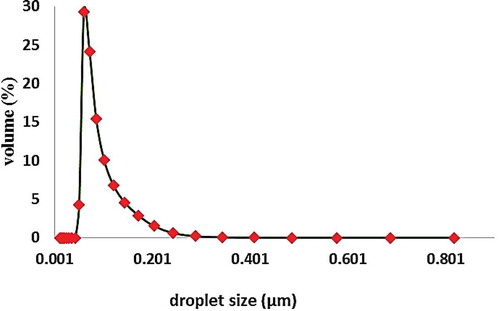
Figure 9. Pure water permeation flux and oil rejection performances for all ceramic membranes.
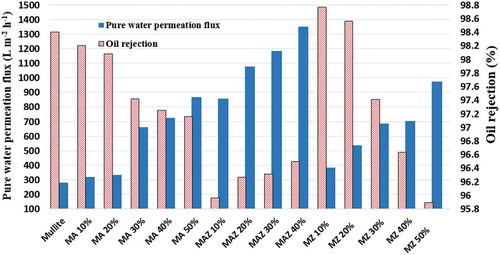
Figure 10. Variations in PF during filtration for (a) mullite and MA (10–50%), (b) MAZ (10–40%) and (c) MZ (10–50%).
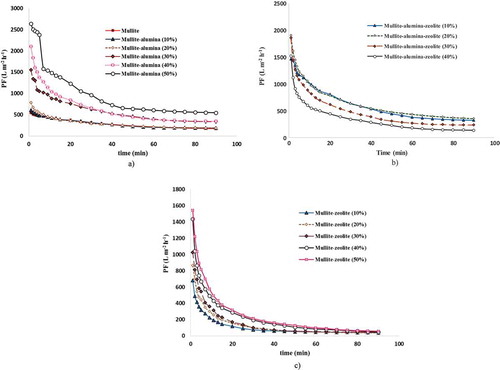
Figure 11. Variations in experimental and predicted PF decline for (a) mullite, (b) MA 10%, (c) MA 20% and (d) MA 30%.
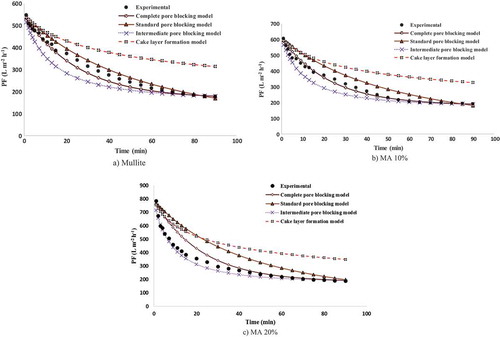
Figure 12. Variations in experimental and predicted PF decline for (a) MA 40%, (b) MA 50%, (c) MAZ 10% and (d) MAZ 20%.
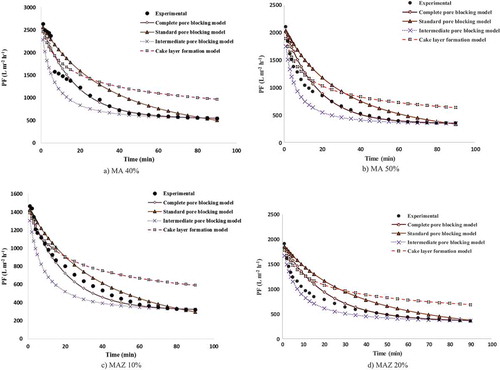
Figure 13. Variations in experimental and predicted PF decline for (a) MAZ 30%, (b) MAZ 40%, (c) MZ 10% and (d) MZ 20%.
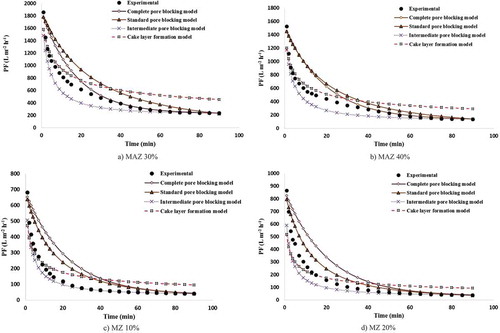
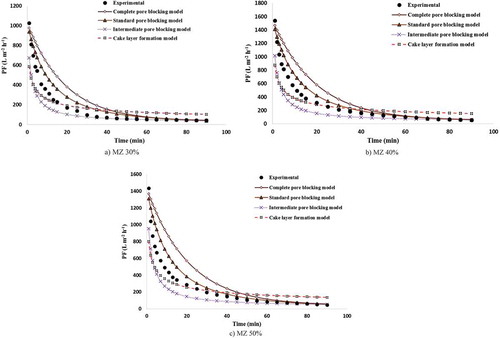
Figure 14. Variations in experimental and predicted PF decline for (a) MZ 30%, (b) MZ 40% and (c) MZ 50%.
In the area of PF modeling of ceramic membranes during oily wastewater treatment using Hermia’s models, the results obtained by Abbasi and Mowla [Citation21] showed that increasing the filtration time changes pore-blocking behavior and that a single model cannot predict the pore-blocking behaviors at all filtration times.
As a novel idea arrived at by considering our previous experience, four types of inexpensive and novel high-performance ceramic microfiltration membranes were fabricated via the extrusion and sintering method. These membranes are mullite, MA, MAZ and MZ, the specification of which are presented in the following sections. In addition, the PF, oil rejection and pure water permeation flux of these membranes in the treatment of oily wastewater are compared. Also, Hermia’s models are used to evaluate the fouling mechanism and predict the PF over time during oily wastewater treatment.
2. Modeling
Hermia’s models are useful tools for describing the fouling mechanism in cross-flow MF processes. These models are also the most applicable models for flux decline prediction. Hermia [Citation22] developed four equations for dead-end filtration to describe fouling mechanisms. These models are the cake layer formation model, intermediate pore-blocking model, standard pore-blocking model and complete pore-blocking model. Schematics of these fouling models are shown in . Detailed descriptions of the four models have been published previously [Citation23].
3. Experimental
3.1. Materials
For fabrication of ceramic membranes, α-alumina powder with a purity of 99.6% was supplied by Iranian Alumina Company. Kaolin clay was purchased from the Zenooz mine, Tabriz, Iran. Natural zeolite powder was provided from Semnan mines, Iran. The results of chemical analysis of kaolin clay, natural zeolite and α-alumina powder are presented in . Tritton X-100 was supplied by Merck Company, Germany. Also, distilled water with a conductivity of less than 5 μs.cm−1 was used. The mean particle sizes of the kaolin, α-alumina and natural zeolite were 25, 75 and 50 µm, respectively, according to the supplier’s catalogs.
Table 1. Chemical analysis of kaolin clay and natural zeolite powder for preparation of ceramic membranes.
3.2. Ceramic membranes fabrication
Before mixing, massive kaolin samples were triturated by employing a crushing machine to obtain fine powders with a 200 mesh sieve size. For mullite membrane preparation, 62–68% kaolin clay was mixed with 32–38% distillated water using a high-powered mechanical mixer for 1 h. The mixture was then extruded to form tubular membranes. All the fabricated membranes had a 10 mm inner diameter, 14 mm outer diameter, and 10 cm length. The in-house fabricated membranes were then dried for 24 h at room temperature, followed by sintering in a programed electric furnace (1200C MINI LAB ELECTRIC, T-Long, China). The temperature gradient used from room temperature to 550°C was 5°C/min. Then, the temperature was kept constant at 550°C for an hour. From 550°C to 975°C, the temperature was increased at a rate of 5°C/min. Finally, after 1 h, the temperature was fixed at 975°C, and then raised from 975°C to 1250°C at a rate of 3°C/min. In order to avoid breaking the sintered membranes due to sudden changes in temperature, the membranes were taken out after 8 h cooling in the furnace [Citation20]. The suitable calcination temperatures and periods are those at which the clay is converted to mullite and free silica. Good results have been achieved by calcining at temperatures of about 1250°C [Citation24].
Free silica can be washed in a strong alkali solution (20 wt% NaOH) for 5 h at 80°C in an oven (WN 30, Lenton, UK) in order to increase the porosity of the fabricated membranes. Finally, the remaining NaOH was removed by washing the membranes with distillated water in an oven for 10 h at 80°C.
MA membranes were prepared by adding 10–50 wt% α-alumina powder to a kaolin and distillated water mixture. The geometrical dimensions and preparation procedures were similar to those of mullite membrane preparation, but the final calcination temperature was 1300°C. α-Al2O3 is transformed completely to the corundum phase at temperatures from 1100°C to 1300°C, and 1300°C was therefore chosen as the final calcination temperature [Citation25].
MAZ membranes were fabricated by mixing 10–40 wt% natural zeolite and α-alumina powder into a mixture of kaolin and distillated water. The membranes’ geometrical dimensions and preparation procedures were similar to those of MA membranes.
MZ membranes were produced by adding of 10–50 wt% natural zeolite powder to a mixture of kaolin and distillate water. The sintering temperature and preparation procedures were the same as those used in mullite membranes preparation. presents the composition, porosity and mean pore size of all the fabricated membranes. A schematic representation of the procedures for membrane fabrication is shown in .
Table 2. Compositions, porosity and mean pore size of synthesized membranes.
3.3. Oily wastewater preparation
Oily wastewater with 1000 mg L−1 oil concentration was prepared in the laboratory by mixing crude oil from the Gachsaran oilfield in Iran and distillate water with Tritton X-100 (0.01 wt % crude oil) as a surfactant agent in order to evaluate the performance of fabricated membranes. A physico-chemical analysis of crude oil is presented in . For the preparation of oily wastewater or an oil-in-water emulsion, 10 gr of crude oil and 0.1 gr of Tritton X-100 were added to 1 L of distillated water. This mixture was then mixed for 30 min at a speed of 19,000 rpm using high-speed laboratory homogenizer (Wise Mix Homogenizer HG 15). Finally, the mixture was diluted by adding 9 L of distillated water to achieve a 1000 mg L−1 oil concentration.
Table 3. Physico-chemical analysis of crude oil for the preparation of synthetic oily wastewater.
3.4. Characterization
Synthesized membranes have been characterized using SEM, XRD, a mean pore size calculation and the mechanical strength. Scanning electron microscopy (SEM) using a TESCAN Vega 3 microscope (Czech Republic) with an accelerating voltage of 20 kV was utilized to study the properties of the membranes’ structure. To identify the phases formed in the sintered membranes, powder X-ray diffraction (XRD) was conducted using a PW1800 X-ray diffractometer (Philips, Netherlands) with Cu Kα radiation at a tension of 40 kV and current of 20 mA.
The membranes’ porosity was measured simply by calculating the water mass trapped in a membrane immersed in a water bath. The soaked membrane, which had a mass of W1 when dry, adsorbed a water mass of (W2 – W1) after 24 h immersion in pure water at ambient temperature. W2 was the mass of the membrane after immersion. The volume of uptake water was then calculated as (W2 – W1)/ρm. Eventually, the membrane porosity was calculated as follows [Citation26,Citation27]:
where W2, W1, and VM are the dry and wet masses and volume of the membrane, respectively, and ρm is the water density at the experimental temperature.
The 3-point bend test with ASTM C1505-01 was selected to measure the membranes’ mechanical strength using a SANTAM, STM-150 universal testing machine, with a 150 KN capacity, total grip distance of 690 mm, dimensions (width × depth × height) of 1070 × 700 × 2430 and 200 V 50–60 Hz power [Citation28]. SANTAM universal testing machines are used in industrial quality-control laboratories and research centers. The machines are able to test the mechanical properties of a wide range of materials such as metals and ceramics.
The membrane average pore radius (rm) was measured by the Guerout-Elford-Ferry equation [Citation29–Citation31]:
where is the membrane porosity (%),
is the water viscosity (8.9 × 10⁻⁴ Pa.s) at the operating temperature, l is the membrane thickness (m), and J is the pure water flux under the specific applied TMP.
The pure water flux for each trans-membrane pressure (TMP) in the range of (0.25–4 bar) was measured for MAZ and MZ membranes. rm was then obtained from the slope (S) of the linear line from TMP versus pure J applying the least square method as follows:
Thermogravimetric (TG) analysis was applied with the aid of a TGA METTLER instrument (METTLER TOLEDO, model TGA DSC 1, Switzerland) on a mullite membrane sample, heated from 25°C to an endpoint of 800°C at a heating rate of 10°C min−1 in an air environment.
3.5. Experimental setup & operation
The experimental setup is shown in . The setup was designed to be simple and to control all operating conditions (T, TMP and CFV) easily. The effects of different operating parameters, such as TMP (0.5–4 bar), CFV (0–2 m s−1) and T (15–55ºC), on the PF, fouling resistance and oil rejection performance of mullite membranes for treatment of synthetic wastewaters were investigated in the previous paper [Citation20]. The optimum operating conditions determined there (TMP = 3 bar, CFV = 1.5 m s−1 and T = 35°C) were used in this study. For other technical descriptions of experimental setups, refer to Rasouli et al. [Citation1,Citation23].
The PF and pure water permeation flux are the volume (V) of the accumulated permeate flow in units of time (t) and the surface (A) of the membrane given by Equation (11):
Oil rejection is the difference between the oil concentrations in the feed (Cf) and permeate flows (Cp) divided by the oil concentration in the feed (Cf) calculated as follows:
All permeate samples were taken in the final 5 min of filtration. All operating conditions during the experimental procedures were fixed and did not change. provides the operating conditions for obtaining the PF and pure water permeation flux for all the tested membranes.
Table 4. Experimental steps and operating conditions for the various tests employed in oily wastewater treatment.
3.5.1. UV calibration curve for oily wastewater
The emulsions had the maximum UV absorption at a 254 nm wavelength. The 254 nm UV was therefore used for the UV spectrometer (Shimadzu UV-1700, Kyoto, Japan) to measure the oil concentrations in the permeates. According to the UV-visible absorption presented in ), the maximum absorption peak at 254 nm was obtained. At 254 nm, the related λmax (wavelength related to maximum UV absorption) did not change with the oil concentration in the emulsion. The linear calibration curve with a coefficient of correlation (R2) of 0.9985 was obtained as shown in ).
4. Results and discussions
4.1. Membranes characterizations
4.1.1. SEM analysis
SEM micrographs of the fabricated membranes are shown in –c). As these images show, the surface morphology of the mullite and MZ membranes resemble each other most closely. This is due to the fact that kaolin clay and natural zeolite powder are the main constituents of mullite and MZ membranes, making the composition of these two mineral powders most similar. Unlike these membranes, the surface morphologies of the MAZ and MA membranes resemble each other less closely because of differences in their α-alumina and natural zeolite powder compositions. As shown in (c,d), natural zeolite and α-alumina powders are fully embedded in the MA and MAZ membranes. It is clearly apparent that the pore size and pore structure change with the alumina and natural zeolite content of the membranes. SEM observation shows that all membranes are porous and have a rough surface morphology. MAZ membranes are more porous than others due to the fact that increasing the sintering temperature from 1100°C to 1400°C causes the particles to agglomerate creating denser ceramic bodies. As a result, the porosity of the membranes increases slightly and the bulk density decreases accordingly [Citation32]. Also, SEM observation shows that the membrane surfaces have no defects in their structures.
4.1.2. XRD analysis
The XRD patterns for four types of membranes are shown in –d). As the XRD patterns show, major phases in mullite and MZ membranes are quartz (ref. code: 00-046-1045) and mullite (ref. code: 00-002-0452) and the minor phase is cristobalite (ref. code: 00-001-0424), while the major phases in MA membranes are corundum (ref. code: 00.010.0173), and quartz and MAZ membrane have only a corundum phase. For these membranes, the minor phases are mullite and cristobalite [Citation33]. The quartz and cristobalite phases can be washed with a strong alkali solution (20 wt% NaOH) in order to increase in the porosity of the membranes. It is reported that elimination of the kaolinite phase occurs in the temperature range of 450–600°C. During water evacuation, kaolinite is converted to metakaolin in which the Si–O bonds remain constant and the Al–O bonds change their position, as illustrated below.
Raising in the sintering temperature above 900 ◦C results in decomposition of the metakaolinite into mullite and cristobalite.
Corundum is the most stable Al2O3 phase at all temperatures under ambient pressure. Other metastable Al2O3 polymorphs are often formed before reaching the most stable α-Al2O3 phase under circumstances such as decomposition of aluminum hydroxide and aluminum oxy-hydroxide, high-temperature oxidation of alumina-forming alloys, and recrystallization of amorphous alumina [Citation34–Citation36].
Kaolin and natural zeolite in mullite and MZ membranes are transformed to quartz, cristobalite and mullite phase under sintering temperature of 1050°C. In MA and MAZ membranes, α-alumina powder is transformed to the corundum crystalline phase at under 1300°C. As shown in (b,c), the absolute intensity and formation of the corundum phase in the structure of MA membranes are greater than in MAZ membranes because more α-alumina powder is present in the MA membrane structure.
4.1.3. Mean pore size analysis
The mean pore diameter of prepared membranes is shown in . As this table shows, mullite membranes have the smallest mean pore diameter of 0.451 µm among all the fabricated membranes. An ascending trend in the mean pore diameter of MA membranes by 10–50 wt% α-alumina powder content can be observed. For MA membranes with 10–50 wt% α-alumina powder content, the mean pore diameter increases from 0.462 µm to 0.507 µm. The mean pore size and porosity of MA membranes are enhanced by the addition of α-alumina powder because of the positioning of α-alumina particles between kaolin particles in the membrane structure. For MAZ, when natural zeolite powder is added to the membrane structure at 10–40 wt%, the same result as mentioned for MA membranes is obtained. The mean pore diameter of the MAZ membranes is continuously extended from 0.473 µm to 0.651 µm with the addition of zeolite. The longest mean pore diameter among all the fabricated membranes of 0.651 µm was calculated for MAZ membranes with natural zeolite and α-alumina powders at 40 wt% and 10 wt%, respectively. Finally, it can be expected that the mean pore diameter of MZ membranes is lower than that of MAZ membranes due to the use of both α-alumina and natural powder in MAZ membranes and of natural zeolite alone in the MZ membrane. The mean pore diameter of MZ membrane with 10–50 wt% natural zeolite added grew continuously from 0.518 µm to 0.574 µm.
The porosity of all the prepared membranes is also shown in . As can be seen, the porosity of the mullite membrane was 32.6%, the lowest value among all the membranes, with the overall mean pore diameter values. The porosity of MA membranes with α-alumina content of 10–50 wt% added grew steadily from 32.8% to 40.4%. As mentioned above, the addition of α-alumina powder increased the mean pore diameter and porosity of MA membranes. For MAZ membranes with 10–40 wt% natural zeolite added, the porosity escalated markedly from 35.7% to 46.6%. Finally, in the case of MZ membranes, the addition of 10–50 wt% natural zeolite powder to the structure caused the porosity of the membranes to rise from 35.8% to 40%.
4.1.4. Mechanical strength
The mechanical strengths of mullite, MA 50%, MAZ 20% and MZ 20% are 18.3, 24.6, 22.2 and 19.8 MPa, respectively. As mentioned in section 4.1.2 above concerning XRD analysis, α-alumina powder in the MA membrane structure is transformed into the corundum crystalline phase at a temperature of 1300°C. It is well known that the main characteristics of the corundum crystalline phase are hardness, high mechanical strength and anti-abrasion properties. The mechanical strength of MA membranes was, therefore, higher than that of other membranes due to greater formation of the corundum phase. It can be expected that the mechanical strength of MAZ membranes will be lower than that of MA membranes because of the lower corundum phase formation due to lower content of the α-alumina powder. The mechanical strength of MZ membranes obtained was higher than that of the mullite membranes because of their natural zeolite content and the resultant formation of more crystalline phases in their structure.
4.1.5. TG analysis
shows a TGA graph of a mullite membrane sample which is heated from room temperature to 800°C at a heating rate of 10°C min−1. Regarding the diagram, two major weight loss steps can be found. The first which occurred at temperatures ranging from almost 25°C to 150°C (approximately 1.5% loss), is an endothermic reaction related to the removal of adsorbed water. The second, a roughly 6% weight loss reported at temperatures of 475–750°C, can be attributed to an endothermic reaction in which hydroxyl groups are separated from the kaolin (kaolin dehydroxylation) structure to form metakaolinite. Further heating leads to the formation of primary mullite. This analysis also confirms that the membrane sample was highly stable at high temperatures. These findings are in good agreement with other published results [Citation33,Citation35,Citation36].
4.1.6. Droplet size distribution of oil in emulsions
The droplet size distribution of oil in emulsions is shown in . As can be seen, the average droplet size of oily wastewater is 112 nm. This emulsion droplet size is small enough to remain stable during filtration. Droplet size distribution analysis showed that emulsions prepared via the mentioned method are stable for about 24 h.
4.2. Experimental results
4.2.1. Comparison of pure water permeation fluxes among the fabricated ceramic membranes
The pure water permeation flux of 15 fabricated membranes is shown in . As can be seen, mullite membranes have the lowest pure water permeation flux of 281 L m−2 h−1 in comparison to other membranes. For MA membranes, increasing the α-alumina content up to 50 wt% in the membrane structure continuously increased the pure water permeation flux. At MA 50 wt%, it rose to 867 L m−2 h−1. A Rapid increasing in this flux was observed with the addition of 30–50 wt% α-alumina powder to the MA membranes, raising it from 332 L m−2 h−1 at MA 20 wt% to 867 L m−2 h−1 in MA 50 wt%. This is due to the fact that increasing the α-alumina powder content of MA membranes causes enlargement of the porosity from 36.4% to 40.4% and increases the average pore diameter of the membranes. It must be noted that the average particle size of α-alumina powder (75 μm) is larger than of kaolin clay (25 μm). Also, the fine sintering temperature of α-alumina (1450–1550°C) powder is higher than the kaolin clay (1100°C); therefore α-alumina particles do not sinter completely at the temperature employed for mullite-alumina membrane preparation (1300°C) [Citation20].
In MAZ membranes, as the figure shows, by addition of natural zeolite and α-alumina up to 30 wt% in their structures, increased the flux continuously from 850 L m−2 h−1 for MAZ 10% to 1350 L m−2 h−1 for MAZ 40%.
Similar observations reflecting the same reasons were reported for the addition of natural zeolite to MZ membranes. In this case, an ascending trend was observed for pure water permeation flux in MZ membranes. The mean pore diameter, the pure water permeation flux and the porosity of MZ membranes increased in comparison to mullite membranes with the addition of natural zeolite because of the hydrophilic nature of natural zeolite. The pure water permeation flux for MZ 10% was reported to be 385 L m−2 h−1, which grew to 975 L m−2 h−1 when the natural zeolite content was increased to 50%.
Among these 15 fabricated membranes, MAZ 40% (40 wt% zeolite, 50 wt% kaolin clay and 10 wt% α-alumina powder) had the highest pure water permeation flux of 1350 L m−2 h−1. In fact, the results illustrate that the addition of natural zeolite affected the flux of MAZ membranes positively. Increasing the zeolite concentration in MAZ membranes led to an increase in pure water permeation flux due to enhancement of the membrane porosity and enlargement of the membrane pore, as shown in .
4.2.2. Comparison of oil rejection performances among the fabricated ceramic MF membranes
As shown in , a high oil rejection rate of about 98.5% has been reported for mullite membranes. For MA membranes, increasing the α-alumina content to 20 wt% in the membrane structure led to a very slight decrease in oil rejection performance from 98.5% to 98.1%, while increasing the α-alumina content from 30 to 50 wt% decreased the oil rejection performance of these membranes sharply from 98.1% to 97.1%. As mentioned, the addition of more α-alumina powder to the membrane structure causes increased in the porosity and average pore radius of the membranes, leading to a decrease in oil rejection and enhancing the pure water permeation flux.
The oil rejection performance of MAZ membranes is roughly the same, lower than that of other membranes because of larger mean pore size and pure water permeation flux. Oil rejection by MAZ 10% is lower than that of other membranes at 95.9%. Increasing the natural zeolite content from 10 wt% to 40wt% (= decreasing the α-alumina content from 40 to 10 wt%) enhanced removal efficiency from 95.9% to 96.4%. This can be attributed to a change in the membrane surface specifications from the hydrophilic perspective with an increase in the fouling layer of oil droplets on the membrane surface and pores caused by increasing the natural zeolite content in the MAZ membranes. On the other hand, the surface hydrophilicity of MAZ membranes decreased with enhancement natural zeolite of the concentration and a resulting decrease in the α-alumina concentration in their structures that led to a larger deposition of fouling on the membrane surface; the oil rejection performance rose as a result. Increasing the Si/Al ratio in the structure of porous materials results in enhancing their hydrophobicity. As clearly shows, this ratio is 0.01 (more hydrophilic properties) and 6.2 (more hydrophobic properties) for α-alumina and natural zeolite, respectively [Citation37]. Thus, increasing the amount of natural zeolite (= decreasing α-alumina) in the membrane structure results in enhanced oil rejection. Another reason for the increased oil rejection by MAZ membranes may be related to the structural complexity of MAZ membranes due to the formation of the corundum phase (a crystalline phase formed from α-alumina) and the mullite, cristobalite and quartz phases (crystalline phases formed from natural zeolite). The surface hydrophilicity, porosity, mean pore diameter and morphology of membranes change with variations in the natural zeolite and α-alumina content in the membranes’ structures.
Finally, the MZ 10% membrane (10 wt% zeolite and 90 wt% kaolin clay) has the highest oil rejection rate of 98.77% among all the fabricated membranes. For MZ membranes, raising the zeolite concentration in the membrane structure causes oil rejection to decline. This is due to the fact that by increasing zeolite powder from 10 wt% to 50 wt% in the structure of MZ membranes, the porosity and the average pore diameter of the membranes increase by 35.8% to 40% at 0.518 µm to 0.574 µm, respectively.
4.2.3. PFs of the membranes during oily wastewater treatment
(a) shows variations in PF over time for mullite and MA 10–50% membranes during oily wastewater treatment. The results illustrate that the PF declines slightly over time for mullite and MA membranes with up to 20 wt% α-alumina powder in their structures, but falls sharply over time for other MA membranes with 30–50 wt% α-alumina powder in their membrane structures. On the other hand, MA membranes with α-alumina content of 30–50 wt% have high initial and final PFs in comparison with mullite membranes. When employing 10–20 wt% α-alumina content in MA membranes, their PF raised slightly, while using 30–50 wt% α-alumina in the membrane structures leads to a rapid increase in the PF rapidly during filtration. The steady-state PF of MA 50% is 549 L m−2 h−1. Employing this membrane, the PF increased during oily wastewater treatment by about 65% in comparison to mullite membranes. These results were obviously obtained because high alumina content in the membrane structure leads to higher porosity and pore sizes and causes the PF of the membrane increase during oily wastewater treatment. As shown in ), adding 10–40 wt% zeolite to the MAZ membrane structure reduces the PF of the membranes during oily wastewater treatment. Steady-state PF was reduced from 236 L m−2 h−1 (in MAZ 10%) to 136 L m−2 h−1 (in MAZ 40%). In fact, the PF of MAZ 40% is reduced by about 42% in comparison with MAZ 10% due to increased fouling of the membranes. An ascending trend was observed for the porosity and mean pore diameter of MAZ 10–40% membranes, however, and a descending trend for the PF was achieved. Intermediate Si/Al zeolites (Si/Al = 2–5) consist of natural zeolites such as clinoptilolite and mordenite. These materials are slightly hydrophobic. Increasing the Si/Al ratio in the zeolite structure causes them to present a highly heterogeneous surface with strongly hydrophobic surface selectivity [Citation38]. The Si/Al ratio for the natural zeolite used in this study is 6.2 according to , and enhancing the natural zeolite content in the MAZ membranes from 10 wt% to 40 wt% consequently results in higher hydrophobicity properties, leading to an increase in fouling effect of oil droplets on the membrane surface and, eventually, to a decrease in PF and resulting in increased oil rejection. As seen in ), increasing the amount of natural zeolite powder from 10 to 50 wt% in the MZ membrane structure increased PF during treatment in comparison to mullite membranes. In this case, the initial PF of MZ 10–50% membranes is higher than that of mullite membranes, while the final PFs (steady-state PFs) of MZ 10% (48 Lm−2h−1), MZ 20% (58 Lm−2h−1), MZ 30% (43 Lm−2h−1), MZ 40% (38 Lm−2h−1) and MZ 50% (40 Lm−2h−1) are lower than those of mullite (176 Lm−2h−1); it can, therefore, be concluded that the fouling effect of oil droplets on MZ membrane surfaces is enhanced by using natural zeolite in the mullite membrane structure. The strongest fouling effect is observed in MZ membranes, moreover, and backwashing, therefore, seems very necessary for these membranes during certain periods of the filtration time. As can be seen clearly in (c), the values for the steady-state PF of MZ 10–50% are very similar and, in fact almost equal to each other. Finally, it must be noted that these membranes are extremely inexpensive because of their fabricating them from low-cost local minerals, and their high PF and oil rejection performance in comparison with commercial membranes used for oily wastewater treatment making them interesting and applicable.
Comparisons between steady-state PFs and oil rejection performances obtained in this study and previous investigations are presented in . As the summarized results show, the highest oil rejection rate, pure water permeation flux and steady PF of 98.77%, 1352 Lm−2h−1 and 549 Lm−2h−1, respectively, were achieved by MZ 10%, MAZ 40% and MA 50%. Strong fouling effects were observed for MZ, MAZ and MA membranes, while mullite membrane was shown a very weak fouling effect. Membranes with the best performance in oily wastewater were those that had a high PF and high oil rejection performance simultaneously. Thus, the best membranes reported in this paper are mullite (PF = 176 Lm−2h−1 & oil rejection performance = 98.5%), MA 50% (PF = 549 Lm−2h−1 & oil rejection performance = 97.1%) among MA membranes, MAZ 20% (PF = 353 Lm−2h−1 & oil rejection performance = 96.2%) among MAZ membranes and MZ 20% (PF = 58 Lm−2h−1 & oil rejection performance = 98.5%) among MZ membranes. As shows, mullite, MA 10–50% and MAZ 10–40% had approximately equal steady-state PF and oil rejection levels to those of commercial α-alumina and ZrO2 membranes, although these in-house fabricated ceramic membranes are extremely economical due to their use of low-cost local mineral clays such as kaolin, α-alumina and natural zeolite powders as starting materials.
Table 5. Average error, R2 and standard deviation in prediction by Hermia’s models of PF decline for all ceramic membranes.
Table 6. Comparisons of steady-state PF and oil rejection performance obtained in the present and previous studies.
4.3. Modeling results
4.3.1. Modeling of the PF decline over time for mullite membranes
) shows the results of PF modeling by Hermia’s models (cake layer formation model, intermediate pore-blocking model, standard pore-blocking model and complete pore-blocking model) for mullite membranes during oily wastewater filtration. As the Figure shows, the complete pore-blocking model is the model in best agreement with the experimental data. In order to determine whether the data agree with any considered models, the R2 of each model, average error and standard deviation for prediction of PF over the whole filtration time with different models are shown in . The average error and R2 between the complete pore-blocking model and experimental PF are 4.46% and 0.9997, respectively. As this table shows, a high standard deviation of about 16.79 was observed for the cake layer formation model. Owing to these results, it can be concluded that mullite membranes’ pores are filled with oil droplets during the initial filtration time. A slight cake layer forms slightly on the membrane surface and the thickness with increases in the filtration time. It must be noted that a comparison with the mean droplet size (112 nm) of oil droplets showed that the mean average pore diameter of mullite membranes (451 nm) is larger, enabling a majority of oil droplets to enter into the mullite pores.
4.3.2. Modeling of the PF decline over time for MA membranes
Modeling of the PF for MA 10% membrane using Hermia’s model for cross-flow microfiltration of oily wastewater is shown in ). As with mullite membranes, the complete pore-blocking model is the best model for prediction of MA 10% PF behavior during the whole filtration time with an average error between the experimental flux decline and modeling data, R2 and the standard deviation of 3.33%, 0.9909 and 2.57, respectively. Unlike MA 10%, the best model for prediction of experimental PF in the MA 20% changed from the complete pore-blocking model to the intermediate pore-blocking model, as shown in ). This is due to effective sweep flocculation resulting from the formation of large flocs and strengthening of the attraction energy between oil droplets. Aggregation and flocculation of oil droplets led to larger droplet sizes equal to the mean pore size of the membranes. In accordance with these observations, the PF showed behavior close to that of intermediate pore-blocking model behavior. R2, the average error and the standard deviation of this model are 0.9913, 5.82% and 4.30, respectively. The largest deviation between the modeling and experimental PF was observed when using the cake layer formation model.
The modeling results for MA 30%, 40% and 50% are shown in ) and (a,b). As these figures illustrate, complete pore blocking with its average errors of 8.20%, 7.21% and 8.74% is the best model for describing the PF behavior of these membranes. R2 and the standard deviation of this model for MA 30%, 40% and 50% are 0.9694, 0.9928, 0.9801 and 12.76, 16.20 and 16.79, respectively. With the addition of α-alumina powder, the hydrophilic nature of the membrane surface increases, preventing oil droplets from passing through the membrane pores. They join together and become larger flocs above the pores of the membranes, thus blocking the pores of the membranes.
4.3.3. Modeling of the PF decline over time for MAZ membranes
Modeling of the PF for MAZ membranes showed that the best mechanism varied between the complete pore-blocking model and the intermediate pore-blocking model. As illustrated in ), the complete pore-blocking model is the best model for describing the PF of MAZ 10% membranes. The average error, R2 and standard deviation of this model are 4.86%, 0.987 and 7.53, respectively. For MAZ 20% membranes, the mechanism of PF behavior changed from the complete pore-blocking model to the intermediate pore-blocking model as shown in ). The average errors obtained with the complete and the intermediate pore-blocking models are almost equal at about 11.81% and 11.52%, respectively. As ) shows, the complete pore-blocking model with an average error, R2 and the standard deviation of 12.76%, 0.9916 and 25.75 is the model which is in the best agreement with the experimental PF for MAZ 30%. Finally, as can be seen in ), for MAZ 40%, the dominant model for prediction of the experimental PF is the intermediate pore-blocking model with its average error of 20.58%. In the case of MAZ membranes, the greatest error and deviation between the experimental and modeling PF are observed when using the cake layer formation model. Oil droplet deformation during filtration may increase the packing density of the cake layer formed and may, therefore, favor a higher cake resistance and a lower PF. The denser the cake layer formed, the greater the flux decline obtained. Oil droplet deformation is influenced by the TMP applied. Higher TMPs may result in more deformation of the oil droplets. The cake layer thickness is influenced mainly by the deposition rate of oil droplets over the membrane surface and the back transport of particles toward the bulk solution [Citation39, 41]. After 40 min from the start of the filtration process, the complete pore-blocking model shows the best fit with the experimental PF. At this time, negatively charged oil droplets coming into contact with the membrane surface become neutralized. Large oil droplets stick together, as a result obstructing the pore entrances [Citation1].
The change in the PF mechanism between the complete and the intermediate pore-blocking models is due to the formation of large oil droplets and reduction in attraction energy between the oil droplets and the membrane surface during filtration [Citation40]. The complete pore-blocking model applies when the size of the particles and oil droplets is greater than the membrane pore size. As a result, the particles and oil droplets, which are larger than the membrane pore size, enter into the membrane pores but do not permeate the membrane. For this reason, the differences between the experimental data and the predicted results can be related to the fact that some particles and oil droplets permeate the membrane due to its greater pore size [Citation39].
4.3.4. Modeling of the PF decline over time for MZ membranes
) shows the PF modeling for MZ 10% membrane using Hermia’s models. As the figure indicates, the intermediate pore-blocking model with an average error, R2 and standard deviation of 10.50%, 0.9983 and 6.13 is the best model for prediction of PF decline data. In this case, the greatest deviation and error between the experimental and modeling results are observed for the cake layer formation model and complete pore-blocking model. For MZ 20% and 30% as well, as shown in ) and (a), the intermediate pore-blocking model is the best and dominant mechanism for modeling the experimental PF. When using this model, the average error, R2 and standard deviation for MZ 20% and 30% are 23.95% and 23.41%, 0.9801 and 0.9922, 14.77 and 19.12, respectively. Finally, the modeling results for MZ 40% and 50% membranes are plotted in ,c). In both the two types of membranes, the PF mechanism changed from the intermediate pore-blocking model to the standard pore-blocking model. This could be due to the fact that most oil droplets are retained by the membrane under the experimental conditions tested, because most of the oil droplets in the feed solution are aggregated and become large flocs during filtration. Therefore, their size is larger than the membrane pores. In addition, the standard pore-blocking model does not account for the effect of operating conditions on the PF. Thus, moderate PF predictions can be obtained using the standard pore-blocking model.
The average error, R2 and standard deviation of the standard pore-blocking mechanism are 24.09% and 20.38%, 0.9909 and 0.9945, and 17.46 and 20 for MZ 40% and 50%, respectively. The greatest average error between the modeled and experimental PFs is observed using the cake layer formation model as about 57% in this case.
5. Conclusion
In this study, synthetic oily wastewater was treated by four types of novel ceramic membranes. These membranes were fabricated using low-cost local powders such as kaolin clay, α-alumina powder and natural zeolite powder as starting materials. The four fabricated ceramic membranes were (І) mullite (ІІ) MA 10–50% (ІІІ) MAZ 10–40% and (ІV) MZ 10–50%. The characteristics of the fabricated membranes were studied using SEM, XRD, TG, mechanical strength analysis and mean pore size calculation. The results obtained by this study showed that, among the fabricated ceramic membranes, MAZ 40% (40 wt% zeolite, 10 wt% α-alumina powder and 50 wt% kaolin clay) and MA 50% have the highest pure water permeation flux and a steady-state PF of about 1352 L m−2 h−1 ad 549 L m−2 h−1 under CFV = 1.5 ms−1, TMP = 1 & 3 bar (1 bar for pure water permeation flux and 3 bars for PF) and T = 35°C conditions. All the fabricated membranes showed very good oil rejection performance varying from 95.8% to 98.7%. Mullite, MZ 10% (10 wt%. zeolite and 90 wt% kaolin clay) and 20% (20 wt% zeolite and 80 wt% kaolin clay) have higher oil rejection rates than the other membranes at 98.4%, 98.7% and 98.5%, respectively. Hermia’s models for cross-flow microfiltration were used to evaluate the fouling mechanism and to predict of the PF during oily wastewater treatment. For mullite, MA 10%, 30%, 40% and 50%, MAZ 10%, 30% and MZ 10–30%, the complete pore-blocking model was the best fouling mechanism, while for MA 20% and MAZ 20% and 40% membranes, the intermediate pore-blocking model was the dominant model. For MZ 40% and 50%, the standard pore-blocking model describes the fouling behavior. The results also showed that for mullite, MA 10–50% the PF decline predicted by Hermia’s models was in excellent agreement with the experimental data. In every case, the cake layer formation model showed the highest error between the experimental results and modeling of PF decline data.
Nomenclature
| C (mg L−1) | = | Concentration |
| CFV (m s−1) | = | Cross-flow velocity |
| L (m) | = | Tubular membrane length |
| A (m2) | = | Membrane area |
| V (L) | = | Volume of collected permeate |
| n (-) | = | Volume fraction of oil in the emulsion sample |
| P (bar) | = | Pressure |
| t (s) | = | Filtration time |
| T (°C) | = | Temperature |
| TMP (bar) | = | Trans membrane pressure |
| di (m) | = | Diameter of individual oil droplets |
| d average (m) | = | Mean oil droplet diameter |
| TOC mg L−1 | = | Total organic carbon |
| MF - | = | Microfiltration |
| NF - | = | Nanofiltration |
| UF - | = | Ultrafiltration |
| PF L m−2 h−1 | = | Permeation flux |
| MAZ - | = | Mullite-alumina-zeolite membrane |
| MZ - | = | Mullite-zeolite membrane |
| rm - | = | Mean pore radius of membrane |
| W1 gr | = | Wet mass of membrane |
| W2 gr | = | Dry mass of membrane |
| ρm Kg m−3 | = | Water density at the experimental temperature |
| Vm m−3 | = | Volume of membrane |
| ε - | = | Porosity of membrane |
| µ Pa.s | = | Viscosity of the pure water at the experimental temperature |
| J Lm−2h−1 | = | Pure water permeation flux |
Disclosure statement
No potential conflict of interest was reported by the authors.
References
- Rasouli Y, Abbasi M, Hashemifard SA. Investigation of in-line coagulation-MF hybrid process for oily wastewater treatment by using novel ceramic membranes. J Clean Prod. 2017;161:545–559.
- Park SH, Park YG, Lim J-L, et al. Evaluation of ceramic membrane applications for water treatment plants with a life cycle cost analysis. Desalin Water Treat. 2015 May 01;54:973–979.
- Rasouli Y, Abbasi M, Hashemifard SA. Oily wastewater treatment by adsorption-MF hybrid process using PAC, natural zeolite powder and low cost ceramic membranes. Water Sci Technol. 2017;76:895-908.
- Garmsiri E, Rasouli Y, Abbasi M, et al. Chemical cleaning of mullite ceramic microfiltration membranes which are fouled during oily wastewater treatment. J Water Process Eng. 2017;19:81–95.
- Seib MD, Berg KJ, Zitomer DH. Reduced energy demand for municipal wastewater recovery using an anaerobic floating filter membrane bioreactor. Environ Sci-Wat Res. 2016;2:290–297.
- Yin N, Wang K, Zhong Z, et al. Ceramic micro/ultra-filtration of low-concentration ultrafine sulfur in desulfurization wastewater. J Chem Technol Biot. 2016;91:3088–3095.
- Zanatta V, Rezzadori K, Penha FM, et al. Stability of oil-in-water emulsions produced by membrane emulsification with microporous ceramic membranes. J Food Eng. 2017 Feb;195:73–84.
- Hubadillah SK, Harun Z, Othman MHD, et al. Preparation and characterization of low cost porous ceramic membrane support from kaolin using phase inversion/sintering technique for gas separation: effect of kaolin content and non-solvent coagulant bath. Chem Eng Res Des. 2016;112:24–35.
- Li L, Chen M, Dong Y, et al. A low-cost alumina-mullite composite hollow fiber ceramic membrane fabricated via phase-inversion and sintering method. J Eur Ceram Soc. 2016 Jul 01;36:2057–2066.
- Khemakhem S, Amara RB. Purification of industrial effluent by microfiltration and ultrafiltration ceramic membranes: comparative study between commercial and elaborated Tunisian clay membranes. Desalin Water Treat. 2012;39:182–189.
- Koĺtuniewicz AB, Field RW. Process factors during removal of oil-in-water emulsions with cross-flow microfiltration. Desalination. 1996;105:79–89.
- Field R, Hang S, Arnot T. The influence of surfactant on water flux through microfiltration membranes. J Membr Sci. 1994;86:291–304.
- Cui J, Zhang X, Liu H, et al. Preparation and application of zeolite/ceramic microfiltration membranes for treatment of oil contaminated water. J Membr Sci. 2008;325:420–426.
- Yang C, Zhang G, Xu N, et al. Preparation and application in oil–water separation of ZrO 2/α-Al 2 O 3 MF membrane. J Membr Sci. 1998;142:235–243.
- Wang P, Xu N, Shi J. A pilot study of the treatment of waste rolling emulsion using zirconia microfiltration membranes. J Membr Sci. 2000;173:159–166.
- Mueller J, Cen Y, Davis RH. Crossflow microfiltration of oily water. J Membr Sci. 1997;129:221–235.
- Abadi SRH, Sebzari MR, Hemati M, et al. Ceramic membrane performance in microfiltration of oily wastewater. Desalination. 2011;265:222–228.
- Kwan SM, Yeung KL. Zeolite micro-fuel cell. Chem Commun. 2008;31:3631–3633.
- Emani S, Uppaluri R, Purkait MK. Cross flow microfiltration of oil–water emulsions using kaolin based low cost ceramic membranes. Desalination. 2014;341:61–71.
- Abbasi M, Mirfendereski M, Nikbakht M, et al. Performance study of mullite and mullite–alumina ceramic MF membranes for oily wastewaters treatment. Desalination. 2010;259:169–178.
- Abbasi M, Mowla D. Analysis of membrane pore-blocking models applied to the MF of real oily wastewaters treatment using mullite and mullite–alumina ceramic membranes. Desalin Water Treat. 2014;52:2481–2493.
- Hermia J. Constant pressure blocking filtration law application to powder-law non-Newtonian fluid. Trans Inst Chem Eng. 1982;60:183–187.
- Rasouli Y, Abbasi M, Hashemifard SA. A new combination of microfiltration, powdered activated carbon and coagulation for treatment of oily wastewater. Int J Environ Sci Technol. 2018 Jul 31.
- Mohammadi T, Pak A. Effect of calcination temperature of kaolin as a support for zeolite membranes. Sep Purif Technol. 2003;30:241–249.
- Loong CK, Richardson JW Jr, Ozawa M. Structural phase transformations of rare-earth modified transition alumina to corundum1. J Alloys Compd. 1997 Mar 20;250:356–359.
- Bakhtiari O, Samei M, Taghikarimi H, et al. Preparation and characterization of mullite tubular membranes. Desalin Water Treat. 2011;36:210–218.
- Arzani M, Mahdavi HR, Bakhtiari O, et al. Preparation of mullite ceramic microfilter membranes using response surface methodology based on central composite design. Ceram Int. 2016 May;42:8155–8164.
- Li K. Ceramic membranes for separation and reaction. John Wiley & Sons, England; 2007.
- Yuliwati E, Ismail AF, Matsuura T, et al. Characterization of surface-modified porous PVDF hollow fibers for refinery wastewater treatment using microscopic observation. Desalination. 2011;283:206–213.
- Zhang X, Lang W-Z, Xu H-P, et al. The effects of hydroxyapatite nano whiskers and its synergism with polyvinylpyrrolidone on poly (vinylidene fluoride) hollow fiber ultrafiltration membranes. RSC Adv. 2015;5:21532–21543.
- Tang CY, She Q, Lay WC, et al. Coupled effects of internal concentration polarization and fouling on flux behavior of forward osmosis membranes during humic acid filtration. J Membr Sci. 2010;354:123–133.
- Li S, Xu N, Duan B, et al. Effects of sintering temperature on properties of green porous mullite ceramics fabricated by insulators waste. Trans Indian Ceram Soc. 2016 Apr 02;75:98–101.
- Saikia J, Sarmah S, Bora JJ, et al. Preparation and characterization of low cost flat ceramic membranes from easily available potters’ clay for dye separation. Bull Mater Sci. 2019;42:104.
- Adachi S, Ishimaru M, Sina Y, et al. Corundum-to-spinel structural phase transformation in alumina. Nucl Instrum Methods Phys Res A. 2015;358:136–141.
- Sahnoune F, Chegaar M, Saheb N, et al. Differential thermal analysis of mullite formation from Algerian kaolin. Adv Appl Ceram. 2008;107:9–13.
- Liu Y-F, Liu X-Q, Wei H, et al. Porous mullite ceramics from national clay produced by gelcasting. Ceram Int. 2001;27:1–7.
- Ahmad NA, Leo CP, Ahmad AL, et al. Membranes with great hydrophobicity: a review on preparation and characterization. Sep Purif Rev. 2015 Apr 03;44:109–134.
- Van Bekkum H, Flanigen EM, Jansen J. Introduction to zeolite science and pratice. In: Studies in surface science and catalysis. Elsevier, Netherlands; 2001.
- Salahi A, Abbasi M, Mohammadi T. Permeate flux decline during UF of oily wastewater: experimental and modeling. Desalination. 2010;251:153–160.
- Abbasi M, Taheri A. Effect of coagulant agents on oily wastewater treatment performance using mullite ceramic MF membranes: experimental and modeling studies. Chin J Chem Eng. 2013;21:1251–1259.
- Vela MCV, Blanco SÁ, García JL, et al. Analysis of membrane pore blocking models applied to the ultrafiltration of PEG. Sep Purif Technol. 2008;62:489–498.