
ABSTRACT
This work aims to prepare low-cost nanocomposite and microcomposite with lower molar ratio CaO/SiO2 (0.4). Nano-silica, rice husk ash and calcined chicken eggshell have been used as silica and calcium sources. Metakaolin has been separately replaced by 0, 10 and 20 wt% of each composite in order to study their behavior on the properties of geopolymers. The hardener used is sodium waterglass from rice husk ash. The surface area of nano-silica and rice husk ash was 54.40 and 4.08 m2/g, respectively. The cumulative volumes of the control geopolymer, the ones containing 10 wt% of microcomposite and nanocomposite are 119.71, 89.92 and 110.49 mm3/g, respectively. The compressive strength of the control specimen is around 64.02 MPa. The one using 10 wt% of microcomposite was 68.97 MPa. It drops to 42.88 MPa when metakaolin was replaced by 20 wt % of microcomposite. Whereas the one using 10 wt% of nanocomposite was 30.03 MPa and it decreases to 26.05 MPa when metakaolin was substituted by 20 wt% of nanocomposite. It can be concluded that 10 wt% of microcomposite could be mixed to metakaolin for strength development and nanocomposite does not recommend to use as an additive for producing high strength of geopolymer cements.
1. Introduction
The principal binding phase contained in the network of the hardening Portland cement paste is calcium silicate hydrate denoted C-S-H phase. This inorganic compound has a nanocrystalline structure [Citation1,Citation2] which is formed in-situ in the network of Portland cement paste. Studies have shown that C-S-H does not present only in the structure of Portland cement paste but also in the structure of geopolymer material. Regarding that issue, Yip et al. [Citation3], Deventer et al. [Citation4] and Temuujin et al. [Citation5] reported that C-S-H contains in the network of geopolymer cement acts as micro-filler. This indicates that C-S-H which is formed in the network of the geopolymer is a nanocrystalline material. In order to investigate the influence of calcium sources on the properties of geopolymer cements, Yip et al. [Citation6] used several aluminosilicate sources and some additives such as calcium-rich materials for producing geopolymer cement. Due to the presence of higher calcium content in the structure of these additives, the C-S-H phase is formed in-situ in the structure of geopolymer materials like Portland cement paste. Some researchers showed that amorphous and nanocrystalline C-S-H could also be produced from calcium and silica sources. For example, Mackenzie et al. [Citation7] prepared amorphous C-S-H using commercial sodium silicate and commercial calcined calcium carbonate. These authors used the prepared C-S-H as an additive for producing metakaolin-based geopolymer cements. Maddalena et al. [Citation8] investigated the influence of the particle size of amorphous silica on the formation of calcium silicate hydrate. These authors used silica fume and nano-silica (precipitated silica) as silica sources and commercial Ca(OH)2 as a calcium source in order to prepare C-S-H. They reported that the smaller particle sizes of nano-silica (between 5 and 20 nm) compared to the one of silica fume (between 100 and 1000 nm) provides nucleation sites for the growth of C-S-H phase. These results were also reported by Land et al. [Citation9] and Wang et al. [Citation10]. In order to produce calcium silicate hydrate using low-value calcium and silica-rich wastes, Mabah et al. [Citation11] prepared C-S-H and used it to investigate the influence of semi-crystalline calcium silicate (0%, 1%, 3%, 5%, 7% and 10%) on the properties of metakaolin-based geopolymer cements. These authors used eggshell as a calcium source and rice husk ash as a silica source to get calcium silicate with the molar ratio CaO/SiO2 kept constant at 0.4. The obtained product was used as an additive to prepare metakaolin-based geopolymer cements. They reported that the compressive strengths increase with increasing the replacement level of metakaolin in the study interval. By contrary, Tchuenté et al. [Citation12] prepared (Ca, Na)-poly(sialate-siloxo) networks from metakaolin and calcium silicate. These researchers prepared CSH with molar ratio CaO/SiO2 equal to 1.0 using nano-silica and calcined chicken eggshell as silica and calcium sources, respectively. They reported that the compressive strengths decrease with increasing the addition of the prepared calcium silicate hydrate. The difference in the behavior of C-S-H prepared by Mabah et al. [Citation11] and Tchuenté et al. [Citation12] could be related to the physico-chemical properties of silica sources used for producing both calcium silicate hydrate. In order to understand the mechanism on the formation of different calcium silicate hydrate, some researchers such as Chen et al. [Citation13] and Marty et al. [Citation2] reported that when the ratio Ca/Si is nearly 1.5, calcium silicate hydrate, and Ca(OH)2 form a nanocomposite because Ca(OH)2 fills the micropores contained in the network of the prepared calcium silicate hydrate. They also reported that in this case, the X-ray diffractogram of C-S-H does not show the reflection peaks of calcium hydroxide. Whereas, when the ratio Ca/Si ratio is higher than 1.5, calcium silicate hydrate, and Ca(OH)2 form a microcomposite due to the fact that Ca(OH)2 precipitates outside the porosity of calcium silicate hydrate and the X-ray pattern detects the reflection peaks of calcium hydroxide. These authors used commercial Ca(OH)2 and commercial amorphous silica (silica fume or precipitated silica). By contrary, Mabah et al. [Citation11] used eggshell and rice husk ash for producing calcium silicate hydrate with a molar ratio CaO/SiO2 equal to 0.4 and the infrared spectrum and X-ray pattern indicate the reflection peaks of calcium hydroxide. But, Tchuenté et al. [Citation12] prepared calcium silicate from calcined chicken eggshell and precipitated silica with molar ratio CaO/SiO2 equal to 1.0. They reported that the X-ray pattern and infrared spectrum of the obtained calcium silicate hydrate do not show the peaks of calcium hydroxide. In the other study, Mabah et al. [Citation14] synthesized calcium silicate hydrate containing different molar ratios CaO/SiO2 such as 0.4, 0.6, 0.8, 1.0, and 1.2. They reported that the infrared spectra and X-ray patterns of all calcium silicate hydrate show the absorption band and the reflection peaks of calcium hydroxide. These results allow us to conclude that the formation of nanocomposite and microcomposite does not depend only on the molar ratio CaO/SiO2, but it could be also depended on the properties of the silica sources used for their preparation.
Hence, the main objective of this study is to first prepare sustainable nanocomposite and microcomposite with lower molar ratio CaO/SiO2 (i.e. 0.4) using precipitated silica or nano-silica and rice husk ash, respectively, as silica sources. The low-value calcium-rich waste such as chicken eggshell was used as a calcium source. Secondly, compare the microstructure, structural, mechanical, and physical properties of the metakaolin-based geopolymer cements using nanocomposite and microcomposite as additives. The calcium hydroxide was also used as an additive in order to evaluate the difference between the prepared nanocomposite and microcomposite. The formation of calcium hydroxide, nanocomposite and microcomposite was monitored using X-ray diffractometry (XRD) and infrared (IR) spectroscopy. The determination of the particle size distributions and specific surface area of the nanocomposite and microcomposite were also performed. The structural properties of geopolymer cements were investigated and their microstructures were assessed on the fragments of geopolymer cements using scanning electron microscope (SEM) and mercury intrusion porosimetry. The mechanical and physical properties were estimated by measuring the compressive strengths and apparent density, respectively.
2. Materials and experimental methods
2.1. Materials
The kaolin used in this work as an aluminosilicate source was gathered from Dibamba in the Douala sub-basin located in the Littoral Region of Cameroon. Rice husk ash was harvested in Ndop, Department of Ngoketundjia, Region of North-West (Cameroon). The brown chicken eggshells were collected from a nearby restaurant in Yaounde situated in the Centre of Cameroon. The chicken eggshell, as well as rice husk, are used because it is commonly disposed of in landfills causing environmental problem. In order to achieve sustainable development, the valorization of these wastes can be economic and environmental. The presence of the high amount of amorphous silica in rice husk ash and higher calcium carbonate in eggshell do these valuable materials for use in industrial application. The collected chicken eggshells were washed with tap water and dried in air overnight and the obtained samples were broken with hand into small pieces. The kaolin, rice husk ash, and the pieces of chicken eggshells were separately grounded in the same condition as well as Mabah et al. [Citation11] and Tchuenté et al. [Citation12]. The obtained powder of kaolin was calcined at 700°C for 4 h and the one of chicken eggshell was calcined at 900°C for 2 h using a heating and cooling rate of 5°C/min. The calcination of these raw materials was performed using a programmable electric furnace with the brand MGS Srl (Italy). The kaolin used in this work was already studied by Tchakouté et al. [Citation15,Citation16] for producing geopolymer cements. The resulting fine powders of metakaolin (MK-Dib0), rice husk ash (RHA) and calcined chicken eggshell (eggshell-900) were already described by Mabah et al. [Citation11] and Tchuenté et al. [Citation12]. The X-ray patterns and infrared spectra of MK-Dib0, RHA, chicken eggshell, and eggshell-900 are reported by Mabah et al. [Citation11]. The precipitated silica or nano-silica was also used by Tchuenté et al. [Citation12] for producing amorphous C-S-H. The chemical compositions of the kaolin, rice husk ash, eggshell, and calcined chicken eggshell are recorded in . NaOH pellet with 99% of purity was provided by Sigma-Aldrich and the precipitated silica (SP) with chemical formula SiO2. xH2O was provided by Probus.
Table 1. Chemical compositions of kaolin (Dib0), rice husk ash (RHA), eggshell, and eggshell-900, %wt. LOI: Loss of ignition at 1000°C for 2 h.
2.2. Experimental methods
2.2.1. Preparation of calcium hydroxide, nanocomposite, and microcomposite
Calcium hydroxide was prepared by adding firstly distilled water to the powder of calcined chicken eggshell. The whole was mixed mechanically for around 2 min in order to get the gel of Ca(OH)2. Nanocomposite and microcomposite were obtained by mixing one part of Ca(OH)2 gel separately with precipitated silica and rice husk ash in the rapid ball mill for about 30 min in order to have each homogeneous paste. The molar ratio CaO/SiO2 of each slurry was kept constant at 0.4. This molar ratio was chosen owing to the finding works of Mabah et al. [Citation14]. The aforementioned each homogeneous paste was dried in an electric oven (GenLabPrime) at 80°C for 24 h. Each powder was crushed in a rapid ball mill (MGS Srl, Italy) for 30 min in order to obtain the homogeneous powders of calcium hydroxide, nanocomposite, and microcomposite. The calcium hydroxide, nanocomposite, and microcomposite powders are denoted CH, ACaS, and SCaS, respectively.
2.2.2. Preparation of the chemical reagent
The chemical reagent from rice husk ash was prepared in order to get the molar ratio SiO2/Na2O equal to 1.5 and the method used for producing it has been already described by Tchakouté et al. [Citation15].
2.2.3. Synthesis of geopolymer cements
Geopolymer cements were prepared by adding the chemical reagent gradually to metakaolin containing 0 or 10 or 20 wt% of calcium hydroxide (CH) or nanocomposite (ACaS) or microcomposite (SCaS) as additives. The obtained each blend was separately mixed mechanically for 5 min. The obtained each slurry was cast in the cubic molds (40 x 40 × 40 mm) for compressive strength measurement and rectangular molds (40 x 40 × 15 mm) for apparent density testing. These specimens were covered with plastic for 24 h and maintained at room temperature of the laboratory. The obtained hardening specimens were demolded after 24 h and sealed in the plastic for 28 days at 27 ± 2°C with 65% of humidity. The hardening geopolymer cements using 0, 10, and 20 wt% of calcium hydroxide (CH) as an additive were labeled G0 (control specimen), GCH10, and GCH20, respectively. Those from 10 to 20 wt% of nanocomposite (ACaS) named GACaS10 and GACaS20, respectively. And those obtained using 10 and 20 wt% of microcomposite (SCaS) as an additive were denoted GSCaS10 and GSCaS20, respectively.
2.2.4. Methods of characterization of calcium hydroxide, nanocomposite, microcomposite, and geopolymer cements
In order to understand the mechanism of the formation of nanocomposite and microcomposite, the particle size distribution and the specific surface area of the precipitated silica or nano-silica and rice husk ash were determined.
The particle size distribution of the powders of commercial precipitated silica or nano-silica and low-value silica-rich waste (rice husk ash) was determined using a laser size analyzer (Master Sizer Hydro 2000S, Malvern, UK) with bi-distilled water as transport medium on the powdered materials dried overnight in an oven at 110°C. Their specific surface area was determined by the Brunauer–Emmett–Teller (BET) method using nitrogen gas sorption with a “Gemini V” analyzer. The samples were outgassed for 24 h at 105°C prior to the measure. It is important to note that BET analysis provides precise specific surface area (m2/g) evaluation of materials by nitrogen adsorption measured as a function of relative pressure. The surface area is determined by calculating the amount of adsorbate gas corresponding to a monomolecular layer on the surface of the material. The technique encompasses external area and pore area evaluations to determine the total specific surface area. BET is used to determine a range of dispersing, solid microporous to mesoporous materials. BJH analysis can also be utilized to define the pore area and specific pore volumes through adsorption and desorption techniques. Using BJH analysis we can conclude that the pore size distribution independent of the external area due to the particle size of the sample. BJH calculation is used for plotting a pore size distribution graph.
The mechanical and physical properties of metakaolin-based geopolymer cements using calcium hydroxide, microcomposite, and nanocomposite as additives were investigated using compressive strength and apparent density measurement. The structural properties such as X-ray diffractometry and infrared spectroscopy were measured and the microstructures were observed using a scanning electron microscope and mercury intrusion porosimetry.
The compressive strengths of the geopolymer cements were performed using an automatic hydraulic press (capacity of 250 kN) with a mark Impact Test Equipment Limited. The loading rate used to measure the strengths was kept constant at 0.500 MPa/s. The mechanical properties were measured using EN196/01 standard.
X-ray patterns of calcium hydroxide, nanocomposite, macrocomposite and selected metakaolin-based geopolymer cements were recorded with CuKα (1.5406 Å) radiation ranging from 5° to 80° (2θ) for 7 h in steps of 0.03° using Bruker D4.
The infrared spectra of calcium hydroxide, nanocomposite, macrocomposite, and metakaolin-based geopolymer cements were measured by the KBr method. In this method, about 1 mg of each sample was mixed with 200 mg of KBr. The whole was press at 100 kN using a hydraulic press in order to produce each pellet. The infrared spectrum of each sample was registered on a Bruker Vertex 80v using a resolution of 2 cm−1 and 32 scans.
The fragments of the selected geopolymer cements were used to observe the micrograph images with an acceleration voltage of 30.0 kV using a JEOL JSM-6390A Scanning Electron Microscope (SEM).
Geopolymer samples molded in the rectangular molds (40 x 40 × 15 mm) were used for measuring the apparent density by Archimedes’ method with the DIN-51097 standards using an automatic instrument denoted Ceramic Instrument mod. DDA/2.
3. Results and discussion
3.1. Characterization of precipitated silica, rice husk ash, prepared calcium hydroxide, nanocomposite, and microcomposite
3.1.1. Particle size distribution and specific surface area of precipitated silica and rice husk ash
depicts the particle size distribution of precipitated silica (SP) and rice husk ash (RHA). It can be seen that the particle size distribution of SP and RHA is ranging from 0.6 to 50 µm and from 0.3 to 100 µm, respectively. This implies that SP has fine particle sizes compared to RHA. This is in agreement with the finding works of Land et al. [Citation9], Wang et al. [Citation10] and Gosalvitr et al. [Citation17] which reported that the particle sizes of precipitated silica or nano-silica are lowest compared to those of rice husk ash. The mode is around 8 µm for both samples and the average particle size (d50) of both samples is nearly the same (i.e. 7.628 and 7.520 µm for SP and RHA, respectively). The fraction of particles of SP and RHA are below 21 and 27 μm, respectively (). shows also that the density distributions of SP and RHA are unimodal indicating these samples are homogeneous.
Figure 1. Particle size distribution of rice husk ash and precipitated silica.
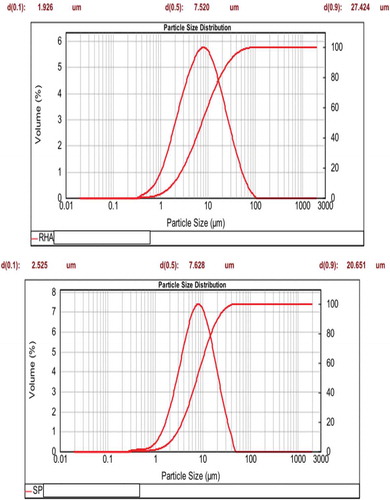
The specific surface areas of the precipitated silica (SP) and rice husk ash (RHA) measured by the BET method are 54.40 and 4.08 m2/g, respectively. It clearly shows that the specific surface area of SP is higher than the one of RHA. This suggests the amorphous character of SP compared to RHA. This confirms the assertion that the finer the particle size, the higher the specific surface area. This is in accordance with the finding works of Mabah et al. [Citation11] and Tchuenté et al. [Citation12] which reported that precipitated silica is completely amorphous while rice husk ash contains amorphous silica associated with cristobalite. The highest specific surface area depicted by precipitated silica could result from the presence of more porous microstructure. Based on the obtained results, we can conclude that the fine particle sizes and the highest specific surface area of precipitated silica provide more nucleation sites (i.e. more porous microstructure). This indicates that during the preparation of calcium silicate hydrate using precipitated silica, calcium hydroxide incorporates in the pores of precipitated silica and therefore contributes to the formation of a nanocomposite. Whereas, during the preparation of calcium silicate hydrate from rice husk ash, calcium hydroxide precipitates outside the porosity of rice husk ash forming a microcomposite. This could be ascribed to its lowest specific surface area and some coarse grains (cristobalite) in its structure which provides to the rice husk ash the presence of fewer pores. The presence of coarse grains in the structure of rice husk ash affects negatively its specific surface area and therefore hinders the incorporation of calcium hydroxide in the pores of rice husk ash. The difference between the specific surface area of SP and RHA is in agreement with their particle size distributions (RHA has 100% of particles below 100 μm and SP has 100% of particles below 50 μm). This suggests that nanocomposite contains fewer nucleation sites compared to the one of microcomposite due to the fact that calcium hydroxide occupied a higher amount of nucleation sites of the precipitated silica.
3.1.2. Mineralogical compositions
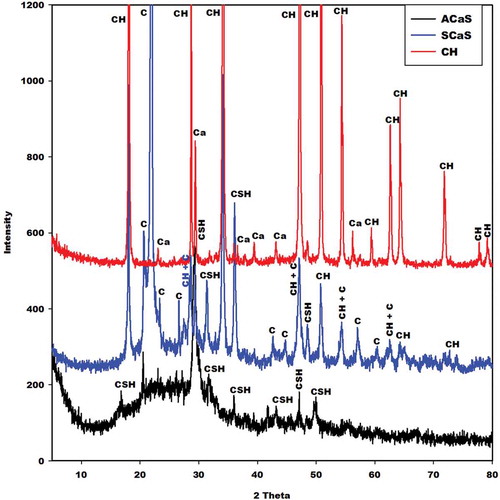
The X-ray patterns of the prepared calcium hydroxide (CH), microcomposite (SCaS), and nanocomposite (ACaS) are given in . This figure shows that the X-ray pattern of CH presents the reflection peaks of calcium hydroxide associated with the trace of calcite owing to the incomplete decomposition of calcium carbonate during the calcination process. The ones of the microcomposite (SCaS) and nanocomposite (ACaS) indicate the broad hump structure between 12° and 40° (2θ) corresponding to the amorphous calcium silicate hydrate contained in both samples. The intensity of this diffuse halo structure is higher on the X-ray pattern of the nanocomposite compared to the one of the microcomposite. This implies the higher amount of amorphous C-S-H in the structure of nanocomposite. Besides the presence of amorphous C-S-H, the X-ray patterns of nanocomposite (ACaS) and microcomposite (SCaS) illustrate the presence of nanocrystalline calcium silicate hydrate. It is important to notice that the nanocrystalline C-S-H has a higher intensity on the X-ray pattern of microcomposite. This suggests that precipitated silica and rice husk ash could be used for producing less crystalline and higher crystalline C-S-H, respectively. The diffractogram of microcomposite (SCaS) presents in addition, some reflection peaks of cristobalite and calcium hydroxide. It is important to note that cristobalite comes from rice husk ask, as reported by Mabah et al. [Citation11] and confirms the presence of coarse grains (i.e. higher particle size distribution) in the structure of RHA. This is in agreement with the lowest specific surface area of RHA. The presence of calcium hydroxide on the X-ray pattern of SCaS confirms the fact that RHA and CH form a microcomposite. Whereas, the absence of this compound (i.e. CH) on the X-ray pattern of ACaS confirms the fact that SP and CH form a nanocomposite. By contrary, the finding works of Marty et al. [Citation2] and Chen et al. [Citation13] indicate that when the ratio Ca/Si is nearly 1.5, C-S-H and CH form a nanocomposite and if Ca/Si ratio is higher than 1.5, C-S-H and CH form a microcomposite. In the present work, the difference between nanocomposite (ACaS) and microcomposite (SCaS) could be related to their particle size distributions () and their specific surface areas. This indicates that it is possible to prepare microcomposite with lower molar ratio CaO/SiO2 using rice husk ash as a silica source. Considering the finding work of Chen et al. [Citation13] and the results obtained in this investigation, it was found that the preparation of microcomposite and nanocomposite do not depend only on the ratio CaO/SiO2 but also on the silica source used for their synthesis.
Figure 2. X-ray patterns of calcium hydroxide (CH), microcomposite (SCaS), and nanocomposite (ACaS). C, CH, CSH, and Ca denote reflection peaks of cristobalite, calcium hydroxide, calcium silicate hydrate, and calcite, respectively.
3.1.3. Infrared spectra
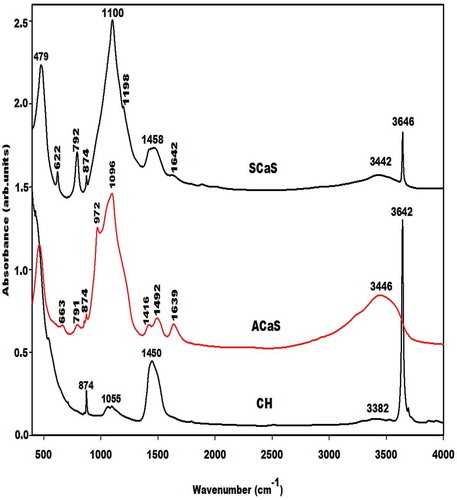
The infrared spectra of calcium hydroxide (CH), nanocomposite (ACaS) and microcomposite (SCaS) are shown in . It is seen that the infrared spectra of CH and microcomposite indicate the narrow absorption bands at 3642 and 3646 cm−1, respectively, which are attributed to the stretching vibration modes of OH of Ca(OH)2 [Citation18]. This absorption band is absent on the infrared spectrum of the nanocomposite. This result is consistent with the X-ray diffractogram of nanocomposite which does not show the reflection peaks of calcium hydroxide. The bands at 874, 1450, 1492, 1458, and 1416 cm−1 observed on the infrared spectra of CH, ACaS, and SCaS and the one at 1055 cm−1 on the infrared spectrum of CH correspond to the vibration modes of C-O of carbonate groups [Citation19]. The absorption band at 3380 cm−1 with lower intensity on the infrared spectrum of CH and those at 1639, 1642, 3446, and 3442 cm−1 on the infrared spectra of ACaS and SCaS is assigned to the vibrations of OH of water molecules for the bands at around 1642 cm−1 and silanol groups for the bands at about 3446 cm−1. The absorption band at about 479 cm−1 on the infrared spectra of nanocomposite and microcomposite belongs to the Si-O bonds of plane vibration. The absorption band at 663 cm−1 on the infrared spectrum of nanocomposite (ACaS) is ascribed to the Si-O out-of-plane vibration of C-S-H [Citation20,Citation21]. The one at 622 cm−1 on the spectrum of microcomposite (SCaS) is assigned to the absorption band of α-cristobalite like those at 792 and 1198 cm−1 [Citation11,Citation22]. The absorption band at 622 cm−1 could be superimposed with the one at 663 cm−1. The broad and narrow absorption bands at 1096 and 1100 cm−1 on the infrared spectra of nanocomposite and microcomposite, respectively, are attributed to the asymmetrically stretching vibration modes of Si-O-Si bonds. The absorption band at 791 and 792 cm−1 on the infrared spectrum of ACaS and SCaS, respectively, could be assigned to the Si-O-Si of amorphous silica [Citation23,Citation24]. This band observed on the infrared spectrum of SCaS is superimposed with the one of cristobalite. The broadband at 1096 cm−1 could be associated with the amorphous phase contained in the nanocomposite (ACaS) and the narrowband at 1100 cm−1 could be assigned to the crystalline silica such as cristobalite contained in the structure of microcomposites (SCaS). This is in agreement with the XRD results which indicate the higher intensity of the broad hump structure observed on the X-ray pattern of nanocomposite (ACaS). The shoulder band at 972 cm−1 observed only on the infrared spectrum of the nanocomposite is ascribed to the vibration modes of Si-O-Ca corresponding to the characteristic band of amorphous C-S-H [Citation12,Citation18,Citation25,Citation26]. The appearance of this band on the infrared spectrum of ACaS could confirm the including of Ca(OH)2 in the porosity of precipitated silica. This implies the presence of the non-bridging oxygen in the form Si-O-Ca and therefore leading to the formation of a nanocomposite.
Figure 3. Infrared spectra of calcium hydroxide (CH), nanocomposite (ACaS) and microcomposite (SCaS).
3.2. Characterization of metakaolin-based geopolymer cements
3.2.1. X-ray patterns
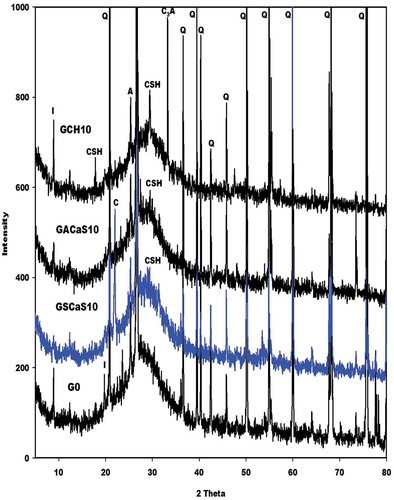
The X-ray patterns of the selected metakaolin-based geopolymer cements G0, GSCaS10, GACaS10, and GCH10 are displayed in . It can be seen that these X-ray patterns indicate the broad hump structure in the range 18-40° (2θ). This confirms the formation of the (Ca, Na)-poly(sialate-siloxo) chains. The obtained (Ca, Na)-poly(sialate-siloxo) chains are wrapped with the crystalline minerals such as illite, quartz, and anatase. These minerals are also observed in the X-ray pattern of metakaolin [Citation11,Citation12]. Besides these minerals, the X-ray patterns of GSCaS10, GACaS10, and GCH10 show the reflection peaks of nanocrystalline calcium silicate hydrate. In addition, those of GSCaS10 and GCH10 indicate the main peaks of cristobalite and tricalcium aluminate (3CaO. Al2O3), respectively. Amongst these minerals, certain could fill the porosity of (Ca, Na)-poly(sialate-siloxo) and therefore reinforce their networks. The cristobalite observed on the X-ray pattern of GSCaS10 comes from the microcomposite SCaS, as can be shown on the X-ray pattern and infrared spectrum of microcomposite, SCaS ( and ). The formation of tricalcium aluminate in the structure of GCH10 could be attributed to the reaction between the precursor [Al(OH)4]− and Ca(OH)2 during the polycondensation reaction.
Figure 4. X-ray patterns of the selected metakaolin-based geopolymer cements G0, GSCaS10, GACaS10, and GCH10.
3.2.2. Infrared spectra
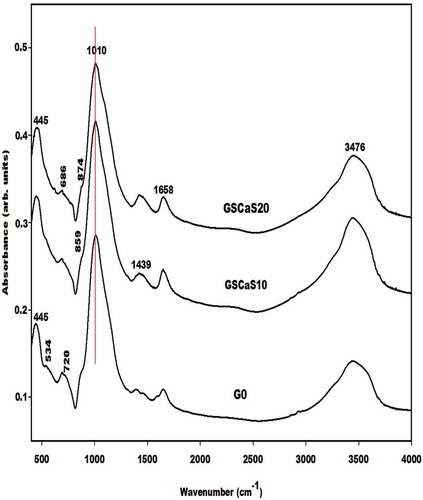
The infrared spectra of the metakaolin-based geopolymer cements using nanocomposite (ACaS), microcomposite (SCaS), and calcium hydroxide (CH) as additives measured using KBr method are depicted in , and , respectively. These infrared spectra were compared to the one of control Na-poly(sialate-siloxo) network named G0. The spectra of all metakaolin-based geopolymer cements show the absorption bands at 445, 696–686, 720, 1658, and 3476 cm−1 which are tremendously discussed by several researchers who their research works include the preparation of geopolymer materials. Mabah et al. [Citation11], Tchuenté et al. [Citation12] and Riyap et al. [Citation27] reported that the wavenumber of the main absorption band of metakaolin appears at 1083 cm−1 whereas those of G0, GSCaS10, GSCaS20, GACaS10, GACaS20, and GCH10 appear at 1010 cm−1 and the one of GCH20 appears at 988 cm−1. These bands (1010 and 988 cm−1) correspond to the stretching vibration modes of Si–O–Si and Si–O–Al which is newly formed in the structure of the metakaolin-based geopolymer cements. The slightly higher shift of 95 cm−1 for GCH20 compared to 73 cm−1 for G0, GCH10, GACaS10, GACaS20, GSCaS10, and GSCaS20 could be assigned to the incorporation of more CaO in the network of GCH20 leading to the formation of the low connectivity of (Ca, Na)-poly(sialate-siloxo) networks. This is due to the hindering of the release of Si and Al species necessary during the polycondensation reaction. The absorption bands at 865 cm−1 present on the infrared spectra of G0, GSCaS10, GACaS10, and GACaS20 are ascribed to the vibration modes of silanol groups. This band is superimposed with the one at 874 cm−1 observed on the infrared spectra of GCH10, GCH20, and GSCaS20. This absorption band is a harmonic of the one at 1439 cm−1. Both bands are assigned to the CO32- of calcium carbonate. The band at 1439 cm−1 is more pronounced on the infrared spectra of GCH10 and GCH20 indicating the carbonation of these specimens.
Figure 5. Infrared spectra of metakaolin-based geopolymer cements G0, GCH10, and GCH20.
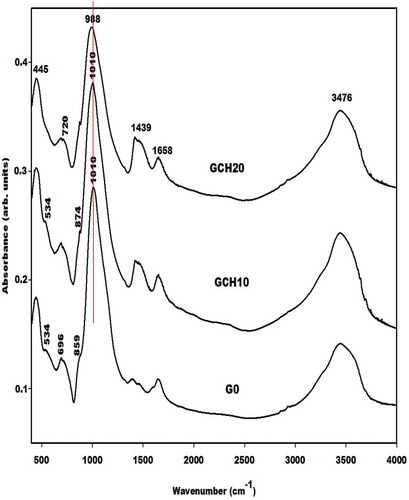
Figure 6. Infrared spectra of metakaolin-based geopolymer cements G0, GACaS10, and GACaS 20.
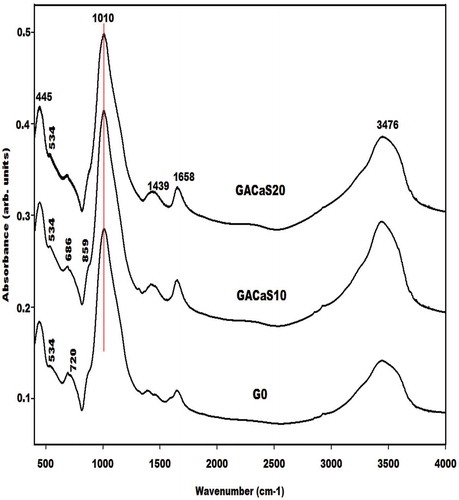
Figure 7. Infrared spectra of metakaolin-based geopolymer cements G0, GSCaS10, and GSCaS 20.
3.2.3. Apparent density
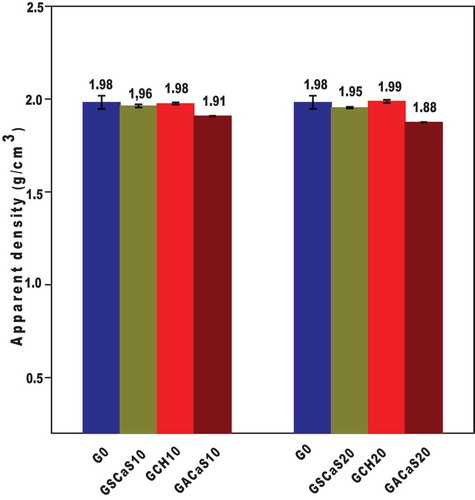
presents the apparent density values of metakaolin-based geopolymer cements G0, GSCaS10, GSCaS20, GACaS10, GACaS20, GCH10, and GCH20 using 0, 10 and 20 wt% of microcomposite, nanocomposite, and calcium hydroxide as additives. It can be seen that the apparent density values of G0, GSCaS10, GSCaS20, GACaS10, GACaS20, GCH10, and GCH20 are 1.98, 1.96, 1.95, 1.91, 1.88, 1.98, and 1.99 g/cm3, respectively. We observed that the apparent density values of these specimens are higher. This implies that these geopolymer cements are compact and homogeneous microstructures, as discussed below. This figure reported that the apparent density values of the geopolymer cements from nanocomposite as an additive is lower compared to the others. This indicates that although the final products are compact microstructures, GACaS10 and GACaS20 are less condensed. This could be assigned to the fact that the nanocomposite contains fewer nucleation sites. The presence of these nucleation sites affects negatively the depolymerization and polycondensation process. This is confirmed by the decrease of the apparent density values of the geopolymer cements containing 10 and 20 wt% of the nanocomposite. The higher apparent density values of GCH10 (1.98 g/cm3) and GCH20 (1.99 g/cm3) compared to those of GSCaS10 (1.96 g/cm3) and GSCaS20 (1.95 g/cm3) could be related to the formation of tricalcium aluminate () in their structures. This could contribute to the more densification of geopolymer cements.
Figure 8. Apparent density of metakaolin-based geopolymer cements.
3.2.4. Compressive strengths
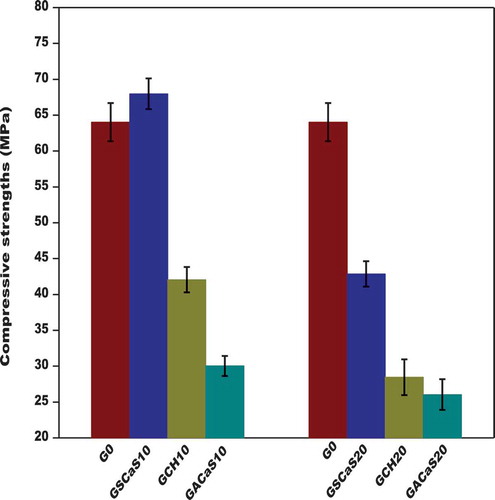
presents the compressive strengths of metakaolin-based geopolymer cements G0, GSCaS10, GSCaS20, GACaS10, GACaS20, GCH10, and GCH20. We observe that the compressive strength values of G0, GSCaS10, GSCaS20, GACaS10, GACaS20, GCH10, and GCH20 are 64.02, 68.97, 42.88, 30.03, 26.05, 42.39, and 28.45 MPa, respectively. It can be seen that the compressive strength value of the control metakaolin-based geopolymer cement (G0) is around 64.02 MPa. Those obtained using 0 and 10 wt% of microcomposite as an additive slightly increase from 64.02 to 68.97 MPa. They drop from 68.97 to 42.88 MPa when metakaolin was replaced by 10 and 20 wt% of microcomposite. Whereas those containing 10 wt% of nanocomposite decreased almost by half (30.03 MPa) when metakaolin was replaced by 10 wt% of the nanocomposite compared to the one of the control geopolymer cement (G0). And decrease from 30.03 to 26.05 MPa when metakaolin was substituted by 20 wt% of the nanocomposite. Concerning the calcium hydroxide, when 0 and 10 wt% of calcium hydroxide was used as an additive for replacing metakaolin, the strengths decrease from 64.02 to 42.39 MPa. They also decrease from 42.39 to 28.45 MPa when the replacement level of metakaolin was 10 and 20 wt%, respectively. It can be observed that the compressive strength value of metakaolin-based geopolymer cement using 10 wt% of microcomposite is higher compared to the others. The higher value of the compressive strength of GSCaS10 could be ascribed to the more nucleation sites (i.e. the addition of nucleation sites for CH and the one of rice husk ash) in the structure of microcomposite (SCaS). This suggests a trigger rapid more cross-linking metakaolin-based geopolymer network formation. Whereas, the lower compressive strength value of the specimen from 10 wt% of nanocomposite corresponds to the fact that calcium hydroxide fills the micropore of nano-silica. This contributes to reducing the nucleation sites and therefore hinders the polycondensation process. We can conclude that Ca(OH)2 contains fewer nucleation sites than microcomposite (SCaS) and more than nanocomposite (ACaS). The lower compressive strength values of the metakaolin-based geopolymer cements when metakaolin was substituted by 20 wt% of SCaS or CH or ACaS, in turn, increase the carbonation process and therefore impede the polycondensation reaction and then reduce the compressive strengths. This is consistent with the infrared spectra results which show the higher intensity of the absorption band at 1439 cm−1 when metakaolin was substituted by 20 wt% of nanocomposite or microcomposite or calcium hydroxide (, and ). The reduction of the compressive strength values when 10 and 20 wt% of Ca(OH)2 was included in the metakaolin could also be related to the reaction between Ca(OH)2 and [Al(OH)4]− forming the tricalcium aluminate, as confirmed by the X-ray pattern of GCH10 (). The formation of this mineral reduces the AlO4 units available for the polycondensation process and therefore hinders the formation of the condensed geopolymer structure. Despite the compressive strength values of the metakaolin-based geopolymer cements containing a higher content (i.e. 20 wt%) of calcium hydroxide or microcomposite or nanocomposite decrease, but they still reasonable. This suggests that these geopolymer materials could be used in civil infrastructure constructions.
Figure 9. Compressive strengths of metakaolin-based geopolymer cements.
3.2.5. Scanning electron microscope and mercury intrusion porosimetry of the selected geopolymer cements
The micrograph images measured at 200×, 1000×, and 5000× magnification of the selected geopolymer cements G0, GSCaS10, GACaS10, and GCH10 are shown in . It appears that the micrographs of these specimens indicate some pores and cracks in their structure. Despite the presence of cracks, these specimens are compact, denser and homogeneous microstructures. The compact and denser microstructure of the selected geopolymer cements is consistent with the apparent density values () and higher compressive strength values () which could be compared to those of CEM II (32 MPa) and CEM I (42.5 MPa).
Figure 10. Micrograph images of the selected metakaolin-based geopolymer cements G0, GSCaS10, GACaS10, and GCH10.
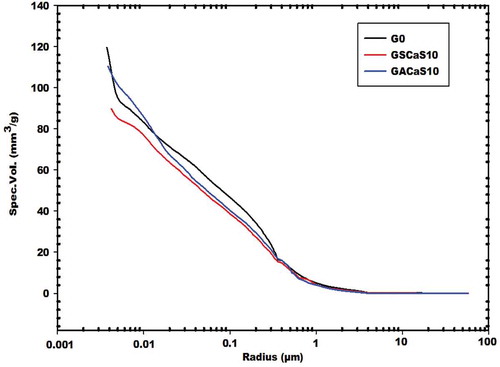
illustrates the cumulative specific intruded volumes versus average pore size radius of the control geopolymer cement (G0) and the selected ones using micro and nanocomposites as additives named GSCaS10 and GACaS10, respectively. It was found to this figure that the cumulative specific intruded volumes of the specimens G0, GSCaS10, and GACaS10 are 119.71, 89.92 and 110.49 mm3/g, respectively. Their medians pore size radius are 44.6, 53.3, and 48.8 nm, respectively. It is important to note that the median pore radius value corresponds to 50% of the total intrusion volume i.e. the diameter for which one half of the pore volume is found to be in larger and one half is found to be in smaller pores. It can be seen in this figure that these geopolymer cements have two class of pores such as large capillary pores with the radius higher than 900 nm and fine pores with the radius less than 900 nm. The lower cumulative specific intruded volumes of the product containing 10 wt% of microcomposite are ascribed to the fewer pore volumes contains in its structure. Based on the information observed in , the calculation of the percentage of the large capillary pores contained in the structure of G0, GSCaS10, and GACaS10 are 6.68%, 8.90%, and 7.24%, respectively. Those of fine pores content are 93.32%, 91.10%, and 92.76%, respectively. It appears that the amount of fine or capillary pores are nearly the same for the selected specimens.
Figure 11. Cumulative specific intrusion volumes versus average pore size radius.
4. Conclusion
Precipitated silica or nano-silica and rice husk ash have the particle size distribution ranging from 0.6 to 50 µm and from 0.3 to 100 µm, respectively. Their specific surface areas are 54.40 and 4.08 m2/g, respectively. Nano-silica and rice husk ash were used as silica sources for producing nanocomposite and microcomposite, respectively. The obtained results show that during the preparation of calcium silicate hydrate using precipitated silica, calcium hydroxide incorporates in the pores of precipitated silica forming a nanocomposite. Whereas during the preparation of calcium silicate hydrate from rice husk ash, calcium hydroxide precipitates outside the porosity of rice husk ash forming a microcomposite. This implies that the microcomposite contains more nucleation sites compared to those of calcium hydroxide and nanocomposite. This study indicates that it is possible to prepare microcomoposite with lower molar ratio CaO/SiO2 using semi-crystalline rice husk ash as a silica source. The obtained sustainable materials (0, 10 and 20 wt%) with molar ratio CaO/SiO2 equal to 0.4 were used to replace metakaolin and each final materials were used to assess the best additive necessary to produce the metakaolin-based geopolymer cements with higher mechanical properties. The cumulative specific intruded volumes of the control specimens, the ones containing 10 wt% of microcomposite and 10 wt% of nanocomposite are 119.71, 89.92 and 110.49 mm3/g, respectively. The lower cumulative specific intruded volumes of the product containing 10 wt% of microcomposite are ascribed to the fewer pore volumes contains in its structure. The compressive strength value of the control geopolymer cement is around 64.02 MPa. The compressive strength values obtained using 10 and 20 wt% of microcomposite as an additive are 68.97 and 42.88 MPa, respectively. Those from 10 to 20 wt% of nanocomposite are 30.03 and 26.05 MPa, respectively. Whereas those from 10 to 20 wt% of calcium hydroxide are 42.39 and 28.45 MPa, respectively. Based on these reasonable values of compressive strength and apparent density values, the microstructures are a compact, homogeneous, and denser matrix. It was typically found that microcomposite is the better additive required for producing metakaolin-based geopolymer cements with higher mechanical properties compared to those obtained using nanocomposite and calcium hydroxide as additives.
Acknowledgments
Dr. Hervé Tchakouté Kouamo gratefully acknowledges the Alexander von Humboldt Foundation for financial support this work under the grant N° KAM/1155741 GFHERMES-P. The authors would like to thank Dr. Valerie Petrov for SEM observations.
Disclosure statement
No potential conflict of interest was reported by the authors.
Additional information
Funding
Related Research Data
References
- Grangeon S, Claret F, Roosz C, et al. Structure of nanocrystalline calcium silicate hydrates: insights from X-ray diffraction, synchrotron X-ray absorption and nuclear magnetic resonance. J Appl Cryst. 2016;49:771–783.
- Marty NCM, Grangeon S, Warmont F, et al. Alteration of nanocrystalline calcium silicate hydrate (C-S-H) at pH 9.2 and room temperature: a combined mineralogical and chemical study. Mineral Mag. 2015;79:437–458.
- Yip CK, Lukey GC, van Deventer JSJ. The coexistence of geopolymeric gel and calcium silicate hydrate at the early stage of alkaline activation. Cem Concr Res. 2005;35:1688–1697.
- van Deventer JSJ, Provis JL, Duxson P, et al. Reaction mechanisms in the geopolymeric conversion of inorganic waste to useful products. J Hazard Mater. 2007;139:506–513.
- Temuujin J, van Riessen A, Williams R. Influence of calcium compounds on the mechanical properties of ?y ash geopolymer pastes. J Hazard Mater. 2009;167:82–88.
- Yip CK, Lukey GC, Provis JL, et al. Effect of calcium silicate sources on geopolymerization. Cem Concr Res. 2008;38:554–564.
- Mackenzie KJD, Smith ME, Wong A. A multinuclear MAS NMR study of calcium-containing aluminosilicate inorganic polymers. J Mater Chem. 2007;17:5090–5096.
- Maddalena R, Hall C, Hamilton A. Effect of silica particle size on the formation of calcium silicate hydrate [C-S-H] using thermal analysis. Thermochim Acta. 2019;672:142–149.
- Land G, Stephan D. The influence of nano-silica on the hydration of ordinary Portland cement. J Mater Sci. 2012;47:1011–1017.
- Wang L, Zheng D, Zhang S, et al. Effect of nano-SiO2 on the hydration and microstructure of Portland cement. Nanomaterials. 2016;6:241.
- Mabah DET, Tchakouté HK, Rüscher CH, et al. Design of low-cost semi-crystalline calcium silicate from biomass for the improvement of the mechanical and microstructural properties of metakaolin-based geopolymer cements. Mater Chem Phys. 2019;223:98–108.
- Tchuenté FM, Tchakouté HK, Banenzoué C, et al. Microstructural and mechanical properties of (Ca, Na)-poly(sialate-siloxo) from metakaolin as aluminosilicate and calcium silicate from precipitated silica and calcined chicken eggshell. Constr Build Mater. 2019;201:662–675.
- Chen J, Sorelli L, Vandamme M, et al. A coupled nanoindentation/SEM-EDS study on low water/cement ratio Portland cement paste: evidence for C–S–H/CH nanocomposites. J Am Ceram Soc. 2010;93:1484–1493.
- Mabah DET, Tchakouté HK, Fotio D, et al. Influence of the molar ratios CaO/SiO2 contained in the sustainable microcomposites on the mechanical and microstructural properties of (Ca, Na)-poly(sialate-siloxo) networks. Mater Chem Phys. 2019;238:121928.
- Tchakouté HK, Rüscher CH, Kong S, et al. Comparison of metakaolin-based geopolymer cements from commercial sodium waterglass and sodium waterglass from rice husk ash. J Sol-Gel Sci Technol. 2016;78:492–506.
- Tchakouté HK, Rüscher CH, Djobo JNY, et al. In?uence of gibbsite and quartz in kaolin on the properties of metakaolin-based geopolymer cements. Appl Clay Sci. 2015;107:188–194.
- Gosalvitr P, Srinophakun P, Kanchanapiya P, et al. The Effects of particle size and content of rice husk ash from textile wastewater treatment on the properties of Portland cement-base solidification. International Conference on Biological, Environment and Food Engineering (BEFE-2015); 2015 May 15-16; Singapore.
- Baltakys K, Jauberthie R, Siauciunas R, et al. In?uence of modi?cation of SiO2 on the formation of calcium silicate hydrate. Mater Sci-Poland. 2007;25:663–670.
- Khachani M, El Hamidi A, Halim M, et al. Non-isothermal kinetic and thermodynamic studies of the dehydroxylation process of synthetic calcium hydroxide Ca(OH)2. Mater Environ Sci. 2014;5:615–624.
- Suda Y, Saeki T, Saito T. Relation between chemical composition and physical properties of C-S-H generated from cementitious materials. J Adv Concr Technol. 2015;13:275–290.
- Kunther W, Ferreiro S, Skibsted J. In?uence of the Ca/Si ratio on the compressive strength of cementitious calcium – silicate – hydrate binders. J Mater Chem A. 2017;5:17401–17412.
- Prasetyoko D, Ramli Z, Endud S, et al. Conversion of rice husk ash to zeolite beta. Waste Manag. 2006;26:1173–1179.
- Zemmukhova LA, Panasenko AE, Tsoi EA, et al. Composition and structure of amorphous silica produced from rice husk ash and strow. Inorg Mat. 2014;50:75–81.
- Liu K, Feng Q, Yang Y, et al. Preparation and characterization of amorphous silica nanowires from natural chrysotile. J Non-Cryst Solids. 2007;353:1534–1539.
- Anjaneyulu U, Sasikumar S. Bioactive nanocrystalline wollastonite synthesized by sol-gel combustion method by using eggshell waste as calcium source. Bull Mater Sci. 2014;37:207–212.
- Lothenbach B, Nied D, L’Hôpital E, et al. Magnesium and calcium silicate hydrates. Cem Concr Res. 2015;77:60–68.
- Riyap HI, Bewa CN, Banenzoué C, et al. Microstructure and mechanical, physical and structural properties of sustainable lightweight metakaolin-based geopolymer cements and mortars employing rice husk. J Asian Ceram Soc. 2019;7:199–212.