
 ?Mathematical formulae have been encoded as MathML and are displayed in this HTML version using MathJax in order to improve their display. Uncheck the box to turn MathJax off. This feature requires Javascript. Click on a formula to zoom.
ABSTRACT
Three components of ferroelectric-dielectric composite ceramic 85Vol% Ba0.5Sr0.5TiO3 – 15Vol% MgO, 78Vol% Ba0.45Sr0.55TiO3 – 22Vol% Mg2TiO4 and 48Vol% Ba0.4Sr0.6TiO3 – 52Vol% BaWO4 were chosen and synthesized by solid-phase reaction. The ferroelectric-dielectric system with different mixing degree was obtained by controlling the milling time. The effects of phase distribution on dielectric properties of composite were reflected. The two-phase distribution of the composite was changed from the layered and columnar dominated structure to the spherical structure, with increasing milling time from 5 min, 30 min, 10 h to 24 h. Permittivity and tunability were increased obviously by the transform of phase distribution patterns. However, the quality factor Q values were strongly deteriorated with extending milling time. Different ball-milling times are used to reflect different phase distribution modes, and the dielectric properties of two-phase composite ceramics in different phase distribution modes are well verified.
1. Introduction
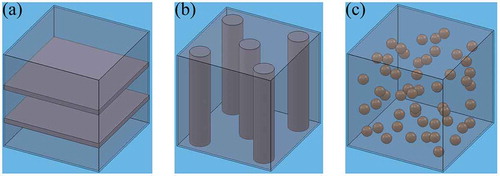
For many years, researchers have considered ferroelectric-dielectric composites as the preferred material for tunable microwave devices [Citation1–Citation12]. A variety of ferroelectric-dielectric composite systems have been studied to achieve good integrated dielectric properties. However, the effect of phase distribution to phase structure, microstructure, and dielectric properties of composite has been less discussed. It has been intuitively believed that uniform distribution produces well properties for composite materials. This is why these material systems are mixed by long-term ball milling (24 h) [Citation6–Citation8]. However, the relationship between phase distribution and dielectric properties is complex. The theory of the linear dielectric response of such materials was first proposed by Hudak et al. [Citation13]. However, the dielectric properties of such composites have been treated only for the case of the simplest models where the components are distributed in layers oriented parallel or normal to the electric field, and the dielectric properties of such composites had been obtained only for the case of the small concentration of the dielectric. Therefore, those theoretical results are not sufficient to comprehensively analyze the dielectric properties of the ferroelectric-dielectric composites. Tagantsev et al. [Citation14] made a further theoretically analyzed the above relationship of ferroelectric-dielectric composites. In Tagantsev’s analysis, for the case of the not small concentration of the dielectric, an approach is proposed for the evaluation of dielectric properties. The basic idea of the approach is to reformulate the effective medium approach in terms of electrical energies stored and dissipated in the composite. The simulation is on the basis of static electricity and the principle of electrical energy store and consumption which produced by the theory of Bruggeman effective medium approach. Dielectric permittivity, tunability, and loss tangent of the composite with different phase distribution modes were simulated by the exact analytical solution method. So Tagantsev’s theory can be used in a wider range. In their study, the structure of composite was divided into three modes, that is, layered, columnar, and spherical, as shown in . The simulation results of Tagantsev show that the dielectric properties are sensitive to the phase distribution pattern. We always thought, long time ball milling brings good uniformity, and good uniformity leads to good performance. Is the better the uniformity the better dielectric properties? This is not the case from Tagantsev’s simulation. So, we had an idea of trying to test Tagantsev’s theory by experiments.
Figure 1. Models of (a) layered, (b) columnar, (c) spherical structure.
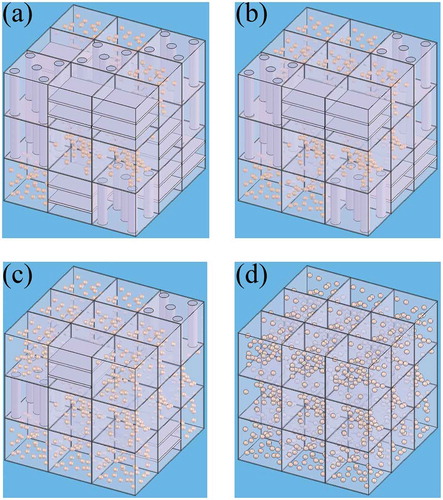
Although the effects of ball-milling time on the dielectric properties of composite ceramics have been studied in several reports [Citation15], they are all analyzed from the perspective of grain size; the influence of two-phase microdistribution on dielectric properties is not involved. We try to study the effect of phase distribution on the properties of composite ceramics by designing comprehensive experiments. It is difficult to achieve a layered and columnar structure by conventional press sintering method because of different sintering behaviors of ferroelectric and dielectric phases. For example, abscission occurs between layers because of the different shrinkage ratios at the same sintering temperature. Thus, the distribution of the ferroelectric-dielectric phase is supposed to control by ball-milling time in this study. At short milling time, it contains a large number of layered-like and columnar-like structures since the two phases are very unevenly mixed. As the milling time increases, the ferroelectric-dielectric composite transforms from a more layered-like and columnar-like structure to a more spherical-like one. As shown in , the models of the composite ceramics with different ball-milling time. Thus, composite ceramics at different milling times were fabricated to study the correlation between phase distribution and dielectric properties. Back Electric Image (BEI) and the following dielectric properties confirm the scientific nature of our assumption. So the phase distribution mode of ferroelectric-dielectric composites was represented by different ball-milling times. It is known that the change of grain size will affect the dielectric properties, the grain size will change with the extension of ball grinding time. Therefore, in order to remove the influence of grain size change on dielectric properties, the properties of BST under different milling times were studied. With decreasing grain size, the Q value at microwave frequencies and the permittivity decreased slightly while the tunability increased slightly.
Figure 2. Models of the composite ceramic samples with different ball-milling time: (a) 5 min, (b) 30 min, (c) 10 h, and (d) 24 h.
In order to reflect the universality, three different composites at different volume fractions were selected shown as follows: 85Vol% Ba0.5Sr0.5TiO3 – 15Vol% MgO (BST50-MO), 78Vol% Ba0.45Sr0.55TiO3 – 22Vol% Mg2TiO4 (BST45-MT) and 48Vol% Ba0.4Sr0.6TiO3 – 52Vol% BaWO4 (BST40-BW). In the previous study, the modification of BST by MgO, Mg2TiO4 and BaWO4 was discussed. It was found that the effect of the modification of BST by the dielectric materials of different structures was quite different, and the optimal performance of each system and the composite amount of the dielectric were also different. Therefore, the optimal performance ratio of the three systems was selected. The phase, micromorphology, and dielectric properties of three composites at different ball-milling times (5 min, 30 min, 10 h, 24 h) were analyzed. And compare the experimental results with Tagantsev’s simulation results. In order to reduce the influence of impurities produced by long time ball milling on the experimental results, high hardness polytetrafluoroethylene ball mill tank and zirconia ball imported from Japan were used for ball milling. And the agglomeration of powders was not found in the selected milling process.
2. Material and methods
BST50, BST45, and BST40 were synthesized at 1200°C with starting materials of BaTiO3 (99.9%) and SrTiO3 (99.9%). Mg2TiO4 was derived from (MgCO3)4·Mg(OH)2 · 5H2O (99.9%) and TiO2 (99.9%) by annealing at 1300°C, while BaWO4 was prepared at 1200°C with BaCO3 (99.99%) and WO3 (99.99%) as raw materials. The starting materials of three composites were mixed by ball-milling with zirconia media in ethanol for 5 min, 30 min, 10 h, and 24 and then dried at 110°C. The dried powders mixed with 8 wt% polyvinyl alcohol (PVA) were pressed into disk-shaped pellets. Samples for low-frequency dielectric measurement are 10 mm in diameter and 1 mm in thickness, while those for microwave frequency measurements have dimensions of 10/5 mm, 12/6 mm, 15/7 mm, and 17/8 mm in diameter/thickness, respectively. The green pellets were burned-out at 550°C for 6 h in air to remove the solvent as well as the binder. All BST50-MO, BST45-MT, and BST40-BW composites were prepared via the conventional solid-state reaction process, sintered for 4 h at 1400°C, 1400°C, and 1350°C, respectively. According to the mold existing got four ceramic samples. Microwave properties were tested under microwave frequencies. Generally speaking, the more the dimension, the larger the Q value and the smaller the resonant frequency is. For the reliability of the experimental data, the second small value is selected. Three samples of similar size were prepared according to the second smallest sample and further tested to eliminate errors. Three samples were selected for low-frequency dielectric performance test. All the samples exhibit high densifications and relative density is no less than 95.5%.
The phase identification on the sintered ceramics was conducted by X-ray diffraction (XRD, Bruker D8 Advanced, Germany) with Cu Kα radiation. Scanning electron microscope (SEM, JSM EMP-800) was used to characterize microstructures of the sintered samples. The gold-plated natural surface sample was used for BEI. Temperature-dependent dielectric permittivity (ε’) and loss tangent (tanδ) of the ceramic samples were measured at 10 kHz by using an HP4284A precision LCR meter (Agilent, Palo Alto, CA). Room temperature dielectric permittivity versus DC bias voltage and temperature dependence of tunability was measured at 10 kHz and 293 K by using a Keithley model 2410 (Cleveland, OH) high voltage source coupled with a TH2816A LCR meter (Changzhou, China). The samples’ dielectric permittivity and loss at microwave frequencies were measured by using the resonance method with a vector network analyzer (Agilent E5071 C). The tested sample is placed between two parallel metal plates. Both sides with an annular coupling antenna consist of two semirigid cables. The other end of the annular coupling antenna is connected with the E5071 C network analyzer, used to feed intake and microwave power. When the medium sample height L = nλg/2 (λg for dielectric waveguide wavelength, n is a positive integer), produce resonance cavity system and become medium cavity. The Hakki–Coleman method consists of the measurement of the resonance frequency and quality factor of the TE01 l mode, to avoid the influence of specimen surface and short circuit metal plate gap capacitance. According to the sample diameter d, height L, get the resonant frequency f, loaded quality factor Q value, and the insertion loss of IL of cavity TE01 l mode resonance peak. The dielectric permittivity and no-load Q (1/tanδ) value of the sample at microwave frequency can be obtained by the calculation software.
3. Results and discussion
3.1. The transition of phase distribution mode under different ball-milling time
Ferroelectric-dielectric composites with different phase distributions were achieved by different ball-milling times. schematically descript the phase distribution of composite ceramics at different ball-milling time. The distribution of ferroelectric and dielectric phases is very uneven in the samples milled in short time. Large area ferroelectric phases and large area dielectric phases are observed by BEI, which correspond to a large number of layered and columnar structures in Tagantsev model. Short-term ball-milled samples are dominated by layered and/or columnar structures as shown in ) and (b), while those milled of long time would transform to a spherical distribution mode just as shown in ). It will be fully justified in the results of BEI and dielectric properties analyzed below.
3.2. Phase structure and microstructure
The typical XRD patterns of BST-based composite samples are shown in . Take BST40-BaWO4 sample as an example, XRD results showed that only the phase of BST and BaWO4 showed no obvious chemical reaction between the two [Citation8]. According to the previous research of our group, it is shown that the diffraction peak moves toward a lower angle in this system, indicating the lattice expansion of BST. The variation of the cell parameter obtained from XRD analysis by Jade 5.0 is plotted in . For the radius of Sr2+ ion (CN = 12, 1.44 Å) is smaller than that of Ba2+ ion (CN = 12, 1.61 Å), this lattice expansion can be attributed to an increase of Ba/Sr ratio in the BST phase which is resulted by enhanced inter-diffusion between BST and BW with the increase of uniformity. Our previous studies have found that there is a certain degree of ion diffusion in each system [Citation6–Citation8]. With extending milling time and the increase in uniformity, the interface between two phases increases and the diffusion degree of ions increases before reaching their respective solution limits. The other two systems BST-MO and BST-MT were similar to the BST-BW system. In these two systems, the diffraction peak of BST crystal phase does not shift as dramatically as in the BW system, while a large number of research data reported that Mg2+ ions are easy to enter the lattice structure of BST, causing the lattice constant change of BST material. The diffraction peak of BST in composite ceramics does not move significantly, which does not necessarily mean that no ions enter the lattice of BST. This may be due to the fact that the radius of Mg2+ ions as 12-coordinate number ion is 0.117 nm, which is smaller than that of Ba2+ ions (0.161 nm) and Sr2+ ions (0.158 nm). And the radius of the 6-coordinate ion is 0.072 nm, which is larger than that of Ti4+ ion (0.0605 nm). In the replacement doping process, Mg2+ ions first enter the A-bit of BST lattice as 12-coordinate number ions and then enter the B-bit of BST lattice structure as 6-coordinate number ions when the A-bit doping amount exceeds 5at%. Mg2+ ions solid solution limit in BST ceramic materials is about 15at%[Citation7]. In this study, because the content of MgO and Mg2TiO4 is 15Vol% and 22Vol% (molar ratio greater than 15at%), the content of Mg2+ ions in the composite ceramic material is far beyond its solid solution limit, so the diffraction peaks of the BST crystal phase in the two systems did not move significantly.
Figure 3. XRD patterns of composite ceramics with different ball-milling time: (1) BST50-MO, (2) BST45-MT, (3) BST40-BW.
Figure 4. Lattice parameter of BST40-BaWO4 composite ceramics with different ball-milling time.
The morphology and phase distribution of the grains were observed by Back Electronic Image of the three systems. shows the BEI of BST-based composite. Both the dielectric phase and the BST phase grain were observed [Citation6–Citation8]. The BST grains of the composite are smaller than the pure BST grains. In the short-time ball-milled sample, a large amount of bulk BST and dielectric component accumulation regions were detected, which corresponds to the model having a more layered structure in . It is conceivable that in a short-time ball-milled ceramic system, the two phases are insufficiently mixed, containing more layered and columnar structures, while a uniform spherical structure is less. The phase distribution is more uniform in and (c) than that in , which is used to illustrate that the columnar and layered structures gradually transform into more spherical structures as the milling time increases. When the milling time is long enough, the two-phase system is considered to be a uniform spherical model structure, as indicated in .
Figure 5. BEI micrograph of composite ceramics with different ball-milling time: (1) BST50-MO, (2) BST45-MT, (3) BST40-BW, a – 5 min, b – 30 min, c – 10 h, d – 24 h.
3.3. Dielectric property analysis at different phase distribution modes
Temperature dependences of dielectric permittivity (ε) and loss tangent (tanδ) of all samples measured at 10 kHz are displayed in . Microwave dielectric properties of all samples measured at room temperature are summarized in . With extending milling time, the Curie peaks become narrower while the εmax gradually increases in all samples. The dielectric permittivity increases and dielectric peak becomes diffuse as the grain size of BST increases according to previous research [Citation16]. From , grain size gradually decreases with the extending of milling time; therefore, one of the possible reasons for the change of dielectric peaks is the transform of phase distribution. On the other hand, long milling time leads to a better chemical homogeneity and thus result in a high permittivity. The decrease oin compositional gradient in the two phases composite ceramic also is one of the possible reasons for the narrowing of the Curie peak.
Table 1. Dielectric properties of all samples measured at room temperature.
Figure 6. Temperature dependence of dielectric permittivity and loss tangent of composite ceramics: (1) BST50-MO, (2) BST45-MT, (3) BST40-BW measured at 10 kHz.
Only the simple composite effect between the two phases was considered in the simulation of Tagantsev, while the influence of the interaction between the components, such as ion diffusion, was not considered. It is known that the contact area between the two phases increases gradually as the ball-milling time prolongs, and the degree of ion diffusion between the two phases will increase continuously before reaching the solid solution limit of the system, it will definitely affect the dielectric properties of composite ceramics [Citation17]. The Curie temperature of composite ceramic has a close relationship with ion diffusion, so the ion diffusion effect must be taken into account when discussing the impact of phase distribution to the Curie temperature. Curie temperatures are also changed with extending milling time. The Curie temperature decreases with the extent milling time as shown in . It is attributed to the fact that Mg occupies the position of Ti and destroys the long-range order of ferroelectricity of BST [Citation18,Citation19]. The increase of the Curie temperature in the BST-BW system with the increase of the milling time is also due to the ion diffusion effect, as shown in (3). With the extension of ball-milling time, the contact area of the two-phase interface increases gradually, and the ion diffusion between BST and BW grains increases gradually, which leads to an increase in the Ba/Sr ratio [Citation8]. It is mainly due to the BaTiO3 is ferroelectric at room temperature, barium titanate paraelectric and ferroelectric phase transition around 130°C, the transition temperature is defined as the Curie temperature (Tc). SrTiO3 is a kind of quantum paraelectric. After a solid solution with BaTiO3, the ferroelectric property of the BST material system is diluted to a certain extent. Therefore, with the increase of Sr content, Tc moves to the direction of low temperature.
DC bias field dependences of dielectric permittivity measured at 10 kHz and 393 K are shown in . Tunability increases with extending milling time for all composite, which can be well explained in terms of phase distribution change. Under normal circumstances, as the Curie temperature increases, the tunability measured at room temperature increases [Citation20]. The tunability of BST-based ceramic decreases with the increase of Sr ion content, mainly because the increase of Sr2+ ions causes the Curie temperature of BST to decrease and the polarity microregion to weaken, so that the dielectric nonlinearity of the material decreases. The results of the BST-BW system fit well with this mechanism [Citation8]. However, in both BST-MO and BST-MT system, as shown in (1), (2) and , Tc decreases with extending milling time, while tunability increases significantly. Therefore, one big reason for the increase in tunability is the transition of phase distribution, corresponding to increase in tunability in Tagantsev’s simulation when there is reduction in the layered structure. Of course, well-homogeneous microstructure and grain size decrease are also possible reasons for high tunability [Citation16,Citation21].
Figure 7. Experimental data and simulation curves of the BST-based composites: (1) BST50-MO, (2) BST45-MT, (3) BST40-BW, a – Dielectric permittivity at RT, b – Dielectric tunability, c – Loss tangent.

Obviously, as shown in , the prolongation of the milling time is such that the Q value of the composite material is seriously degraded, which can be well explained by the change in phase distribution. Inside one component, the field is the same and homogeneous so that the loss tangent of the layered structure of composite can be using an equivalent electrical circuit consisting of two lossy capacitors connected in series. The interface between adjacent layers in the composite destroys the continuity of the electric field [Citation13]. Thus, the layered structure has a loss tangent that is significantly smaller than that of the other two structures. Therefore, as the ball-milling time increases, the layered structure in the system gradually decreases, while the reduction in grain size leads to a reduction in loss [Citation16], so here the reduction in Q value needs to be explained by the change in phase distribution.
3.4. Source and analysis of the simulated curve
shows the simulation results for a theoretical model of a BST-based composite as a function of the volume fraction q of the three dielectric parameters and the three different distribution modes. The data obtained from the experiment are also shown in , represented by small squares.
According to Tagantsev’s simulation, dielectric permittivity of the columnar, layered, and spherical composites can be found as:
where q is the volume concentration of the dielectric phase in the composite, ,
, and
represent the dielectric permittivity of the composite, ferroelectric component, and dielectric component, respectively. The layered and columnar models have minimum and maximum dielectric permittivity, respectively. For the columnar and spherical models, the dielectric permittivity linearly decreases with the inclusion q of the composite. Especially note that in the case of the layered model, the dielectric permittivity substantially decreases with a minor change of dielectric material content and then stays at the same level over a wide range of intervals of q.
Tunability is defined as , where
of the columnar, layered, and spherical composites can be defined as:
The tunability of the composite with layered distribution mode decreased suddenly with the addition of a very small amount of dielectric phase, and then it is almost constant as q increase. In the case of the columnar model, the tunability does not change in a wide range of q, and then sharply decreases when the q value is close to 1. As to spherical models, the tunability increases slightly within the limits of the model applicability.
The loss tangent of the columnar, layered, and spherical inclusion composites can be found as:
where ,
, and
are the loss tangent of the composite, ferroelectric component, and dielectric component, respectively. In the case of a layered model, the addition of dielectric components leads to a rapid decrease in loss tangent, while in the columnar models, no concentration dependence of the dielectric component is observed until up to very high dilution level. As to the spherical model, the behavior of loss tangent is similar to that of the columnar model when the concentration of q is limited to very low. From this, dielectric phase content does not affect loss tangent for the columnar and spherical models. With the prolongation of milling time, the layered distribution in the composite ceramic is gradually reduced, and the spherical distribution is gradually increased. So the tunability exhibited should be gradually increased.
3.5. Consistency analysis of experimental data and simulation results
From , the experimental dielectric permittivity (in Curie temperature and room temperature) of composite ceramics for all three systems is between minimum (layered models) and maximum (spherical inclusion models) values, which exactly fits the simulation results. The dielectric permittivity at Tc increased with an increase of milling time, such as the dielectric permittivity at Tc increase from 1750, 2400, 2600 to 3200 in BST50-MgO system. The dielectric permittivity at room temperature does not strictly conform to the simulation results, which are due to the extremely uneven distribution of the two phases under a short ball grinding time, resulting in the strong dispersion of the dielectric peak, showing the fluctuation of the dielectric permittivity at room temperature.
The prolonged milling time leads to a gradual increase in the tunability of all three composites. The tunability of composite ceramics is between minimum (layered models) and maximum (spherical inclusion models) values in the case of the BST50-MO and BST45-MT. And it increases with the increase of distribution uniformity in three systems. However, the experimental data in BST40-BW exceed the maximum value of the simulation results. It can be explained by ion diffusion between BST and BW phases. The ion diffusion between different components was necessary to take into account when analyzing the impact of phase distribution modes to dielectric properties of the composite, which can explain the tunability does not strictly follow the law. Our previous studies have discovered that BST lattice expansion in BST-BW system. As we have known, tunability increase with the increase of x value in BaxSr1-xTiO3 [Citation8].
It is noted that loss tangent in spherical-like structure is larger than that in layered-like and columnar-like ones, contrary to the general “intuitive belief” that good uniformity leads to high Q values. Q values severely drop with prolonging milling time according to , which is consistent with the simulate results. However, the loss tangent of composite ceramics is higher than the simulate values of three models. Many studies have shown that B-site cation ordering is the key to ensure the high Q of the material system. With the increasing ball-milling time, the ion diffusion effect in the system is continuously strengthened, and the gradually increasing doping effect destroys the harmony of the BST unit cell, which leads to the gradual decrease of the Q value at the microwave frequency [Citation22,Citation23].
4. Conclusions
The effect of phase distribution mode by controlling ball-milling time on dielectric properties of ferroelectric-dielectric composites has been clearly presented. The dielectric properties of ferroelectric-dielectric composite are very sensitive to composite modes of microstructure, which due to the change of electric field distribution and the enhancement of ion diffusion caused by increasing the contact area of two phases. Addition of dielectric component in ferroelectric matrix while having a composite effect and doping effect. With extending milling time, dielectric permittivity and tunability increase whereas Q values reduce significantly. A conclusion, despite conflicting with intuitive expectations, is well explained according to the phase distribution pattern. Thus, the balance between the improvement in tunability and the degradation in loss tangent may be obtained by controlling the phase distribution of the ferroelectric-dielectric composite.
Acknowledgments
This research was supported by the Key R&D project of Shandong Province (Public welfare projects, 2017GGX20126), the Project of Shandong Province Higher Educational Science and Technology Program (J17KA021), the National Natural Science Foundation of China (51402174), and the Young Teacher Development Support Plan of Shandong University of Technology (201418).
Disclosure statement
No potential conflict of interest was reported by the authors.
Additional information
Funding
References
- Kong LB, Li S, Zhang TS, et al. Electrically tunable dielectric materials and strategies to improve their performances. Prog Mater Sci. 2010;55(8):840–893..
- Teranishi T, Osaki K, Hayashi H, et al. Domain engineering enhanced microwave tunability in nonstoichiometric Ba0.8Sr0.2TiO3. J Am Ceram Soc. 2017;101:85–91.
- Bachiri E, Bennani F, Bousselamti M. Dielectric and electrical properties of LiNbO3 ceramics. J Asian Ceram Soc. 2016;4(1):46–54.
- Gu ZQ, Pandya S, Samanta A, et al. Resonant domain-wall-enhanced tunable microwave ferroelectrics, resonant domain-wall-enhanced tunable microwave ferroelectrics. Nature. 2018;560(7720):622–627..
- Wang W, Zhang MW, Xin L, et al. Effect of interface behavior on dielectric properties of ferroelectric-dielectric composite ceramics. J Alloy Comp. 2019;809:151712–151719.
- Zhang MW, Zhai JW, Shen B, et al. MgO doping effects on dielectric properties of Ba0.55Sr0.45TiO3 ceramics. J Am Ceram Soc. 2011;94(11):3883–3888..
- Chou X, Zhai J, Yao X. Dielectric tunable properties of low dielectric constant Ba0.5Sr0.5TiO3-Mg2TiO4 microwave composite ceramics. Appl Phys Lett. 2007;91(12):5–7.
- Zhang MW, Zhai JW, Yao X. Dielectric and tunable characteristics of Ba0.4Sr0.6TiO3-BaWO4 composite ceramics for microwave applications. Mater Res Bull. 2011;46(7):1045–1050.
- Lai Y, Tang X, Xin H, et al. Phase composition, crystal structure and microwave dielectric properties of Mg2-xCuxSiO4 ceramics. J Eur Ceram Soc. 2017;38:95–101.
- Lu X, Bian W, Li Y, et al. Influence of inverse spinel structured CuGa2O4 on microwave dielectric properties of normal spinel ZnGa2O4 ceramics. J Am Ceram Soc. 2017;101:233–239.
- Wang W, Zhang MW, Xin L, et al. Effect of percolation characteristics and ion diffusion on dielectric properties of ferroelectric-dielectric composite ceramics. Ceram Int. 2020;46(1):945–949..
- Vijay B, Pavel T. Synthesis of high density sub-10 µm (Ba0.85Ca0.15)(Zr0.1Ti0.9)O3-xCeO2 lead-free ceramics using a two-step sintering technique. J Asian Ceram Soc. 2019;7(4):536–543.
- Hudák O, Rychetsk I, Petzelt J. Dielectric response of microcomposite ferroelectrics. Ferroelectrics. 1998;208-209(1):429–447.
- Sherman VO, Tagantsev AK, Setter N, et al. Ferroelectric-dielectric tunable composites. J Appl Phys. 2006;99(7):5–11..
- Tusseau-Nenez S, Ganne JP, Maglione M, et al. BST ceramics: effect of attrition milling on dielectric properties. J Eur Ceram Soc. 2004;24(10–11):3003–3011..
- Butee S, Kambale KR, Ghorpade A, et al. Significant improvement in Curie temperature and piezoelectric properties of BaTiO3 with minimum Pb addition. J Asian Ceram Soc. 2019;7(4):407–416..
- Wei L, Chen X, Fan J, et al. Effect of Rb-doping on the dielectric and tunable properties of Ba0.6Sr0.4TiO3 thin films prepared by sol-gel. Ceram Int. 2016;42(15):17229–17236..
- Ge PZ, Tang XG, Liu QX, et al. Temperature-dependent dielectric relaxation and high tunability of (Ba1-xSrx)TiO3 ceramics. J Alloy Comp. 2018;731:70–77.
- Padchasri J, Yimnirun R, Kolodiazhnyi T. Correlation between the 1:2 atomic order and microwave dielectric loss in the off-stoichiometric Ba(Zn1/3Ta2/3)O3. J Eur Ceram Soc. 2018;38(9):3412–3415.
- Chen CH, Chen AN, Wu JM. Highly enhanced dielectric loss of MgO-doped Ba0.67Sr0.33TiO3 ceramics prepared by a non-contamination DCC-HVCI method. J Eur Ceram Soc. 2019;39(14):4149–4155.
- Feteira A, Sinclair D, Reaney IM, et al. BaTiO3-based ceramics for tunable microwave applications. J Am Ceram Soc. 2008;87(6):1082–1087..
- Marlec F, Paven CL, Cheviré F, et al. Ferroelectricity and high tunability in novel strontium and tantalum based layered perovskite materials. J Eur Ceram Soc. 2018;38(6):2526–2533..
- Lu X, Tong Y, Zhang L, et al. High dielectric tunability in composites prepared using SiO2 coated Ba0.5Sr0.5TiO3 nanoparticles. Ceram Int. 2018;44(8):9875–9879..