
 ?Mathematical formulae have been encoded as MathML and are displayed in this HTML version using MathJax in order to improve their display. Uncheck the box to turn MathJax off. This feature requires Javascript. Click on a formula to zoom.
ABSTRACT
In recent years, magnesium alloys have become a subject of interest in many industrial sectors, e.g. the automotive and aircraft industries as well as biomedical and mechanical engineering. Magnesium alloys belong to the group of the lightest alloys of non-ferrous metals. Therefore, their application in the aircraft industry is a very desirable solution. The innovative combination of a composite layer with carbon fibers in aviation on the same principle as fiber metal laminates encourages thorough analysis of the corrosive behavior of the connection of two chemically different materials. As is known, such a connection is greatly exposed to corrosion, especially galvanic, between its components. Therefore, the corrosion behavior of the magnesium alloy with a protective coating must first be examined before joining with the CFRP layer. The present article is the first one in a series of analyses carried out in order to evaluate the corrosion resistance and behavior of the AZ31 alloy with plasma electrolytic oxidation (PEO) and a primer in an NaCl solution. Those results show that among Mg/PEO, Mg/Primer and Mg/PEO/Primer has the best corrosion resistance due to Mg/PEO/Primer possess the PEO and primer layer simultaneously.
1. Introduction
In recent years, magnesium alloys have become a subject of interest in many industrial sectors, e.g. the automotive and aircraft industries as well as biomedical and mechanical engineering. This occurs mainly because of magnesium application exceeds 50% savings in weight for some components. Therefore, substituting other materials for Mg leads to a reduction in fuel consumption by 25%, and 30% lower CO2 emissions. Obviously, it is possible to resolve this problem in a different manner, e.g. generating energy from alternative sources, increasing the quality of trains or aerodynamics. However, the use of material in the form of magnesium alloys seems to be the best solution among the above-mentioned ones, even in terms of costs. Magnesium alloys belong to the group of the lightest alloys of non-ferrous metals. Therefore, their application in the aircraft industry is a very desirable solution. Magnesium alloys represent a category of materials with low density, a high-specific strength/density ratio, and stress shielding stability. Moreover, the Mg-Al-Zn system possesses good mechanical properties [Citation1]. Unfortunately, it is still a niche material due to its challenging anti-corrosion protection. Therefore, scientific aspects are being developed by many scientists in the direction of corrosion protection of materials made with magnesium alloy.
Many different applications are used to perform surface treatments and coating processes to prevent corrosion [Citation2]. Several attempts have been made in order to improve the corrosion resistance of Mg alloys. The negative potential of magnesium alloys is responsible for their great susceptibility to oxidation in air and corrosive electrolytes. On the other hand, the oxide film existing on these alloys can be easily dissolved in corrosive environments. Hence, one of the techniques of preparing the surface is Mg powder cold spraying [Citation3], which increases the corrosion protection of magnesium alloys to the range of Al powder materials. Another method consists of conversion coating treatment with a permanganate phosphate solution, anodic oxidation or galvanic deposit coatings [Citation4,Citation5]. The most important of them utilize surface modification techniques such as anodizing electroless plating solutions containing hexavalent chromium compounds, ion implantation and organic coatings [Citation6–11].
Plasma electrolytic oxidation (PEO), i.e. crystalline ceramics surfaces, also belongs to these methods. PEO has been widely used in recent years due to its many advantages such as uniform deposition [Citation12], adhesion improvement of the subsequent coatings [Citation9,Citation13], cost effectiveness and simplicity in execution [Citation12–17].
The major aspect in creating such a coating consists of selecting the proper current parameters, which make it possible to achieve a durable porous coating [Citation18,Citation19]. In article [Citation20] authors have shown the used of electrolytes which are closely connected with coating property. PEO has the high electrochemical potential and increases corrosion protection. However, Mg characterized by high reactivity is responsible for the occurrence of corrosion. This problem is caused by the synergic effect of the negative standard potential of Mg −2.36 V vs. the standard hydrogen electrode (SHE), the occurrence of impurities (Fe, Cu, Ni) and a quasi-passive protective film based on MgO or Mg (OH)2. This film gives protection in highly alkaline environments only [Citation21–23]. The PEO-coated layer has a morphology with numerous craters due to spark anodization at a high current density. Porosity is an important factor on coating resistance [4 R]. According to studies [Citation24–27], the irregular pores in the PEO layer are the cause of local corrosion. PEO creates a magnesium oxide layer with different thicknesses with a homogenous surface by sealing the pores (by composite coatings, sol/gel coating, particle coating, etc.) [Citation27–31].
The authors of [Citation32] inform that hydro-fluoric acid activates magnesium alloys, e.g. AZ31 with hydro-fluoric acid promotes the formation of a magnesium-fluoride-rich coating, increasing the corrosion resistance in aggressive solutions [Citation27–35]. Unfortunately, this surface preparation is not just enough to protect the Mg alloy during a prolonged period of time in a corrosive environment and the progress of corrosion is very fast in a short-term scale. The most effective method to delay corrosion activity on Mg alloys is by applying surface coatings, not only PEO.
Moreover, there are different kinds of coatings for biomedical Mg alloys. Bio-functionalized coatings (i.e., and anti-bacterial coatings drug-loading) [Citation36,Citation37] super-hydrophobic coatings or self-cleaning coatings, self-repairing coatings and self-sacrificing coating are the most common and actually highly growth [Citation38].
Organic coatings are attractive for biomedical applications as they provide protection against corrosion and can endowed with “smart” functions, such as controlled drug delivery by loading with organic biomolecules [Citation35].
In this regard, considering the use of the innovative combination of a composite with carbon fibers in aviation on the same principle as fiber metal laminates, encourages thorough analysis of the corrosion behavior of the connection of two chemically different materials. As is known, such a connection is greatly exposed to corrosion, especially galvanic, between its components.
Therefore, the present article is the first one in a series of analyses carried out in order to evaluate the resistance and behavior of a magnesium alloy with PEO and primer coatings in an NaCl solution in potentiodynamic tests and electrochemical impedance spectroscopy (EIS). Furthermore, microscopic surface analysis was carried out after corrosion tests including disclosure of the occurred changes and the type of corrosion. The final purpose of the series of articles will be the application of magnesium alloy with PEO and an additional adhesive–anticorrosion agent in order to enable its application in fiber metal laminates containing carbon fibers.
2. Materials and methods
2.1. Materials
AZ31 magnesium alloy in the form of a metal sheet 0.5 mm thick was used for the tests. The chemical compositions in (wt.%) of AZ31 alloy are Al 2.5–3.0, Zn 0.7–1.3, Mn > 0.2 and the balance Mg. All the samples used in this work were grinded using SiC papers ranging from 240 to 1200 grits using high purity ethanol to remove the contamination layers and native oxide, as suggested by Geels [Citation32].
Firstly, magnesium alloy AZ31 surface preparation was performed by PEO as shown in . The process was carried out in the following steps:
Cleaning – degreasing in an industrial alkaline solution.
Surface activation in 10% HF + rinsing in water.
Sample anodizing in an alkaline silicate solution [Citation39] with a pH equal to about 10. Process time equal to 10 minutes, current density of 5 A/dm^2, voltage up to 400 V, high-frequency pulse current.
Rinsing – drying.
Figure 1. Characteristics of magnesium PEO layers
The nature of each phase that is formed in the PEO process depends on the substrate and electrolyte type and species in the electrolyte. In PEO processes, the magnesium substrate is placed as the anode in fluoric-based electrolytes; thus, the magnesium dissolution reaction occurs under a strong electric field producing magnesium ions (Equationequation (1)(1)
(1) ) [Citation33–35].
The formation of oxide films on magnesium (Equationequation (2)(2)
(2) and (Equation3
(3)
(3) )) is due to the outward diffusion of magnesium ions and inward diffusion of OH – under high potentials [Citation36]. The film formation reactions would occur once the concentrations of these ions in the electrode/electrolyte interface reach a critical value. The MgF2 compound isproduced additionally according to the following equation:
The use of fluoride activation in the pre-treatment is also expected to add a layer of MgF2, which minimizes the effect of local corrosion cells by creating (Equationequation 4(4)
(4) ) a potentialized surface [Citation7].
After PEO coating, a commercial EC 2333 (3 M Scotch WeldTM, USA) primer based on resin and inorganic-organic silanes (sol-gel based on Toluene, Glycidyl 3-(trimethoxysilyl)propyl ether) was applied by spray on the samples. The alloy samples were heat treated in air, inside a furnace, at 72°C for 24 hours.
An example of sample configuration is shown in .
Table 1. Short name of samples
2.2. Methods
The open-circuit potential (OCP), polarization curve and impedance (EIS) of the coatings were measured using an Atlas 0531 potentiostat (Atlas-Sollich, Rebiechowo, Poland) with a Frequency Response Analyzer (FRA). The results were subjected to direct analysis in the measurement program. The three-electrode cell consisted of a saturated calomel reference electrode (SCE), a platinum foil electrode, and the test sample as the working electrode in the horizontal position. The exposed area was equal to 5 cm2 and it was performed by means of a neutral 0.5 M NaCl solution for the OCP and potentiodynamic tests. Three repetitions were performed with standard deviation calculation. Due to the non-linear nature of the anodic branch and large Ohmic resistance of hydrogen evolution caused by the negative difference effect, linear Tafel fitting of the anodic slope is very difficult to perform. In this case, using the Tafel extrapolation method for measuring the corrosion rate, the current density is estimated by Tafel extrapolation of the cathodic branch of the polarization curve presented by G. Song and Atrens [Citation21].
The authors of [Citation37–40] generally use the simplified equation for samples with coatings and it is very popular for magnesium alloys. Then, icorr was calculated according to Stern-Geary Equationequations 5(5)
(5) and Equation6
(6)
(6) :
Rp- polarizing resistance with corrosion potential
icorr – corrosion current
The EIS tests were also carried out in a neutral 0.5 M NaCl solution and at ambient temperature after 1 h and 150 h of immersion. The amplitude of the sinusoidal signal was equal to 10 mV versus the open circuit potential and the frequency span was equal to 100 kHz – 0.01 Hz. The impedance spectra are shown in the form of Bode and Nyquist plots.
The macro view of the surface after the corrosion test was obtained by means of a scanner with high resolution (Brother DCP-T500W, Brother Industries, Ltd., Japan).
The microstructures prior to and after the corrosion tests were examined with scanning electron microscopes (NovaNanoSEM 450 and Quanta, FEI Company Japan Ltd., Tokyo, Japan). A low vacuum mode of 100 Pa and voltages of 10 and 15 keV were used for the microscopic analysis. In order to enable more accurate analysis, the samples were subjected to sputtering with a gold layer 10 μm thick. Chemical elements of the PEO coatings were analyzed by energy dispersive spectroscopy (EDS– EDAX, METEK) equipped on the FEI microscopy SEM system. The high voltage size was set to 15 keV.
The high-resolution X-ray diffractometer (Empyrean, PANalytical) with CuKα radiation lamp (l = 1.54056 Å) was used. The test in q-2q geometry of parallel beam was done. The incident beam was formed by the “Parallel Beam x-ray mirror” with a slot 1/4, Ni filter and “parallel plat collimator” on the scattered beam with 1/8 receiving slot in the angular range 2q: 20–120°. Measurement step- 0.01° and counting time per point 5 seconds was applicated. Generator operating parameters: 45 kV and 35 mA and a proportionate detector was used.
The XPS spectra were collected using monochromatized Al source (XM 650 X Ray Monochromator) operating at 325 W and a Scienta R4000 electron analyzer. All the measurements were carried out with an electron flood gun source. The pass energy of the analyzer was set at 200 eV for survey scan and 50 eV for high-resolution regions.
Data processing was performed using the CasaXPS software (v 2.3.3PR 1.0).The spectra were charge corrected and quantified after background (Shirley) subtraction and deconvolution.
Scratch tests were performed in parallel on each coating/substrate system (10 scratches per sample), using the Anton Paar MCT (Micro Combi Tester) Linear Scratch. Rockwell type with a spherical diamond indenter (100 μm tip radius and 90° half angle) was used to perform the scratch tests. The indenter scratched only one time the sample according to standard ASTM-C 1624, over a length of 3 mm, with an increasing linearly from 0.05 N until a maximum of 25 N, at a constant velocity of 0.06 mm/min [Citation39].
3. Results and discussion
3.1. Microstructure
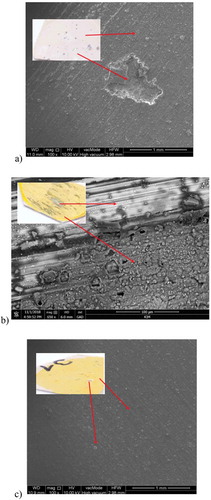
illustrates, by means of an SEM microscope, the microstructure view of the magnesium alloy after PEO processing and with the applied primer.
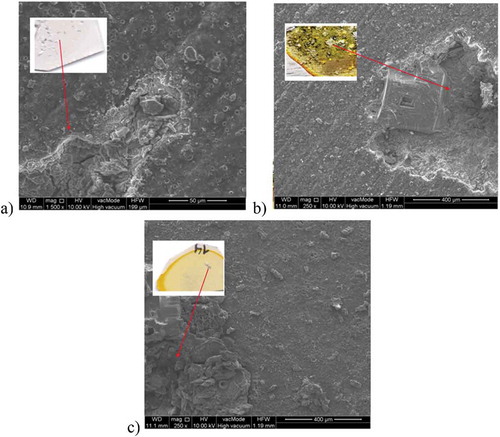
Figure 2. Surface morphology of magnesium alloy: a) Mg/PEO surface and b) cross-section and c) Mg/PEO/primer, view at an angle; SEM
The morphology of the Mg/PEO surface is illustrated in with a visible porous structure after PEO processing with smaller and larger craters. The PEO coating is 8 μm thick. Basically, the coating interface is zigzag–shaped and therefore, the coating seems to be integrated with the substrate (). Generally, the PEO process encompasses a plasma discharge procedure taking place around the metal immersed in the electrolyte which is naturally environmentally friendly. PEO treatment is characterized by three processes occurring simultaneously [Citation33]. Presumably, PEO coatings on magnesium substrates consist of three-layer structures which are visible in ). SEM micrographs of the coating surface and the cross-section are presented in . The figure illustrates the layout of the outer porous layer. shows the compact intermediate dense layer situated in the central area as well as the thin inner dense and compact layer (barrier layer) perfectly adhering to the surfaces.
Generally, the surfaces of PEO coatings are characterized by crater structures incorporating a discharge channel in the central points of the pores. Therefore, the craters are separated by developing boundaries. The presence of large empty spaces in the central points of the craters may be the symptom of intensive discharges potentially penetrating into the coatings. The discharge density and the process duration time affect the size of the pores. The size of the pores in magnesium alloys is equal to about 5–20 μm.
The coating layer is characterized by a diversified crack size caused by different shrinkage rates of the oxides occurring in this area. ) shows the Mg/PEO/Primer configurations. The pores are visible, but it is clearly visible that the PEO layer is covered with the primer. There is a uniform layer of primer on the surface. In this case, it seems that the primer placed on the PEO layer is a protective barrier against the corrosive environment. What follows in further corrosion tests.
Presumably, in the case of the increase in the anodizing layer thickness above a determined level, the electric migration process is reduced as a result of increased resistivity of the oxide layer and the formation of sparks is interrupted.
3.2. Chemical composition analysis
shows the EDS and mapping composition of Mg/PEO combination.
Figure 3. EDS spectrum and chemical composition of Mg/PEO
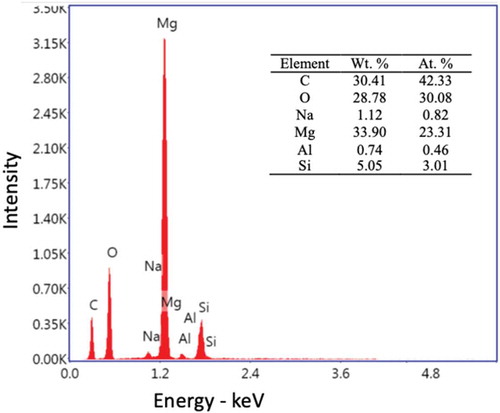
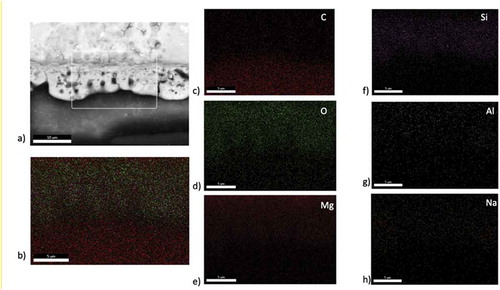
shows the SEM images of the cross-section of Mg/PEO results corresponding to the EDS. There was an 8 µm thick PEO layer near the interface of magnesium. EDS analysis was performed to better understanding the cross-section structure. As shown in the EDS mapping analysis showed that PEO coatings are available in Mg and O. A small amount of Si was also detected. Very little Al was detected in the magnesium alloy. It should be noted that the PEO coatings contain some Si and Na, and these elements can also combine with oxygen, resulting in a higher O/Mg ratio than expected. Evaporation, condensation, decomposition and deposition of the electrolyte could be caused by the plasma discharge. It could be resulted in the incorporation of the electrolyte composition into the PEO coating. It can be seen that Si was higher in the nodules on the surface, suggesting that the silicate in the electrolyte tended to deposit, forming Si-rich nodules on the surface of the PEO coating.
Figure 4. Elemental surface mapping of Mg/PEO: a) cross-section of SEM image of analyzed surface, b) mapping of whole cross-section, c) C content, d) O content, e) Mg content, f) Si content, g) Al content and h) Na content
XRD analysis of PEO coating formed on Mg alloy (AZ31) are shown in .
Figure 5. XRD patterns of PEO coating on Mg alloy
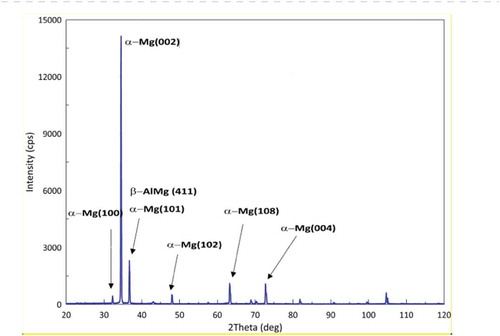
represents the X-ray spectra for PEO on Mg alloy. The Bragg reflection patterns appears maximum intensity peak at 35.33◦, and more less intense peak at 38.94◦, which are assigned to (002) and (101) Mg planes according with respectively [Citation41]. Several low intense peaks were also found around 31.250◦,48.54◦, 63.02◦, 74.30◦. Furthermore, the coating is poorly crystalline and has been shown to contain significant amounts of magnesium. These results suggest that the magnesium ions are readily incorporated into the crystal lattice of the PEO during the deposition of the coating. The composition of the final coating is primarily a magnesium rich.
In XPS test results were shown in more intensity peaks of chemical composition
Figure 6. Survey of XPS spectra of surface PEO layer formed on Mg alloy (AZ31) and contaminations of PEO coating on Mg alloy (AZ31)
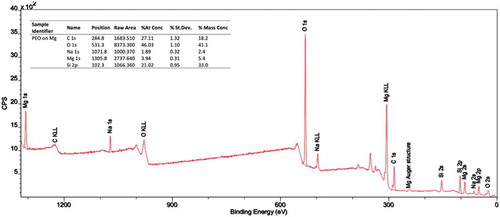
On the basis of high-resolution XPS spectra of oxygen (O 1s), magnesium (Mg 1s) and carbon (C 1s) it is possible to separate the contamination layer and the PEO coating. In the survey spectrum, there are visible the big signals coming from magnesium (Mg 1s), nickel (Na 1s) and silicon (Si 2p) as well as these referred to oxygen (O 1s) and carbon (C 1s). From these data, it follows that the PEO coating is composed mainly of magnesium and oxygen with an amount of nickel and smaller silicon.
3.3. Scratch test
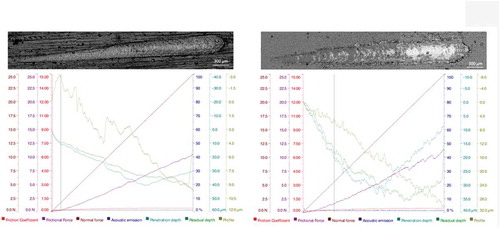
Adhesion properties of PEO and Primer to Mg alloy were evaluated using the scratch test what is shown in Fig …
) shows the data for the Mg/PEO/Primer coating formed that manifested better performance. The value of the load corresponding to the cracks (Lc3) for Mg/PEO/Primer of the studied coatings is 5.684 ± 0.236 N. For Mg/Primer was not noticed the (Lc3). The acoustic emission is in peaks for Mg/PEO/Primer but for Mg/Primer was not observed. The penetration depth is higher for Mg/PEO/Primer and is more sharpened what is shown in ) from scratch path of SEM.
Figure 7. Graphs and track of scratch test for coatings: a) Mg/Primer and b) Mg/PEO/Primer
3.4. Potentiodynamic test
The Tafel plots presenting the 1st, 3rd, 5th cycle of the potentiodynamic test are shown in . These curves clearly characterize the corrosion phenomena and resistance.
Figure 8. Linear polarization curves of 0.5 M NaCl potentiodynamic test: a) Mg/PEO, b) Mg/Primer, c) Mg/PEO/Primer
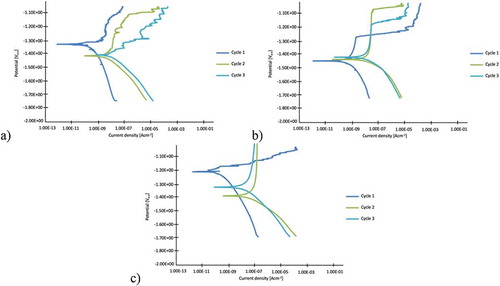
The corrosion potential (, ) shows a similar trend, except for the Mg/Primer surface, which does not change significantly in subsequent cycles. Mg/Primer has the most stable properties in cyclic studies, whereas the Mg/PEO/Primer coating is more stable and has better protective ability in a wider potential range. The coated alloy obviously has more noble Ecorr values than only Mg. The Mg/PEO/Primer sample has the most noble Ecorr. This phenomenon should be induced by the formation of the epoxy coating on the samples. All the samples in show the tendency of a corrosion current density increase in relation to the first cycle but with quite good stabilization of the passivation current density, i.e. the coatings reduce corrosion. The corrosion current density reflects the corrosion kinetics, which is usually used to evaluate the corrosion rate. Epoxy resin creates a uniform layer on PEO and contributes to higher corrosion resistance. The sample with the Mg/PEO layer exhibits intermediate values of corrosion resistance. For the Mg/Primer samples a trans-passivation potential is observed for every cycle.
Table 2. Corrosion parameters of samples
illustrates the macroscopic view and morphology of the surface of the samples after the potentiodynamic test obtained by means of an SEM microscope. This is the best representation of the results of electrochemical corrosion as it was possible to finally observe the characteristics of changes and the type of corrosion. The PEO layer is not visible due to the coated/sputtered thin carbon layer.
Figure 9. Macro- and microstructure of: a) Mg/PEO, b) Mg/Primer, c) Mg/PEO/Primer in 0.5 M NaCl; SEM
In it is possible to observe corrosion changes on each sample already in the macroscopic view. Pitting corrosion occurs in this case. The Mg/PEO/Primer sample is characterized by the lowest number of corrosion changes. The number of corrosion pits found on the Mg/Primer sample is higher and their sizes are larger. The sample using only primer was characterized by the fact that the visible general corrosion areas were larger than the corrosion pits. Therefore, it can be concluded that the combination of the primer with PEO on magnesium exhibits the best corrosion resistance.
3.5. EIS test
The impedance spectrum is presented in the form of Nyquist and Bode plots ( and 6). Interpretation of the diagrams was based on equivalent circuits ().
presents the Bode plots for different samples immersed in an 0.5 M NaCl aqueous solution at room temperature for 1 h () and for 150 h (). The experiment EIS data can be modeled with an equivalent circuit, thereby gaining information about the various processes that occur when the coated samples are exposed to a corrosive environment [Citation42].
Figure 10. Bode plots of immersed samples: a) Mg/PEO-1 h, b) Mg/PEO-150 h and c) Mg/Primer-1 h d), Mg/Primer-150 h and e) Mg/PEO/Primer-1 h f) Mg/PEO/Primer-150 h
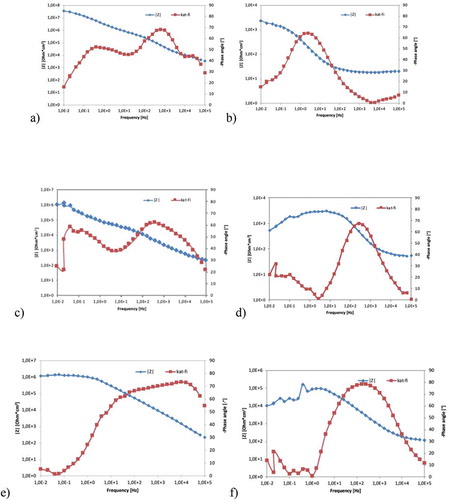
The low-frequency impedance modulus is related to the global resistance of the studied system. The comparison of this parameter obtained for the PEO, primer and PEO/Primer coatings indicate that the PEO layer has a high initial resistance, but over time the charge is carried through the pores. The primer determines the resistance on those samples with the primer.
The coated samples did not show an ideal capacitive behavior (i.e., the phase angles were greater than −70°) [Citation41–43]. The numerical fitting of the two constants observed for the coatings was performed using constant phase elements, instead of capacitances. EIS spectra on Bode charts are constant depending on single- or multi-layer layer structure, regardless of whether the layers are porous or compact. In addition, does the spatial load zone limit the forms of charge transfer used, or does diffusion affect the load transfer process?
The EIS spectra on the Bode plots are constant depending on whether the films have a single or multi-layer structure, regardless of whether the films are porous or compact, whether the space-charge zone limits the charge transfer forms of the potential used, or the charge transfer process is affected by diffusion [Citation44–46]. The relaxation process at high frequencies is attributed to the porous layer and another low frequency is attributed to the internal dense layer. Generally, the low-frequency impedance modulus represents the total resistance of the protective films [Citation46–49]. At the initial stage of testing, the impedance module was high for the frequency of 0.01–0.1 Hz, whilst the PEO layer is higher than the primer layer, ~6 * 107 ohm * cm2 and ~1 * 106 ohm * cm2, respectively. After 150 hours, the |Z| module decreased the least for the PEO/Primer layer. It Gradual degradation of the primer is indicated.
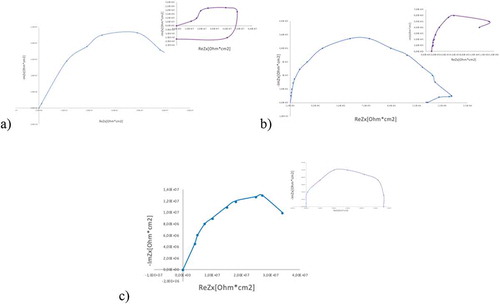
The Nyquist plots () of the samples exhibit a semi-circle or loop after immersion for 1 h and 150 h. The capacitive loop in the high-frequency region and the middle-frequency region relates to the charge transfer process and electrolyte conductivity through the film of corrosion products, respectively. The inductive loop in the low-frequency region relates to local active dissolution of the layer [Citation48,Citation49]. The Mg/PEO Nyquist plots consist of an inductive loop after immersion for 150 h. After 150 h Mg/Primer creates a semi-circle loop. In contrast, Mg/PEO/Primer has only a capacitive loop without an inductive loop, indicating that local corrosion is suppressed.
Figure 11. Nyquist plots of: a) Mg/PEO, b) Mg/Primer, c) Mg/PEO/Primer immersion after 1 h and 150 h
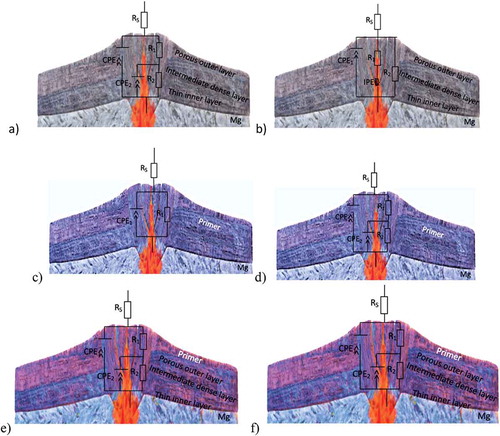
The equivalent circuits () include the following elements: Rs – the resistance of the solution; CPE1and R1 can be correlated to the properties of the coating: the coating capacitance and pore resistance correspond to the time constant observed at higher frequencies related to the formation of pores and defects, and the consequence of electrolyte uptake; CPE2 and R2 are associated with interfacial processes occurring between the surface of the AZ31 magnesium alloy substrate and the applied coating. These interfacial processes include the formation of corrosion products and/or surface oxide/hydroxide layers on the magnesium substrate. IPE is an inductance corresponding to the low-frequency loop.
Figure 12. Equivalent circuit of EIS curves: a), b) Mg/PEO, c), d) Mg/Primer, e), f) Mg/PEO/Primer immersion after 1 h and 150 h
Yao et. al. [Citation50] observed that capacitive arcs are a typical Nyquist plot of many samples with coatings, the high/middle-frequency arcs are related to the EIS signal from the substrate/coating response [Citation50,Citation51]. The capacitive arc diameter can qualitatively present the corrosion resistance. Correspondingly, the capacitive arcs of the Mg/PEO/Primer and Mg/Primer presented the gradually increasing corrosion pits of the coated samples. Meanwhile, as can be seen in the indicated values, the combination of the Mg/PEO/Primer coating shows better compactness and integrity, as well as better corrosion resistance. For the coating, it was shown that the corrosion resistance was better, and thus the susceptibility to corrosion damage was lower. It was also reported by M. Curioni et al. [Citation51] that it can be linked to the cathodic reaction of the hydrogen evolution of Mg corrosion and to the anodic reaction process of Mg corrosion. Herein, it can be believed that the larger values of the Mg/PEO/Primer can be related to its alleviated cathodic reaction of hydrogen evolution and anodic reaction. It can be concluded that the resistance to corrosion damage is better in the Mg/PEO/primer sample.
illustrates the macro- and microscopic view of the surface after 150 h of immersion in NaCl. It can be seen that the Mg/Primer samples ()) are characterized by a surface area of corrosion pits on the whole surface. However, there are numerous corrosion pits on the whole surface of the Mg/PEO sample. The Mg/PEO/primer samples are characterized by the lowest degree of corrosion. It can be caused by the existing epoxy layer and an additional barrier in the form of a PEO (ceramic) layer. The lack of PEO determined the rapid penetration of the electrolyte toward the coating, as noted at the beginning of the test (), hence the corrosion phenomena started in the early hours of immersion, and the penetration remained uniform in the whole organic coating, as corroborated by the shape of the impedance modulus that remained unaltered during the test. This behavior highlighted that the combination of PEO with epoxy resin provided good corrosion resistance in comparison to all the tested samples [Citation51]. According to Carangelo [Citation52], a higher corrosion potential was provided by the epoxy resin deposited on the sample. Summing up, the impedance spectra obtained during the EIS tests indicate progressive coating degradation in contact with an aqueous solution containing chloride ions.
Figure 13. Macro- and microscopic view of: a) Mg/PEO b) Mg/Primer, c) Mg/PEO/Primer after 150 h of immersion in 0.5 M NaCl; SEM
4. Conclusions
In the article the study of corrosion processes based on surface preparation on the Mg alloy in the form of PEO processing and with a primer layer based on sol-gel is presented. The authors carried out analysis of the PEO and performed potentiodynamic tests including determination of the Tafel curves as well as EIS analysis after 1 h and 150 h. Mg/PEO, Mg/Primer and Mg/PEO/Primer samples were used. Macro and microscopic observations indicate the presence of pitting corrosion in the case of each type of sample. In the case of the Mg/Primer samples, corrosion occurs practically on the whole surface area subjected to testing as general and pitting corrosion. Additional protection in the form of primer deposited on the PEO layer gives positive results protecting the Mg alloy for a while. However, the resistance of the PEO layer itself is not equal to the resistance of the version with the applied sol-gel layer, which is quite logical.
Disclosure statement
No potential conflict of interest was reported by the author.
Additional information
Funding
References
- Zhang J, Guo ZX, Pan F, et al. Effect of composition on the microstructure and mechanical properties of Mg-Al-Zn alloys. Mat Sci Eng A. 2007;456:43–55.
- Buling A, Zerrer: J. Increasing the application fields of magnesium by ultraceramic®: corrosion and wear protection by plasma electrolytical oxidation (PEO) of Mg alloys. Surf Coat Techn. 2019;369:142–155.
- Spencer K, Fabijanic D, Zhang: MX. Cold spray of Al-MMC coatings on magnesium alloys for improved corrosion and wear resistance. MSF. 2009;618–619:377–380.
- Lee YL, Chu YR, Li WC, et al. Effect of permanganate concentration on the formation and properties of phosphate/permanganate conversion coating on AZ31 magnesium alloy. Cor Sci. 2013;70:74–81.
- Chong KZ, Shih: TS. Conversion-coating treatment for magnesium alloys by a permanganate–phosphate solution. Mater Chem Phys. 2003;80:191–200.
- Zhang C, Liu B, Yu B, et al. Influence of surface pretreatment on phosphate conversion coating on AZ91 Mg alloy. Surf Coat Technol. 2019;359:414–425.
- Saeia E, Ramezanzadeh B, Amini R, et al. Effects of combined organic and inorganic corrosion inhibitors on the nanostructure cerium- based conversion coating performance on AZ31 magnesium alloy: morphological and corrosion studies. Corr Sci. 2017;127:186–200.
- Gray J, Luan B. Protective coatings on magnesium and its alloys—a critical review J. Alloy Comp. 2002;336:88–113.
- Hassan HE, Kazuhisa A, Hidetaka K. Effect of surface pretreatment by acid pickling on the density of stannate conversion coatings formed on AZ91D magnesium alloy. Surf Coat Technol. 2007;202:532–537.
- Liu Y, Skeldon P, Thompson G, et al. Anodic film growth on an Al–21at. % Mg alloy. Corros Sci. 2002;44:1133–1142.
- Zhang Y, Yan C, Wang F, et al. Study on the environmentally friendly anodizing of AZ91D magnesium alloy. Surf Coat Technol. 2002;161:36.
- Gao H, Tan H, Li J, et al. Synergistic effect of cerium conversion coating and phytic acid conversion coating on AZ31 B magnesium alloy. Surf Coat Technol. 2012;212:32–36.
- Sudagar J, Lian J-S, Chen X-M, et al. High corrosion resistance of electroless Ni-P with chromium-free conversion pre-treatments on AZ91D magnesium alloy. Trans Nonferr Metals Soc China. 2011;21:921–928.
- Liu C, Xin Y, Tian X, et al. Corrosion behavior of AZ91 magnesium alloy treated by plasma immersion ion implantation and deposition in artificial physiological fluids. Thin Solid Films. 2007;516:422–427.
- Zhao Y, Wu G, Lu Q, et al. Improved surface corrosion resistance of WE43 magnesium alloy by dual titanium and oxygen ion implantation. Thin Solid Films. 2013;529:407–411.
- Liu Z, Gao: W. The effect of substrate on the electroless nickel plating of Mg and Mg alloys. Surf Coat Technol. 2006;200:3553–3560.
- Elsentriecy HH, Azumi K, Konno: H. Effect of surface pretreatment by acid pickling on the density of stannate conversion coatings formed on AZ91 D magnesium alloy. Surf Coat Techn. 2007;202:532–537.
- Tu W, Zhu Z, Zhuang X, et al. Effect of frequency on black coating formation on AZ31 magnesium alloy by plasma electrolytic oxidation in aluminate-tungstate electrolyte. Surf CoatTechnol. 2019;372:34–44.
- Zhang R, Shan DY, Chen RS, et al. Effects of electric parameters on properties of anodic coatings formed on magnesium alloys. Mat Chem Phys. 2008;107:356–363.
- Zhang R, Zhang SF, Duo: SW. Influence of phytic acid concentration on coating properties obtained by MAO treatment on magnesium alloys. Appl Surf Sci. 2009;255:7893–7897.
- Atrens A, Song GL, Liu M, et al. Review of recent developments in the field of magnesium corrosion. Adv Eng Mat. 2015;17:400–453.
- Birbilis N, King AD, Thomas S, et al. Evidence for enhanced catalytic activity of magnesium arising from anodic dissolution. Electro Acta. 2014;132:277–283.
- Gholami-Kermanshahi M, Neubert VD, Tavakoli M, et al. Effect of ECAP processing on corrosion behavior and mechanical properties of the ZFW MP magnesium alloy as a biodegradable implant material. Adv Eng Mat. 2018;20:12.
- Kajanek D, Hadzima B, Buhagiar J, et al. Corrosion degradation of AZ31 magnesium alloy coated by plasma electrolytic oxidation. Trans Res Proc. 2019;40:51–58.
- Narayanan TS, Park IS, Lee: MH. Strategies to improve the corrosion resistance of microarc oxidation (MAO) coated magnesium alloys for degradable implants: prospects and challenges. Progr Mat Sci. 2014;60:1–71.
- Fan X, Wang Y, Zou B, et al. Preparation and corrosion resistance of MAO/Ni–P composite coat on Mg alloy. App Surf Sci. 2013;277:272–280.
- Dong K, Song Y, Shan D, et al. Formation mechanism of a self-sealing pore micro-arc oxidation film on AM60 magnesium alloy. Surf Coat Tech. 2015;266:188–196.
- Duan H, Du K, Yan C, et al. Electrochemical corrosion behavior of composite coatings of sealed MAO film on magnesium alloy AZ91D. Electro Acta. 2006;51:2898–2908.
- Bai K, Zhang Y, Fu Z, et al. Fabrication of chitosan/magnesium phosphate composite coating and the in vitro degradation properties of coated magnesium alloy. Mat Let. 2012;73:59–61.
- Song Y, Dong K, Shan D, et al. Investigation of a novel self-sealing pore micro-arc oxidation film on AM60 magnesium alloy. J Mag All. 2013;1:82–87.
- Yue L, Zeng CR, Shao-Kang G, et al. Degradation mechanism of micro-arc oxidation coatings on biodegradable Mg-Ca alloys: the influence of porosity. J Alloys Compd. 2017;695:2464–2476.
- Laleh M, Kargar F, Rouhaghdam: AS. Investigation of rare earth sealing of porous micro-arc oxidation coating formed on AZ91D magnesium alloy. J Rare Earths. 2012;30:1293–1297.
- Zomorodian A, Brusciotti F, Fernandes A, et al. Anti-corrosion performance of a new silane coating for corrosion protection of AZ31 magnesium alloy in Hank’s solution. Surf Coat Technol. 2012;206:4368–4375.
- da Conceicao TF, Scharnagl N, Blawert C, et al. Surface modification of magnesium alloy AZ31 by hydrofluoric acid treatment and its effect on the corrosion behavior. Thin Solid Films. 2010;518:5209–5218.
- Montemor M, Simoes A, Carmezim: M. Characterization of rare-earth conversion films formed on the AZ31 magnesium alloy and its relation with corrosion pro- tection. Appl Surf Sci. 2007;253:6922–6931.
- Zheng-Zheng Y, Wei-Chen Q, Rong-Chang Z, et al. Advances in coatings on biodegradable magnesium alloys. J Magnesium Alloys. 2020;8:42–65.
- Zhanga RF, Zhanga SF, Xianga JH, et al. Influence of sodium silicate concentration on properties of micro arc oxidation coatings formed on AZ91HP magnesium alloys. Surf Coat Techn. 2012;206:5072–5076.
- Zomorodian MPT, Moura E Silva T, Fernandes JCS, et al. Corrosion resistance of a composite polymeric coating applied on biodegradable AZ31 magnesium alloy. Acta Biomater. 2013;9:8660–8670.
- Geels K, Fowler DB, Kopp W-U, et al. Metallographic and materialographic specimen preparation, light microscopy, image analysis, and hardness testing. Vol. 46. ASTM MNL; 2007.
- Dorado-Bustamante K, Zuluaga-Diaz B, Estupinan-Duran: H. Bioactivity analysis of the AZ31 Mg alloy coated by PEO (Plasma Electrolytic oxidation. DYNA. 2018 June;85(205):328–337.
- Song G-L, Atrens: A. Corrosion mechanisms of magnesium alloys. Adv Eng Mater. 1999;1:11–33.
- Makar GL, Kruger: J. Corrosion of magnesium. Int Mater Rev. 1993;38:138–153.
- Feliu S, Llorente: I. Corrosion product layers on magnesium alloys AZ31 and AZ61: surface chemistry and protective ability. Appl Surf Sci. 2015;347:736–746.
- ASTM International West Conshohocken (2007)
- Darband GHB, Aliofkhazraei M, Hamghalam P, et al. Plasma electrolytic oxidation of magnesium and its alloys: mechanism, properties and applications. J Mag Alloys. 2017;5:74–132.
- Shi Z, Liu M, Atrens: A. Measurement of the corrosion rate of magnesium alloys using Tafel extrapolation. Cor Sci. 2010;52:579–588.
- Chen J, Wu L, Ding X, et al. Effects of deformation processes on morphology, microstructure and corrosion resistance of LDHs films on magnesium alloy AZ31. J Mat Sci Technol. 2019 In press. DOI:10.1016/j.jmst.2019.10.007
- Zhang C, Wu L, Huang G, et al. Effect of micro alloyed Ca on the microstructure and corrosion behavior of extruded Mg alloy AZ31. J Alloy Comp. 2020;823. DOI:10.1016/j.jallcom.2020.153844
- Yao C, Lv H, Zhu T, et al. Effect of Mg content on microstructure and corrosion behavior of hot dipped Zn–Al–Mg coatings. J All Comp. 2016;670:239–248.
- Song D, Li C, Liang N, et al. Simultaneously improving corrosion resistance and mechanical properties of a magnesium alloy via equal-channel angular pressing and post water annealing. Mat Des. 2019;166. DOI:10.1016/j.matdes.2019.107621
- Curioni M, Scenini F, Monetta T, et al. Correlation between electrochemical impedance measurements and corrosion rate of magnesium in M. Curioni estimated by real-time hydrogen measurement and optical imaging. Electrochim Acta. 2015;166:372–384.
- Carnagelo A, Acquesta A, Monetta T. In-vitro corrosion of AZ31 magnesium alloys by using a polydopamine coating. Bioact Mater. 2019;4:71–78.