
 ?Mathematical formulae have been encoded as MathML and are displayed in this HTML version using MathJax in order to improve their display. Uncheck the box to turn MathJax off. This feature requires Javascript. Click on a formula to zoom.
ABSTRACT
The cover glass for thin-film transistor liquid crystal display (TFT-LCD) panel is the high aluminum silicate glass. Compared with the conventional soda lime glass, its higher viscosity of glass liquid brought more difficulties in the melting and fining process of mass production. For better fining performance, some oxides that can reduce the viscosity are necessary. In this paper, the fining properties of high aluminum glass batches with and without B2O3 were investigated by CeO2 agent under reduced atmospheric pressure of 1000 mbar, 500 mbar, and 300 mbar. Area Fraction, mean bubble size, number of bubbles and the ascending velocity of bubbles were analyzed quantitatively by high-temperature observation (HTO) system in the fining process. The results showed that B2O3 could efficiently promote the melting and fining process.
1. Introduction
With the development of display technology, new display technology has become one of the main means for people to spread information and knowledge. At present, TFT-LCD has become the mainstream in the international market [Citation1–4]. The main protective material of LCD is the cover glass, mainly owing to its high strength, high scratch, and burst resistance [Citation5–7]. Glass with these properties generally requires high alumina content, which will lead to more difficulties in glass melting and fining process, such as the discharge of bubbles. The existence of bubbles is one of the main defects in glass production [Citation8], it will affect the homogeneity and transparency of glass, as well as the mechanical strength and the thermal stability. The fining agent in the glass batch can vaporize or decompose to oxygen, which can promote the escaping of bubbles in the glass liquid [Citation9]. Furthermore, reducing the viscosity of glass liquid by adding some oxides such as B2O3 can realize the efficient melting and fining. However, the amount of B2O3 should not be too high, because it can make the thermodynamic properties of glass worsen [Citation10]. In addition to the fining agent and reducing viscosity, the reduced atmospheric pressure during the melting and fining process can also promote the escaping of bubbles [Citation11]. Under the condition of reduced pressure, the partial pressure of the gas in the bubble decreases, and the gas remaining in the glass liquid diffuses into the bubble, which makes the bubble grow and ascend to the level faster.
This paper mainly focused on the improvement of the melting and fining process by the substitution of B2O3 for SiO2 in high aluminum silicate cover glass composition. CeO2 was employed for the fining agent and reduced atmospheric pressure was adopted during the process. Area Fraction, mean bubble size, number of bubbles and the ascending velocity of bubbles were analyzed quantitatively by high-temperature observation system to evaluate the melting and fining performance.
2. Experimental
2.1. Materials
The detailed compositions chosen for the experimental were shown in as labeled as A and B. The difference between two samples was the presence of B2O3 for sample B, which was acquired by the substitution of B2O3 for SiO2 for 2% content compared with sample A (wt.%). While all of other oxides were kept for the same. CeO2 was employed as fining agent with 0.5% content. The batch samples were well mixed from reagent grade SiO2, Al2O3,H3BO3, Na2CO3, K2CO3, MgO, and CaCO3.
Table 1. Chemical compositions of high aluminum glasses
Considering some materials could volatilize during the heating process, especially for H3BO3, and the probable reaction between glass melt and silica crucible, chemical analysis was employed for both two samples after the measurement of HTO and viscosity to compare the deviation. As shown in , the measured content of B2O3 for sample B exhibited some deviation from the designed component. And the deviation for other oxides such as Na2O and CaO also showed some deviation mainly affected by the change of B2O3. The deviation between the designed and measured content could be arising from the evaporation of H3BO3 in the batch or the reaction between melt and silica crucible. However, we believed that the deviation as shown in has little effect on the evaluation of the improvement of B2O3 for the melting and fining process discussed in the following paragraph.
2.2. High-temperature viscosity of glass liquid
The high-temperature viscosity of the glass liquid was monitored by rotating viscosity measurement conducted on the Orton RSV-1600 system according to ASTM C965 [Citation12] with the conditions as follows: (1) A platinum alloy rotating spindle was immersed in a 200 ml fixed circular arc platinum crucible of molten glass; (2) The rotation speed of the platinum alloy spindle was between 20RPM and 0.1RPM, changing with the viscosity of glass; (3) The spindle torque was measured and used to calculate viscosity. (4)200 g glass samples prepared according to compositions listed in with particle size of 10–20 mm were employed for the test. The upper limit of test temperature was 1550°C. During the test, the glass sample was heated to 1550°C and held for 0.5 h to make the molten glass reach a stable state. Then, the viscosity change of the glass liquid was recorded during the cooling process. The temperature was reduced to 1200°C and the cooling rate was 2°C/min.
2.3. Surface tension test for glass melt
Surface tension of the glass melt was measured by Sessile Drop method [Citation13] on the GST-1550 system design by Beijing XuHui Xinrui Technology Co., Ltd, including heating system, optical system, imaging system, and image processing and computing system. The scheme of surface tension system was displayed in .
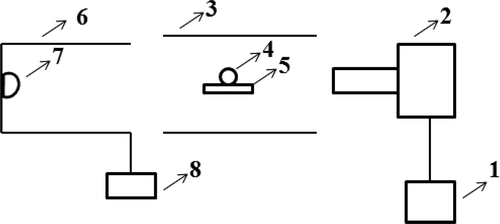
Figure 1. The scheme of surface tension test setup (1 computer, 2 imaging system: high-definition industry camera and webcam, 3 heating furnace, 4 glass sample, 5 supporting board, 6 optical system, 7 lighting source, 8 protecting gas (Ar))
The glass sample with a diameter of about 3 mm starts to soften after being heated in the heating system. The shape is naturally ellipsoidal due to the influence of gravity and surface tension. The optical system projects the outer contour of the sample to the imaging system, and then fits it to get the volume of the droplet. Then, the density, contact angle and surface tension of the glass liquid at high temperature are obtained according to the sample mass weighed in advance in the computing system.
2.4. HTO method description and experimental procedure for the batches
The experiment was operated by the special High-Temperature Observation furnace (HTO) designed by Glass Service,inc, which includes two parts, the high-temperature furnace and the image recording system. The scheme of HTO method used for batch meltingand fining tests was displayed in .
Figure 2. The scheme of the High Temperature Observation (HTO) setup
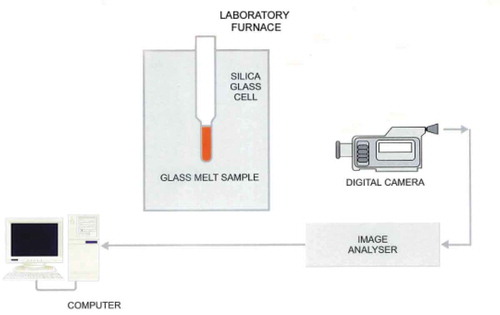
The high-temperature furnace was used for heating glass batch by heating element of molybdenum silicide. And the maximum heating temperature of the furnace was 1600°C. The special-shaped crucible used for the test was transparent observation crucible made of silica glass, with a Φ30 mm×500 mm hollow cylinder in the top for fixing and a 60 mm×40 mm×15 mm hollow cuboid in the bottom for holding the glass batch. And the thickness of the crucible was 3 mm.
The batch sample of about 50 g was placed into the transparent observation crucible made of silica glass. The crucible was then inserted into HTO furnace, which was preheated at a temperature of 500°C. The furnace can be operated up to maximum temperature of 1600°C. Because the silica crucibles used for the testing are getting soft above this temperature, they usually start to deform, which causes the distortion of the recorded images and finally the danger of the glass leak from the crucible. The HTO furnace being used for the testing enabled application of the reduced internal pressure.
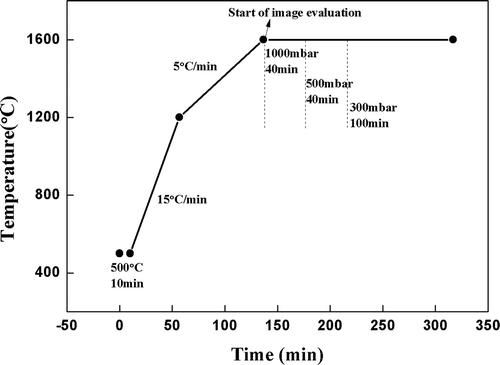
showed the temperature course of the tests. After about 10 minutes of temperature stabilization of the crucible containing the batch at 500°C, the fast heating rate 15°C/min was applied up to the temperature of 1200°C. Above this temperature, the heating rate was reduced to 5°C/min until the maximum testing temperature of 1600°C was reached. The isothermal course at 1600°C was kept afterward for 3 hours for the fining of the glass melt. During the holding time at 1600°C, three levels of the internal furnace pressure inside were applied as follows: (i) First 40 min at approximately ~1000 mbar (ambient atmospheric pressure) until the foam decay and bubble appearance as well distinguishable individual objects at the end of the period. (ii) Next 40 min, application of reduced internal furnace pressure at 500 mbar. (iii) Last 100 minutes, application of reduced internal furnace pressure at 300 mbar until the complete fining of the glass melt. The course of the test between temperatures 500 and 1600°C was recorded every 5 seconds within the time sequence.
Figure 3. The temperature course of the HTO batch tests
The recorded image of HTO test was shown in . The melting and fining evaluation included three parameters, Area Fraction, number of bubbles and mean bubble size.
Figure 4. The recorded image of HTO test
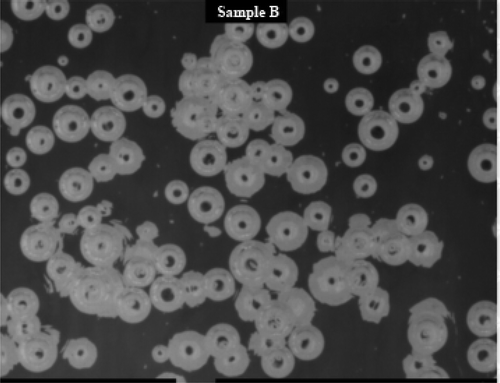
Area Fraction can be expressed as that during the glass fining process, the bubble area accounts for the proportion of the total melting area in the view recorded by the HD camera lens. In the earlier stages, the parameter Area Fraction may also involve undissolved batch grains. In the later stages of the test, it represents mainly non-refined bubbles. This parameter is evaluated by image analysis software and it represents the fraction of the recorded image of the melt free area depending on time and expressed as a percentage. Bubbles are seen as white areas or single objects, while the melt is black (dark). The parameter number of bubbles is evaluated at the recorded images in the later stages of the test, when bubbles became separated objects and the evaluation was therefore possible. And the parameter mean bubble size is the average value of bubbles in the image, and it could be referred as fining ability of the batches because the bubbles with higher mean bubble size ascend to the level faster.
3. Results and discussion
3.1. Viscosity at 1600°C
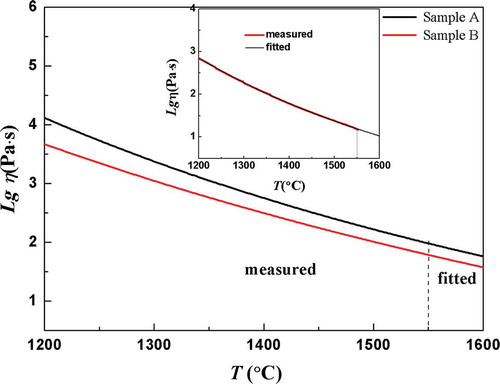
showed the curves of high-temperature viscosity of two samples in the range of 1200 –1600°C, wherein data ranging from 1200°C to 1550°C was the measured value, corresponding to viscosity of 101.5 ~ 103.2 Pa·s, and data in the range of 1550 ~ 1600°C were fitted by the Vogel-Fulcher-Tamman equation [Citation14,Citation15]. For the viscosity at 1600°C, sample A was 101.76Pa·s, and sample B was 101.57Pa·s, which decreased by about 35.4% with 2% substitution of B2O3 for SiO2.
Figure 5. High-temperature viscosity of two samples
Starting from the point, when the temperature of the test reached the final melting temperature 1600°C, selected melting and fining parameters were subsequently evaluated.
3.2. Area fraction
In this paper, CeO2 was used as fining agent. EquationEquation 1(1)
(1) expresses the mechanism of the fining process [Citation16]. Oxygen generated at above 1400°C entered the bubbles. The bubbles then become larger and larger to ascend to the glass liquid level faster.
The redox state of cerium cation will change depending on the melt composition as well as temperature. In this paper, CeO2 was used as fining agent, because of the coloring effect of Ce4+ and Ce3+, the glass sample with 0.5% content used in this paper will appear light yellow. For sample A and sample B, we measured their average transmittance in visible light, which were 90.10% and 90.06%, respectively. There was no significant difference between them, and the final color effect of the samples was similar. Therefore, we thought that the addition of B2O3 had little effect on the valence state conversion of cerium cations.
Estimating from the beginning of the experiment, the first melts in the batch Sample B appeared at about 700°C, while the first melt in the batch Sample A was observed somewhat later at about 770–780°C. Both batches began to melt afterward at the increasing temperature with massive foaming. There was seen from the records that the batch Sample B melts slightly better at the initial stages of the test as compared to the batch Sample A. It finally caused the increased values of the Area Fraction parameter during the entire course of the test of the batch Sample A as compared to the batch Sample B.
The melting and fining courses of both batches expressed as the Area fraction parameters were displayed in . Both curves seemed to have the same character; while the curve representing the batch Sample A was located toward the higher values as mentioned in the paragraph above. The initial period of the holding time at 1600°C could be characterized by the foam decay and appearance of the bubbles as the individual objects. The Area Fraction curve of both batches gradually came down, as clear melt (black areas) appeared in the recorded images. Starting from 40 min of the holding time at 1600°C, the reduced pressure at 500 min was turned on, which evoked a distinct increase of the bubble sizes, which finally caused the rapid increase of the Area fraction parameter of both tested batches. The corresponding curves in came down in a short time again, which could be explained by the faster escaping of the bubbles grown by the application of the reduced pressure. After the hold time 40 min at 1600°C and pressure 500 mbar, the internal furnace pressure was decreased to 300 mbar accordingly, which was accompanied by the additional bubble growth and much faster bubble escaping from the melt. The Area Fraction curves of both batches shortly grew up together with growing bubbles, while both of them comparably quickly dropped down due to bubble removal. The excessive generation of bubbles by the reboil mechanism at the inner crucible walls was observed within the test of the batch Sample A, which explained the slow approximation of the Area Fraction curve to the zero line.
Figure 6. Evaluation of the areas occupied by bubbles (Area Fraction) depending on time for the tested batches
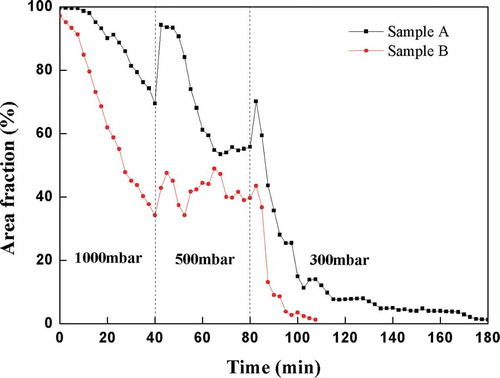
The batch Sample B reached the zero line, which meant in principle no bubbles present in the melt, after about 30 min at pressure 300 mbar and temperature 1600°C, while the batch Sample A needed about 90 min to reach the same status. The bubble reboil played a significant role in the latter case, probably more gases remained dissolved in the glass resulting from the batch Sample A. Some residual undissolved particles-tiny stones, were observed during the final stages of the tests in both batches. The image analysis is not able to distinguish between them and the bubbles, so they were registered as the small seeds, which slightly misrepresent the melting and fining parameters at the final stages of the tests as mentioned in the paragraphs below. The tests apparently showed that the testing temperature of 1600°C was sufficient for efficient fining at the reduced pressure, namely from the point of view of the melt viscosity and assumed content of fining agent, however there should be necessary some additional time or higher temperature (>1600°C) for the dissolution of the residual particles coming from the comparatively finely ground glass batch.
) represented the status of the batch meltingand fining tests after 0 min, 20 min, 40 min (just before pressure application of 500 mbar), 42 min (just after pressure application of 500 mbar), respectively. (a–d) representedthe status of the batch meltingand fining tests after 60 min (500 mbar), 80 min (just before pressure application of 300 mbar), 82 min (just after pressure application of 300 mbar), 90 min (300 mbar), respectively.
Figure 7. The status of the batch melting/fining tests.(a) after 0 min, (b) after 20 min, (c) after 40 min, (d) after 42 min
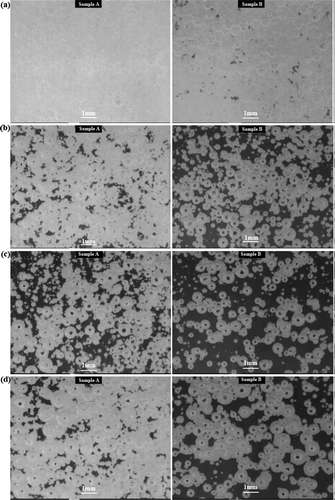
Figure 8. The status of the batch melting/fining tests.(a) after 60 min, (b) after 80 min, (c) after 82 min, (d) after 90 min
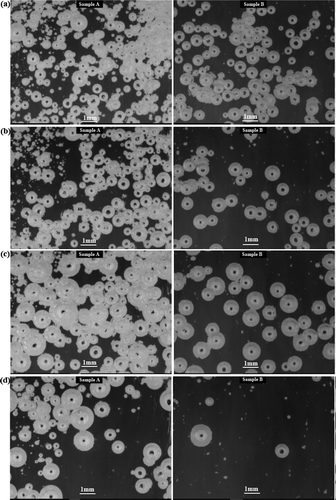
The figures showed the basic difference between melting and fining characteristics of the tested batches described in the previous paragraphs. There was seen from the figures that during the melting course of the batch Sample A, many small bubbles were created, which were difficult for fining at the later stages of the test, regardless of the application of the reduced pressure.
3.3. Number of bubbles
The graphical representation of the bubble number was shown in . The results showed the gradual decrease of the bubble number of both tested batches as the bubbles ascend to the glass level; however, the displayed curve of the batch Sample B was distinctly behind the batch Sample A, which clearly showed the worse fining properties of the batch Sample A without B2O3 as compared to the batch Sample B with B2O3.
Figure 9. The status of the batch melting/fining tests after 110 min
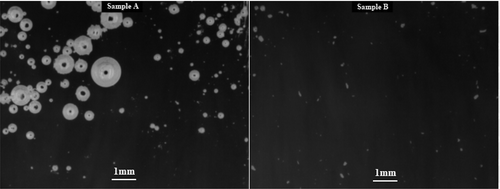
Figure 10. The time development of the number of bubbles during the course of the HTO tests
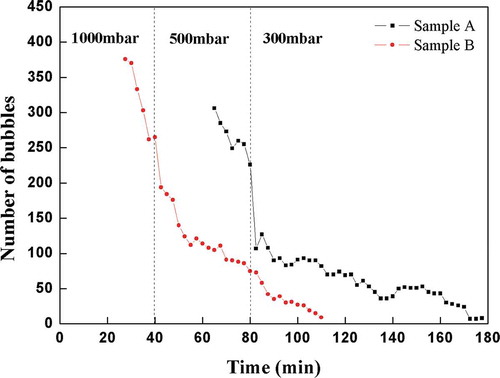
The steep drop on both curves was seen shortly after the points, when the pressure was reduced to 500 mbar or 300 mbar, respectively. The bubbles in the melt suddenly grew after the reduced pressure application, which caused the enhanced bubble escaping from the melt at these points. Subsequently, a new equilibrium was established, so the bubble removal started to slow down accordingly. The drop at the batch Sample B curve at the pressure changing from 500 mbar to 300 mbar was not so distinctive due to a comparably small number of bubbles being actually present in the melt. The number of bubbles in the batch Sample B comparably fastly approximated to zero line after the application of the reduced pressure 300 mbar, while the bubble number curve of the batch Sample A did not, because the generation of the new bubbles by the reboil at the crucible bottom and walls was apparently observed in the later stages of the test, which most likely corresponded with the higher level of the dissolved gases in the batch Sample A melt.
3.4. Development of mean bubble sizes during the course of the test
The fining ability of the tested batches should be better with higher mean bubble size, because the bubbles ascended to the level faster. The graphical representation of the mean bubble size was shown in . The mean bubble size curves of the batch Sample A and the batch Sample B were in accordance with above described melting and fining parameters. The steep increase on both curves was seen shortly after the point(s), when the pressure was reduced to 500 mbar or 300 mbar, respectively. The bubbles in the melt suddenly grew after the reduced pressure application. The mean bubble sizes of the batch Sample B were much higher during the application of the reduced pressure 500 mbar as compared to the batch Sample A; the bubbles grew faster there, so their fining was more efficient at 500 mbar. The mean bubble sizes of the batch Sample B at 1000 mbar seemed to be comparable to those ones in the batch Sample A at 500 mbar, which corresponded to the worse fining properties of the batch Sample A as already mentioned above.
Figure 11. The time development of the mean bubble sizes during the course of The HTO tests
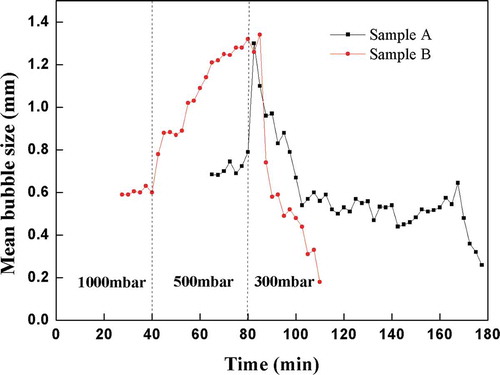
The mean bubble size curve of the batch Sample B steeply increased after application of the reduced pressure of 300 mbar above the batch Sample A again, however it fastly decreased afterward, because the small bubbles or namely small undissolved batch particles shortly remained in the batch Sample B melt only (see ).
The evaluated curve of the batch Sample A approximated to the zero line much slowly after the steep increase at the application of the reduced pressure of 300 mbar, namely due to reboiling of the new bubbles apparently generated at the bottom and at the walls of the silica testing crucible, as seen in . Sample B showed much better melting and fining properties.
3.5. Ascending velocity of bubbles
The mean ascending velocity of bubbles can be expressed as Equationequation (2)(2)
(2) [Citation17]
where is the Mean Ascending velocity of bubbles, R is mean bubble size, ρgl is the density of glass liquid at 1600°C, and η is the viscosity of glass liquid at 1600°C. showed the comparison of the mean ascending velocity of bubbles of two batches with the same bubble size 0.5 mm. There was some deviation between the theoretical value according to Equationequation (2)
(2)
(2) and the measured value ν0 based on the real bubble with the radius around 0.50 mm. But sample B still showed better-fining property than sample A with the ascending velocity of bubbles increasing by about 40%~50% according to
and ν0.
Table 2. Ascending velocity of bubbles
The upper limit for the test of surface tension was 1550°C. By testing the density and surface tension of every 50°C in the range of 1200°C ~ 1550°C, we could fit the density and surface tension of 1600°C shown in .
Surface tension of the batch Sample B was 344.23mN/m at 1600°C, which was lower than batch Sample A of 355.62mN/m. This indicated that the introduction of B2O3 reduces the surface tension of the glass melt, which would also contribute to the elimination of bubbles in the glass melt.
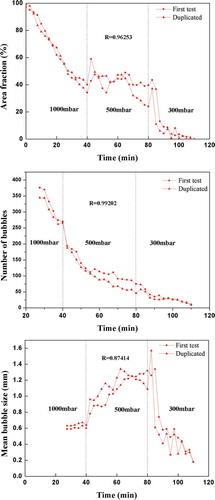
3.6. Reproducibility of HTO test
In order to investigate the reproducibility of the HTO testing, the batch Sample B with 2% B2O3 was handled with duplicated test. showed the correlation coefficients R of two results for Area Fraction, number of bubbles, and mean bubble size. Though some deviation was observed especially for mean bubble size, quite good reproducibility of the tendency with time and reduced pressure could be obviously found from .
Figure 12. Reproducibility test for sample B
4. Conclusion
The melting and fining properties of the batch Sample with and without B2O3 were investigated at the melting temperature of 1600°C at three levels of the reduced pressure, 1000 mbar, 500 mbar, and 300 mbar, respectively. The evaluation of the melting and fining parameters generally indicated the better melting and fining performance for the batch sample with 2% B2O3, which could be attributed to its lower viscosity at 1600°C. The quantitative results from HTO are as follows:
(1) To reach the zero line of the Area Fraction and number of bubbles parameters, the batch with 2% B2O3 needed for about 40 min at a pressure 1000 mbar, 40 min at a pressure 500 mbar and 30 min at a pressure 300 mbar altogether, which took less time of about 60 min than the batch without B2O3.
(2) Mean bubble size of the batch with 2% B2O3 increased with time, and under 500 mbar reduced pressure mean bubble size was in the range of 0.6 ~ 1.3 mm, which was larger than the batch without B2O3.
(3) The single ascending velocity of bubbles with 0.5 mm radius for the batch with 2% B2O3 was about 140.38 mm⋅h−1, increasing by about 40%~50% compared with the batch without B2O3.
(4) The HTO test showed good reproducibility for Area Fraction, number of bubbles and mean bubble size.
Authors’ contributions. J.D.C. designed the study, performed the laboratory experiments and wrote the manuscript. L.F.S. and Z.J.Z. assisted in analyzing experimental data. X.C. assisted in editing the manuscript for important intellectual content, and gave the final approval for publication. P.P.W. and L.J.W were responsible for the revision of the article language.
Disclosure statement
The authors declare that they have no known competing financial interests or personal relationships that could have appeared to influence the work reported in this paper.
Additional information
Funding
References
- Howard WE. Thin-film-transistor/liquid crystal display technology-an introduction. Ibm J Res Dev. 1992;36(1):3–10.
- Ellison A, Cornejo IA. Glass substrates for liquid crystal displays. Int J Appl Glass Sci. 2010;1(1):87–103.
- Liu C. Revolution of the TFT LCD technology. J Disp Technol. 2017;13:342–350.
- Oana Y. Current and future technology of low-temperature poly-Si TFT-LCDs. J Soc Inf Display. 2012;9(3):169–172.
- Price JJ, Glaesemann GS, Clark DA, et al. 69.3: A mechanics framework for ion-exchanged cover glass with a deep compression layer. SID Symp Dig Tech Pap. 2012;40(1):1049–1051. .
- Borrelli NF, Trotter JD, Fehlner FP, inventor; Corning Inc., assignee. Cover glass for LCD panel. European patent EP 0,615,150. 1994 Sep 14.
- Teramoto H, Morii Y, Mori A, et al. 48.2: cover glass strength design for industrial use PCAP LCD module. SID Symp Dig Tech Pap. 2015;45(1):690–691.
- Mller H, Strubel C, Bange K. Characterization and identification of local defects in glass. Scanning. 2010;23(1):14–23.
- Mills HN Use of Fining Agents. Proceedings of the 46th Conference on Glass Problems: Ceramic Engineering and Science Proceedings, University of Illinois at Urbana-Champaign: Urbana, USA. 1986;7:404–409.
- Araujo R. Influence of boron-oxygen bonding on glass properties. J Non Cryst Solids. 1997;222:25–32.
- Shinji T, Chikao T, Kazuhiko I, et al. inventor; Asahi Glass Co Ltd., assignee. Method and apparatus for refining molten glass under reduced pressure. European patent EP 0,939,058. 2008 Aug 6.
- American Society of Testing Materials (ASTM). Standard practice for measuring viscosity of glass above the softening point. West Conshohocken: ASTM; 2017. Standard No. C965-96(2017).
- Tian Y, Guo S, Wu D. The study on measurement method of glass melts’ surface tension at high temperature. Adv Mater Res. 2014;889-890:732–736.
- Scherer GW. Editorial comments on a paper by Gordon S. Fulcher J Am Ceram Soc. 2010;75(5):1060–1062.
- Vogel H. The law of the relationship between viscosity of liquids and the temperature. Phys Z. 1921;22:645–646.
- Sohn S, Choi S, Lee Y. Controlled crystallization and characterization of cordierite glass-ceramics for magnetic memory disk substrate. J Mater Sci. 2000;35(19):4815–4821.
- Ramos JI. Lumped models of gas bubbles in thermal gradients. Appl Math Model. 1997;21(6):371–386.