
ABSTRACT
Novel cube-shaped nanocrystals of BaTiO3 (BT) surrounded by CaTiO3 (CT) that can be used for piezo-driven energy harvesters were synthesized using a one-step hydrothermal reaction with surfactant and additives at 250°C for 24 h. The size distribution of the nanocubes (NCs) was narrow, with an approximate average size of 50 ~ 60 nm. The nanocubes had a core-shell configuration, such that the Pbnm structured CT shell was grown on a P4mm structured BT core by sharing corresponding [001] directions. STEM-EDX and EELS indicated that Ba ions did not diffuse into the CT shell region. Piezoelectric hysteresis loops of BT/CT NCs were obtained by piezoresponse force microscopy.
1. Introduction
Energy harvesting systems are attracting attention because Internet of Things (IoT), sensing systems, wearables, and implantable devices are proliferating [Citation1–3]. Of particular interest are piezoelectric-driven energy harvesters, which have high efficiency in mechanical-to-electrical energy conversion [Citation4–6]. Pb(Zr,Ti)O3 (PZT) has a high piezoelectric coefficient and a high electromechanical coupling constant originating from the nanosized ordering regions of three different crystallographic phases – the ferroelectric tetragonal phase, the rhombohedral phase, and the interface, the so-called morphotropic phase boundary (MPB) [Citation7–9]. However, as lead-based materials are harmful to the environment, investigation of high-performance lead-free piezoelectrics should be prioritized. (Ba,Ca)TiO3-Ba(Zr,Ti)O3 (BCT-BZT) and niobite-based ceramics are candidates for lead-free piezoelectrics [Citation10–12]. Of late, a designed interface that enhances electrical properties has attracted great attention. BaTiO3/KNbO3 composite ceramics with heteroepitaxial interfaces possess enhanced dielectric and piezoelectric properties [Citation13]. Heteroepitaxial interfaces, known as structure gradient regions (SGR), induce a strain in the material causing their dielectric and piezoelectric properties to be enhanced. This suggests that SGR plays a role similar to MPB when the size of SGR reduces. BaTiO3/CaTiO3 (BT/CT) nanocomposites synthesized by solvothermal reaction were also investigated [Citation14]. Heterointerfaces have an enhanced d33 value approximately 5 times that of BT nanoparticles. Ferroelectric/paraelectric BT/SrTiO3 core-shell structured materials having a negative capacitance were reported by Wang et al. [Citation15]. Heterostructures have attracted much attention to lead the novel properties. However, such a nanocomposite is typically fabricated by a multi-step process, and controlling its nanostructure is a challenge. The synthesis of shape-controlled nanocrystals with heteroepitaxial interfaces in a one-step is necessary for mass production. On the other hand, nanosized materials with high performance also need to be developed because devices are progressively becoming smaller. Nanocrystals whose size and shape are well-controlled have advantages such as anisotropy, large surface area, and 3D ordered assembly with high packing density and orientation [Citation16–18]. We have already reported that 3D assemblies of 15 nm BT nanocube have a high dielectric constant (above 4000) due to the strain induced by interfaces between nanocubes [Citation19–21]. Control and design of interfaces is necessary to enhance dielectric and piezoelectric properties. In this study, ferroelectric tetragonal BT core nanocrystal surrounded by paraelectric orthorhombic CT with heterointerfaces in each nanocube was synthesized by a one-step hydrothermal reaction with surfactant. The heterointerfaces were observed by high-resolution scanning transmission electron microscopy (STEM). Piezoresponse of BT/CT nanocubes was also investigated by piezoresponse force microscopy (PFM).
2. Experimental procedure
Barium acetate (Ba(OCOCH3)2, FUJIFILM Wako Pure Chemical Corporation), calcium acetate monohydrate (Ca(OCOCH3)2‧H2O, FUJIFILM Wako Pure Chemical Corporation), titanium ammonium lactate hydroxide (TALH, Sigma-Aldrich Japan), sodium hydroxide (NaOH, FUJIFILM Wako Pure Chemical Corporation), tert-butylamine (Sigma-Aldrich Japan), and oleic acid (FUJIFILM Wako Pure Chemical Corporation) were chosen as the starting materials, additives, and surfactants, respectively. The molar ratio of Ba/Ca was 70/30. We referred to our previous research of BT NCs [Citation19] to decide the molar ratio and amount of raw materials and additives as follows: 1.05 mmol of Ba(OCOCH3)2 and 0.45 mmol of Ca(OCOCH3)2‧H2O were dissolved in 22.8 ml of distilled water in a Teflon vessel. 1.5 mmol of TALH was added to the solution with stirring. 7.2 ml of NaOH 5 M aqueous solution, 1.92 ml of tert-butylamine, and 5.7 ml of oleic acid were added to the solution, continuously. The vessel was moved into an autoclave and maintained at 220–250°C, for 12–72 h with stirring. White slurry was washed by ethanol and dispersed in toluene using ultrasonication. The crystallographic phase of BT/CT NC powders was investigated by using X-ray powder diffraction (XRD, RIGAKU, SmartLab). Drop-and-dry process of the dispersion was carried out on the substrates or the grids to measure the microstructures using a scanning electron microscope (SEM, JEOL, JSM-6335FM), a scanning transmission electron microscope (STEM, JEOL, JEM-ARM200FC with a spherical aberration corrector (Cs corrector, CEOS), operated at 120 eV), an energy dispersive X-ray spectroscope (EDX, JEOL, JED-2300) and an electron energy loss spectroscope (EELS, Gatan, a JEM-ARM200F-based microscope equipped with a delta Cs corrector operated at 60 kV and a low-voltage complementary metal-oxide-semiconductor (CMOS) camera with a 5 mm EELS entrance aperture). A Wiener filter was used for atomic-resolution EDX mapping. Crystal structure of BT/CT NC was produced by using a commercially available software (CrystalMaker Software Ltd., CrystalMaker X). Piezoresponses of BT/CT NCs were evaluated by PFM with dual AC resonance tracking mode (DART-PFM, Asylum Research, MFP-3D) using conductive cantilever (ASYELEC-01, force constant: 2 N/m, resonance frequency: 70 kHz, and tip radius: 28 ± 10 nm) [Citation22]. Capillary force assisted self-assembly at the liquid–air interface was used to prepare BT/CT NC assemblies for PFM measurements [Citation23]. The BT/CT NC assemblies were dried at room temperature, and then UV-irradiated and dried at 200°C before taking PFM measurement to remove organic compounds from the surface of the NCs.
3. Results and discussion
3.1. Microstructure and formation mechanism of BT/CT NCs
SEM images of BT/CT NCs synthesized by hydrothermal reaction under various conditions are shown in . Synthesis conditions greatly influenced the morphologies of reaction products. Cube-shaped nanocrystals could only be found in some synthesis conditions (–)). Irregularly shaped fine nanoparticles less than 10 nm in a size were also identified in a full field of view ()) and the encircled areas in and ). The amounts of fine nanoparticles decreased with increasing synthesis temperature and time. Nanoparticle formation was not observed at 240°C and 250°C for 24 h ( and )). The average size of BT/CT NCs was approximately 50 ~ 60 nm in and ). We also investigated the effects of tert-butylamine and oleic acid on the formation of nanocubes. When both tert-butylamine and oleic acid were not added to the solution, irregularly shaped crystals were obtained as shown in ). Large particles, over 100 nm in size, with a wide size distribution were obtained. Moreover, it was found that the addition of tert-butylamine ()) was similar to not adding tert-butylamine and oleic acid ()). On the other hand, a few nanocubes were formed in gel matrix when only oleic acid was used, as shown in ). The irregularly shaped large particles and small nanocubes in gel matrix, as shown in –), were identified as BT by STEM-EDX and XRD. shows a powder XRD pattern of BT/CT NCs synthesized at 240°C and 250°C for 24 h. Diffraction patterns corresponding to BaTiO3 and CaTiO3 were clearly observed, as in ). BaCO3 as a by-product was detected in ). CO2 existing in the air usually dissolves in water thus gives rise to CO32- ions. CO32- and residual Ba2+ can form BaCO3 in hydrothermal reaction easily. BaCO3 disappeared with increasing synthesis temperature. It has been reported in a previous study of hydrothermal synthesis of BaTiO3 nanoparticles that a higher reaction temperature and longer reaction time tend to decrease the concentration of BaCO3 [Citation24]. This tendency is in good agreement with our result of BT/CT NCs. By comparing with SEM results, a possible deduction is that the fine nanoparticles comprise BaCO3 coming from the residual Ba source, which is unreacted at low synthesis temperature and a short reaction time.
Figure 1. SEM images of BT/CT NC powders synthesized by hydrothermal reaction at various conditions. (a) 220°C for 72 h, (b) 230°C for 72 h, (c) 240°C for 12 h, (d) 240°C for 24 h, (e) 250°C for 24 h, (f) 240°C for 24 h without tert-butylamine and oleic acid, (g) 240°C for 24 h without tert-butylamine, (h) 240°C for 24 h without oleic acid. Irregularly shaped fine particles less than 10 nm were observed in a full field of view (a) and the encircled areas in (b) and (c)
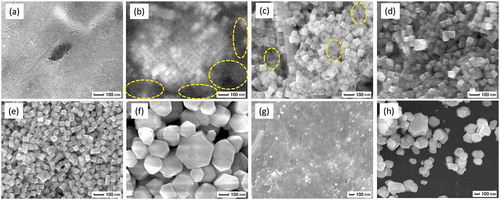
Figure 2. XRD patterns of BT/CT NC powders synthesized at (a) 240°C for 24 h, (b) 250°C for 24 h
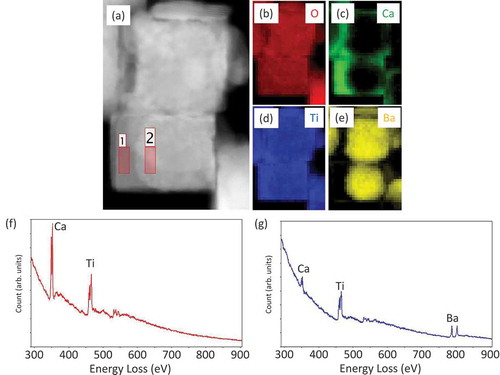
The atomic structures of cubic nanocrystals are investigated by using a Cs-corrected scanning transmission electron microscopy (STEM). A sub-angstrom-sized probe has realized both EELS and EDS atomic level elemental mappings [Citation25–27]. STEM-EDS analyses shown in demonstrate a particular core-shell configuration of BT/CT NCs with a cubic peripheral CT shell enclosing an irregular-shaped BT core. Crystal structures of both CT shell and BT cores can be deduced from the high-angle annular dark-field (HAADF)-STEM images and their corresponding fast Fourier transformed (FFT) patterns, as shown in (a– ). ) shows a HAADF-STEM image indicating specific orientation relationships existing between the CT shell and BT core. The space groups of BT core and CT shell were determined to be P4mm and Pbnm, respectively. The FFT patterns corresponding to BT core and CT shell ( and )) can be indexed by using the as-known lattice parameters of BaTiO3 (P4mm, a = 0.39988 nm, c = 0.40222 nm) and CaTiO3 (Pbnm, a = 0.538 nm, b = 0.544 nm, c = 0.7639 nm) crystals [Citation28,Citation29]. The indexes show that (100) of the CT shell is grown on {110} of the BT core, and <001> of the BT core and CT shell are in the same direction. This result suggests the BT and CT have heteroepitaxial relation, as schematically shown in ). The HAADF-STEM image (distortion minimized by summarizing 6 frames of fast scanned (5 μs/pixel) HAADF-STEM series images after drift compensation) in ) illustrates subtle differences between the interplanar distances in the CT shell (area 1) and the BT core (area 3). An average diameter of the BT core particle is approximately 30 ~ 40 nm. However, the thickness of the shell is ununiform as shown in ). A typical thickness of the CT shell is about 10 nm. It is assumed that Ti atoms in the CT shell would occupy approximately the same atomic positions as those in the BT core, while Ca atoms would substitute Ba atoms in this special heterostructure. Because there are discrepancies in BT and CT lattice parameters along with epitaxial directions, a few misalignments of Ti atoms in the interface of BT core and CT shell can be observed. A HAADF-STEM image of a BT/CT NC with atomic-scale resolution shown in ) demonstrates such misalignments of Ti atom columns, indicated by yellow (BT core) and green (CT shell) dot lines near BT/CT interface. An atomic-scale EDX mapping of Ti taken from the same area shown in ) also illustrates the misalignment of Ti atom columns. BT and CT areas far away from their interfaces have been demonstrated to have different crystal structures. It can be deduced the strain caused by different lattice parameters between BT and CT is relaxed in the vicinity of their interface region, although the actual interface plane cannot be identified since BT and CT are overlapped at their uneven interfaces in any projected direction. Misalignment of atom columns due to lattice parameter discrepancies in heterostructures might induce local strains in the interface region that can affect their dielectric and piezoelectric properties. In order to confirm a diffusion of Ba into the CT layer, we performed EELS analyses because the TiKα and BaLα peaks in the EDX spectra partly overlap. shows a STEM image of BT/CT NCs and the corresponding EELS chemical mappings of O, Ca, Ti, and Ba (–e)). The EEL spectra (f) and (g) are examined from the areas labeled by 1 and 2 in ), respectively. Ba was only detected in the core region, as shown in ). This result indicated that Ba did not diffuse into the shell CT region. Another important piece of information that can be obtained from EELS analyses is that the intensity of Ca L-edge peak is lower in the core region ()) than in the shell region ()). The EELS results also confirm the core-shell structure of BT/CT NC.
Figure 3. (a) HAADF-STEM image of BT/CT NC. (b) Ba, (c) Ca, (d) Ti, of EDX elemental mapping images of (a). (e) Graphic overlay of (b)-(d)
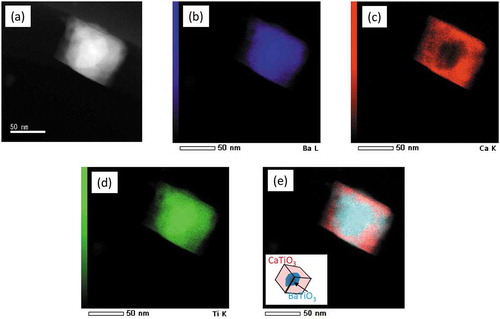
Figure 4. (a) HAADF-STEM image and FFT patterns of BT/CT NC, and FFT patterns of (b) core and (c) shell part of (a). (d) Schematic illustration of BT/CT NC with heterointerfaces of <110> BT//<100> CT.
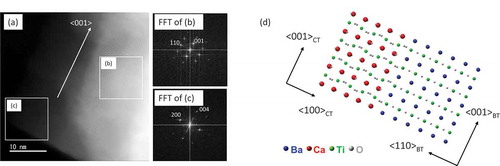
Figure 5. (a) HAADF-STEM images of BT/CT NC with atomic-resolution images of area 1, 2, and 3. (b) HAADF-STEM image and atomic-scale EDX map (Winer filtered) of heterointerface of BT/CT NCs shown in RGB color. Ca: red; Ba: blue; Ti: green. Ti columns were marked by green and yellow dashed lines in upper image of (b). Misalignment of Ti columns were observed at encircled area of (b)
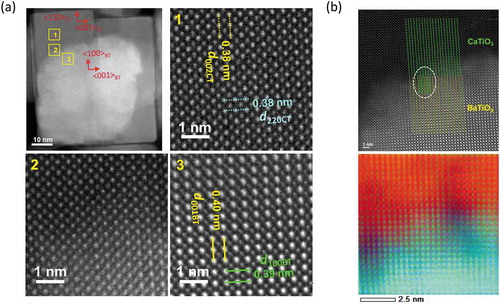
Figure 6. STEM-EELS images of BT/CT NCs (a) STEM image, (b) O, (c) Ca, (d) Ti, and (e) Ba mapping of (a). (f), (g) EELS spectra taken from area 1 and 2 in image (a), respectively
The formation mechanism of a nanocube with a BT/CT heterointerface was considered to be based on the significant difference of degree of ionization between Ba2+ and Ca2+ in a basic solution. Ba2+ is stable in a basic solution, but Ca2+ precipitates as hydroxides in it. When NaOHaq was added to the solution to accelerate the formation of the perovskite structure, Ba2+ remained in the solution but Ca(OH)2 formed a precipitate. Our previous study has stated that TALH was hydrolyzed by OH− and formed the Ti-O gel consisting of a TiO6 octahedron framework in the solution. Also, A-site cations (in this study, Ba2+ and Ca2+) and Ti-O gel crystallize into the perovskite structure under the hydrothermal condition [Citation18]. Thus, we considered that Ca(OH)2 should be ionized into the solution in order to form the perovskite structure. Therefore, nucleation of BT initially occurred under the Ca2+ segregation in hydrothermal synthesis, and then, BT nanocrystals were grown and Ca2+ ionization occurred gradually. Finally, the CT shell layer was epitaxially grown on BT nanocrystals. On the other hand, cuboid CT nanoparticles were reported by several groups [Citation30,Citation31]. CT becomes easily faceted into crystals through a hydrothermal reaction without surfactants or additives. However, control of crystal growth is difficult; CT has a tendency of growing into large particles. In this study, oleic acid, which preferentially coordinated {100}, {010} and {001} facets of CT, enabled control of cubic shape and size homogeneity. When oleic acid was not added to the precursor solution, crystal growth of BT was too fast to control the size, shape, and crystal growth of the CT shell on the BT nanocrystal, as shown in and ). It was also reported in our previous work that tert-butylamine was necessary to promote the coordination of oleic acid into facets [Citation19]. Further investigation is necessary to understand the formation mechanism of BT/CT NCs.
3.2. Piezoelectric properties of BT/CT NCs
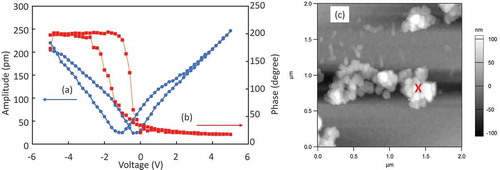
and b) show phase vs. voltage and amplitude vs. voltage loops of BT/CT NCs placed on Pt/Si substrate with DC bias from −5 to 5 V. Piezoelectric hysteresis loops of displacement and phase were observed. It should be noted that the phase was switched 180 degrees by sweeping DC bias from −5 to 5 V. This result means that BT/CT NCs had ferroelectricity. Coercive voltage was approximately 0.5 V. As CT is a paraelectric material, it shows no piezoresponse. It might be thought that piezoresponse decreases in BT/CT core-shell structure because CT shell, which does not have piezoelectricity, connects to BT-core in series. However, in this study, the piezoresponses of BT/CT NCs were clearly obtained. Moreover, Hu et al. [Citation14] also found an increment of 2–5 times in piezoresponse of BT/CT nanocomposite compared to that of BT. It suggested that the strain induced by heterointerfaces expressed the piezoelectric property. Since quantitative analysis by PFM is difficult owing to extrinsic effects such as electrostatics, etc., we are planning on measuring piezoelectric properties by another method to ensure the quantitative analysis. On the other hand, as dispersibility of BT/CT NCs to organic solvent was very low and size distribution was wider compared with that of BT NCs reported in our previous study, they aggregated on the substrate without ordering as shown in the topography of BT/CT NC assembly ()). In addition, the orientation of BT/CT NCs could not be controlled. The orientation of NCs was important to enhance the piezoelectric property. Improvement of dispersibility of BT/CT NCs, further investigation of assembly in order, and control of strain at the interfaces, are necessary for enhancing piezoelectric properties in future work.
Figure 7. DART-PFM curves of BT/CT NCs synthesized at 250°C for 24 h (average of 10 times repetition). (a) Amplitude vs. voltage and (b) phase vs. voltage with DC bias. (c) Topography of BT/CT NC aggregations. A mark (X) showed the measurement point of (a) and (b)
4. Conclusions
In this work, novel BT/CT nanocubes were synthesized using a one-step hydrothermal reaction with surfactant and additives. The threshold temperature to form BT/CT NCs was 230°C. Increasing synthesis temperature led to a decrease in irregular-shaped fine nanocrystals, which might be attributed to unreacted BaCO3. It was confirmed by STEM-EDX observations that the CT shell and BT core have their <001> axes pointing in a parallel direction, while [110]BT//[100]CT. The EELS spectra showed that Ba did not diffuse into CT layers. Piezoelectric hysteresis loop was observed by PFM measurement. It suggests that BT/CT heterointerfaces contribute to the piezoresponse.
Disclosure statement
No potential conflict of interest was reported by the authors.
Additional information
Funding
References
- Beeby PS, Tudor MJ, White NM. Energy harvesting vibration sources for microsystems. Meas Sci Technol. 2006;17:R175–R195.
- Roundy S, Wright PK, Rabaey J. A study of low level vibrations as a power source for wireless sensor nodes. Comput Commun. 2003;26: 1131–1144.
- Morimoto K, Kanno I, Wasa K, et al. High-efficiency piezoelectric energy harvesters of c-axis-oriented epitaxial PZT films transferred inti stainless steel cantilevers. Sens Actuators A. 2010;163:428–432.
- Chang C, Tranm VH, Wang J, et al. Direct-write piezoelectric polymeric nanogenerator with high energy conversion efficiency. Nano Lett. 2010;10:726–731.
- Priya S. Advances in energy harvesting using low profile piezoelectric transducers. J Electroceram. 2007;19:165–182.
- Yoshimura T, Murakami S, Wakazono K, et al. Piezoelectric vibrational energy harvester using lead-free ferroelectric BiFeO3 films. Appl Phys Express. 2013;6:051501.
- Noheda B, Gonzalo JA, Cross LE, et al. Tetragonal-to-monoclinic phase transition in a ferroelectric perovskite: the structure of PbZr0.52Ti0.48O3. Phys Rev B. 2000;61:8687–8695.
- Mishra SK, Pandey D, Singh AP. Effect of phase coexistence at morphotropic phase boundary on the properties of Pb(ZrxTi1-x)O3 ceramics. Appl Phys Lett. 1996;69:1707–1709.
- Oh SH, Jang HM. Enhanced thermodynamic stability of tetragonal-phase field in epitaxial Pb(Zr,Ti)O3 thin films under a two-dimensional compressive stress. Appl Phys Lett. 1998;72:1457–1459.
- Shrout TR, Zhang SJ. Lead-free piezoelectric ceramics: alternatives for PZT? J Electroceram. 2007;19:111–124.
- Li J-F, Wang K, Zhu F-Y, et al. (K, Na)NbO3-based lead-free piezoceramics: fundamental aspects, processing technologies, and remaining challenges. J Am Ceram Soc. 2013;96:3677–3696.
- Liu W, Ren X. Large piezoelectric effect in Pb-free ceramics. Phys Rev Lett. 2009;103:257602.
- Ueno S, Kawashima H, Nakashima K, et al. Solvothermal preparation of potassium niobate/barium titanate nanocomplex ceramics with three dimensional network-configuration of structure-gradient region and their dielectric properties. J Appl Phys. 2013;114:074103.
- Hu D, Niu X, Ma H, et al. Topological relations and piezoelectric responses of crystal-axis-oriented BaTiO3/CaTiO3 nanocomposites. RSC Adv. 2017;7:30807–30814.
- Wang Z, Li H, Hu H, et al. Direct observation of stable negative capacitance in SrTiO3@BaTiO3 heterostructure. Adv Electron Mater. 2019;1901005-1-5.
- Zhang J, Kumbjar A, He J, et al. Simple cubic super crystals containing PbTe nanocubes and their core-shell building blocks. J Am Chem Soc. 2008;130:15203–15209.
- Dang F, Kato K, Imai H, et al. Characteristics of CeO2 nanocubes and related polyhedra prepared by using a liquid-liquid interface. Cryst Growth Des. 2010;10:4537–4541.
- Zhang J, Kumagai H, Yamamura K, et al. Extra-low-temperature oxygen storage capacity of CeO2 nanocrystals with cubic facets. Nano Lett. 2011;11:361–364.
- Dang F, Mimura K, Kato K, et al. In situ growth BaTiO3 nanocubes and their superlattice from an aqueous process. Nanoscale. 2012;4:1344–1349.
- Mimura K, Kato K. Dielectric properties of barium titanate nanocube ordered assembly sintered at various temperatures. Jpn J Appl Phys. 2014;53:09PA03.
- Mimura K, Kato K. Enhanced dielectric properties of BaTiO3 nanocube assembled film in metal–insulator–metal capacitor structure. Appl Phys Express. 2014;7:061501.
- Gannepalli A, Yablon DG, Tsou AH, et al. Corrigendum: mapping nanoscale elasticity and dissipation using dual frequency contact resonance AFM. Nanotechnology. 2011;22:355705.
- Itasaka H, Mimura K, Extra Surfactant-Assisted KK. Self-assembly of highly ordered monolayers of BaTiO3 nanocubes at the air—water interface. Nanomaterials. 2018;8:739.
- Chen K-Y, Chen Y-W. Preparation of barium titanate ultrafine particles from rutile titania by a hydrothermal conversion. Powder Technol. 2004;141:69.
- Liu Z, Suenaga K, Wang Z, et al. Identification of active atomic defects in a monolayered tungsten disulphide nanoribbon. Nat Comm. 2011;2:213.
- Du H, Jia C-L, Mayer J. Local crystallographic shear structures in a [201] extended mixed dislocations of SrTiO3 unraveled by atomic-scale imaging using transmission electron microscopy and spectroscopy. Faraday Discuss. 2019;213:245–258.
- Egoavil R, Hühn S, Jubgbauer M, et al. Phase problem in the B-site ordering of La2CoMnO6: impact on structure and magnetism. Nanoscale. 2015;7:9835–9843.
- Xiao CJ, Jin CQ, Wang XH. Crystal structure of dense nanocrystalline BaTiO3 ceramics. Mater Chem Phys. 2008;111:209–212.
- Liu X, Liebermann RC. X-ray powder diffraction study of CaTiO3 perovskite at high temperatures. Phys Chem Miner. 1993;20: 171–175.
- Lin J, Hu J, Qiu C, et al. In situ hydrothermal etching fabrication of CaTiO3 on TiO2 nanosheets with heterojunction effects to enhance CO2 adsorption and photocatalytic reduction. Catal Sci Technol. 2019;9:336–346.
- Chen T, Bao L, Zheng Y, et al. Hydrothermal synthesis of perovskite CaTiO3 tetragonal microrods with vertical V-type holes along the [010] direction. CrystEngComm. 2019;21:4763–4770.