
 ?Mathematical formulae have been encoded as MathML and are displayed in this HTML version using MathJax in order to improve their display. Uncheck the box to turn MathJax off. This feature requires Javascript. Click on a formula to zoom.
ABSTRACT
In this study, hydroxyapatite powder Ca10(PO4)6(OH)2 (HAp) doped with gadolinium (Gd3+) (HAp:Gd3+) in different mole percentage of between 0.1 and 1.6 was synthesized by sol−gel method at 900°C. The reaction was carried out by hydrolysis of Ca(OH)2 and DCPD (CaHPO4.2H2O) in aqueous solution and then analyzed through XRD, SEM, FTIR, TGA and Four-Point Probe method (custom-made). The results show that Gd3+ has been successfully doped into the hydroxyapatite structure. Then, the photoluminescence, thermal and electrical properties of pure and Gd3+ doped hydroxyapatite were studied and compared with the pure hydroxyapatite. In conclusion, the emission band of Ca10-xGdx(PO4)6(OH)2 was observed at 263, 278, 294, 312 nm) under excitation with 185 nm. The Stokes shift of HAp:Gd3+ was calculated to be 16.031 cm−1. On the other hand, the electrical and thermal conductivity of HAp increased with the increase in Gd3+ concentration due to Ca2+ cation vacancies caused by Gd3+doping.
1. Introduction
Hydroxyapatite (HAp) with a mineral form of calcium apatite and the formula Ca10(PO4)6(OH)2 is the main component of human bones and teeth. It is a biocompatible material used in the repair of damaged tissues and organs in the body. Its chemical composition is very similar to natural bone structure and therefore bone is used as grafting material. Since they can be found naturally in nature, they are usually synthesized (). There are many methods for the synthesis process.
Table 1. Various calcium orthophosphates with different Ca/P molar ratios [Citation3]
It is possible to obtain a wide variety of structures from calcium phosphate ceramics, depending on the molar ratios of calcium and phosphorus. HAp, calcium phosphate ceramics are remarkable materials with abundant and wide usage area. Its structure is similar to inorganic parts of bone and tooth and therefore its use is widespread. The fact that their mineral structure is similar to that of the bone and tooth makes these materials biocompatible and well bonded where they are used [Citation1,Citation2].
Ternane et al. [Citation5] have studied rare-earth ions doped apatites because of their potential application as the phosphors or laser host. Apatite generally has the formula M10(TO4)X2, where M is a large divalent cation, TO4 is a trivalent anionic group, and X is usually a monovalent anion [Citation6].
Biocompatible luminescent materials, which are of fluorescent molecules and semiconductor nanomaterials, have been used in biological staining and prognostics [Citation7]. It is currently focused on lanthanide elements in order to explore new biocompatible photoluminescent materials. On the other hand, lanthanide ions such as Gd+3, Tb+3, Eu+3, etc., are well known for their photoluminescent properties in the visible and near-infrared regions [Citation8]. In addition, it is very important to find new biocompatible materials that can be seen under visible light in order to make new studies with living cells [Citation9].
Biocompatible HAp contains some monovalent (Na+), divalent (Mg+2) cations and divalent anions (CO3−2), which is a nonstoichiometric calcium phosphate (). Hydroxyapatite produced synthetically is a stoichiometric material with a Ca/P ratio of 1.67 and used as a bio-ceramic in different applications, such as bio-ceramic coating, bone tissue and dental applications due to its excellent physical, chemical and biological properties [Citation10,Citation11].
Figure 1. Side-view (a) and top-view (b) of the hexagonal primitive cell of HAp [Citation4]
![Figure 1. Side-view (a) and top-view (b) of the hexagonal primitive cell of HAp [Citation4]](/cms/asset/9d910a33-5aea-443a-9f2c-b54c5733bbe0/tace_a_1920160_f0001_oc.jpg)
The fact that the biomedical probes used in biomedical applications have specific characteristics like low toxicity levels apart from fluorescence is significantly important for them to be observed under confocal microscopes [Citation12].
HAp powders can be produced by some methods. Some of them are given as follows: wet chemical synthesis [Citation13–15], conventional template synthesis [Citation16,Citation17], hydrothermal conversion [Citation18–20], solid-phase reactions [Citation21], co-precipitation reactions [Citation22], pyrolysis [Citation23] and sol–gel processes [Citation24].
The properties of synthetically produced HAp are different from each other depending on synthesis method, chemicals used, stoichiometry and composition [Citation25]. To change the physical, chemical, morphological and optical properties of HAp, some ions such as Ca2+, PO43-, or OH− in HAp should be replaced with other cations or anions. In literature, there are a number of studies concerning modification of HAp crystal structure to change its properties and different ionic substitutions in the hydroxyapatite (Ca10-xMx(PO4)6(OH)2) have been performed [Citation10].
These substituted ions cause some changes in the properties of HAp that affect its crystallinity, thermal stability, morphology, luminescence, electrical resistance and bioactivity. It is well known that the substitution of moderate amounts of Ca2+ ions in the HAp structure can contribute to lattice disorder, reduce particle size and decrease crystallinity [Citation10].
Currently, studies concerning biocompatible, luminescence nanomaterials are going on especially studies related to lanthanides are in trend. However, there are some important research subjects that have to be solved, such as the production of nano-scale, biocompatible and biodegradable imaging probes, to be used in medical field.
Studies on biocompatible, luminescent nanomaterials, especially on lanthanides, are currently increasingly going on. However, there are some important research issues that need to be resolved, such as the production of nanoscale, biocompatible and biodegradable imaging probes for use in the medical field [Citation26].
Biocompatible luminescent materials stand out as suitable implant materials due to their great potential in biomedical applications. For example, luminescent marking is used as a promising method to achieve nondestructive in vivo observation. The luminescent properties of HAp can also be tuned by replacing divalent Ca2+ ions with different luminescent rare earth elements such as Dy, Gd, Eu, etc. [Citation10].
In the literature, there were no studies on HAp synthesis with low rates of only Gd+3 doped and its luminescence property. This study will both fill this deficiency and present how the electrical and thermal characteristics change simultaneously. In the present work, pure and Gd3+ doped in different mol ratio Ca10(PO4)6(OH)2 compounds were synthesized by a sol-gel synthesis method. The synthesized materials were characterized by XRD and FTIR. The photoluminescence properties of the synthesized materials were studied using a spectrofluorometer at room temperature. The dependence of the emission intensity on the Gd3+ concentration for the Ca10-xGdx(PO4)6(OH)2 (0.001 ≤ x ≤ 0.016) was studied in detail.
2. Experimental
Pure and various mole ratios of Gd3+ doped Ca10(PO4)6(OH)2 compounds were prepared by a sol-gel synthesis method followed by heating of the precursor at 900°C in air. HAp synthesis was carried out by the method detailed below. The stoichiometric amounts of Ca(NO3)2.4H2O (Sigma), P2O5 (Merck) (Ca/P: 1.67 in mole) and Gd2O3 (abcr, 99.99%) were dissolved in minimum amount of ethyl alcohol and placed in a porcelain container.
In the sol–gel process, calcium nitrate tetra hydrate, Ca(NO3)24H2O, and phosphorus pentoxide, P2O5, were selected as Ca and P precursors, respectively. Calcium nitrate tetrahydrate (24.2 g; 0.1 mol) was first dissolved in 0.06 M CH3COOH at ambient temperature. To this solution, phosphorus pentoxide (4.37 g; 0.03 mol) dissolved in 0.06 M CH3COOH was added and the resulting mixture was stirred for 1 h at 30°C. After mixing, the precursor solution was kept at the same temperature for another 1 hour, then dried at 100°C for 24 h. After the samples were milled in agate, the dried samples were introduced into a muffle furnace (Nuve MF 120) and maintained at 900°C for 210 min. Finally, the precursor powders were removed from the furnace, the combustion ashes were then easily milled again to obtain a precursor powder of Ca10-xGdx(PO4)6(OH)2 (0.001 ≤ x ≤ 0.016) (x varies from 0.001, 0.002, 0.004, 0.008 and 0.016 mol) and stored for analysis.
The XRD structural analysis of the synthesized materials was performed on an X-ray Bruker AXS D8 Advance equipped with CuKa (30 kV, 15 mA, λ = 1.54051 Ả) radiation at room temperature. Scanning was generally performed between 10° and 90° 2Ө. Fourier transform infrared spectra between 500 and 1500 cm−1 were measured at room temperature with a Perkin Elmer Spectrum 400 FTIR spectrometer. The photoluminescence excitation and emission spectra were measured at room temperature with a Shimadzu UV 3600 Plus spectrophotometer. Thermal conductivity and electrical resistivity measurements were carried out with the custom-made test apparatus.
3. Results and discussion
3.1. X-ray powder diffraction analysis
The XRD pattern of Ca10(PO4)6(OH)2 is presented in , which is in agreement with the XRD data of Ca10(PO4)6(OH)2 in Ref [Citation5]. The indexed reflection data of both the synthesized Ca10(PO4)6(OH)2 and Ca10(PO4)6(OH)2 in Ref [Citation5] are listed in . This compound crystallizes in a hexagonal unit cell of a: 9,4170 Å, b: 9,4170 Å, c: 6,8750 Å, and the space group is P 63/m [Citation27].
Figure 2. XRD patterns for Ca10(PO4)6(OH)2 (labeled peaks for HAp) (a) and 0.16% Gd3+ doped Ca10(PO4)6(OH)2 (labeled peaks for GdO) (b) prepared by sol−gel method
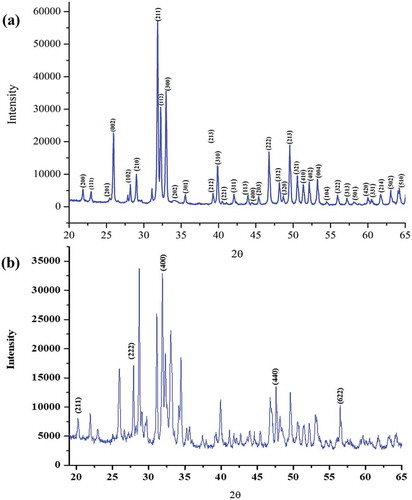
Table 2. Indexed reflections of the Ca10(PO4)6(OH)2 compound
3.2. Infrared spectra analysis
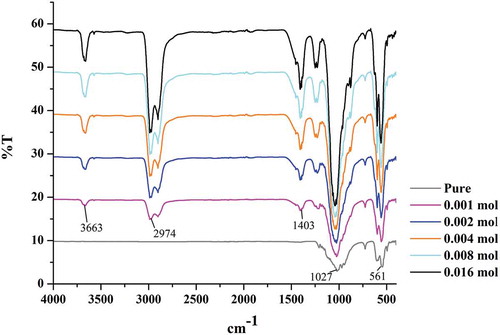
To further confirm the coordination environment of Ca2+ and in the Ca10(PO4)6(OH)2 structure, the FTIR spectra of pure Ca10(PO4)6(OH)2 and Ca10-xGdx(PO4)6(OH)2 were measured at room temperature; they are given in . For pure HAp powder, the characteristic absorption bands at 1027 and 1080 cm−1 (doublets with maxima at 1027 and 1080 cm−1) could be ascribed for the ν3 asymmetric stretching mode of the
group, and at 561 and 601 cm−1 for the ν4 bending mode of
(doublets with maxima at 561 and 601 cm−1) [Citation28]. The band observed at 3571 cm−1, which originates from the stretching of the structural OH−, cannot be shown in pure HAp curve. However, this absorption peak is shifted to 3663 cm−1 for HAp:Gd3+ due to the presence of trivalent Gd3+ ion. According to ref [Citation29], the shift to lower values of 3569, 3568 and 3565 cm−1 with RE+ doping (HAp:Gd, HAp:Gd/Yb/Tm and HAp:Gd/Eu, respectively) indicates slight changes in the structural conformation due to the preferential accommodation of RE3+ at the Ca2 position, as it was demonstrated by the Rietveld refinement.
Figure 3. Infrared spectra of pure Ca10(PO4)6(OH)2 and Ca10-xGdx(PO4)6(OH)2 (x = 0.001, 0.002, 0.04 and 0.016) at room temperature
4. Photoluminescence
The luminescence of Gd3+ in host materials is not so diverse because Gd3+ has a certain transition which is 6P7/2 – 8S7/2. It is well known that the Gd-doped HAp samples show strong UV luminescence and that the excitation and the emission spectra of the Gd-doped HAp displays narrow peaks as in 4 f-4 f transitions [Citation30]. On the other hand, this study is one of the few studies carried out on the optical properties of Gd3+ doped HAp.
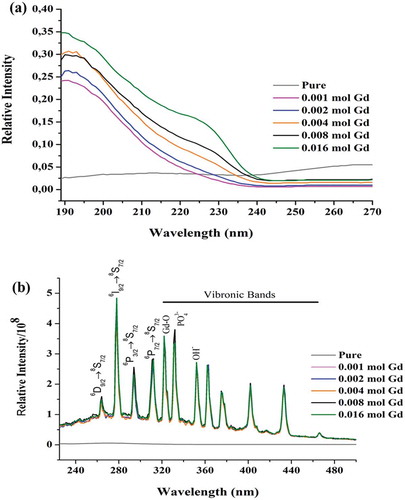
At room temperature, upon excitation in the 6G3/2 (G = 3/2–13/2) region, emission bands corresponding to 6D9/2 → 8S7/2, 6I9/2 → 8S7/2, 6P3/2 → 8S7/2 and 6P7/2 → 8S7/2 transitions are observed with the peaks at 263 nm (38.023 cm−1), 278 nm (31.806 cm−1), 294 nm (34.014 cm−1), 312 nm (32.051 cm−1), respectively. The other trivalent Gd3+ ion emission peaks in different hosts are given in [Citation31,Citation32]. The emission properties belonging to Gd3+ are suitable for potential multimodal applications [Citation29]. In the emission spectrum, eight strong and clear vibronic bands were detected at 322, 332, 353, 362, 376, 402, 433, 466 nm, three of which are belong to Gd-O, , OH−, respectively ().
Table 3. Data on the 6P7/2 → 8S transition for Gd3+ in several hosts
Figure 4. Photoluminescence spectra of pure Ca10(PO4)6(OH)2 and Ca10-xGdx(PO4)6(OH)2 (x = 0.001, 0.002, 0.04 and 0.016) at room temperature
Although some certain peaks are often seen in the optical spectra of RE ions like Gd3+, other weak peaks corresponding to vibronic transitions also occur [Citation33]. The location and intensity of these vibronic peaks are related to the atoms and molecules around the RE ions. Therefore, a detailed examination of the peaks provides information about the chemical structure and vibrational coupling with 4fn electrons [Citation34]. The vibronic intensity seen in the RE ions such as Gd3+ doped HAp is due to vibronically induced forced electric dipole transitions [Citation34]. In the literature, Paterlini et al. said that the type of vibronic sidebands seen in the Gd3+ doped HAp was observed for the first time only in their own study [Citation30]. The vibronic peaks seen in the emission spectrum of Gd3+ doped HAp belong to Gd-O, and O-H ions. The energy of these vibronic peaks is caused by the electronic levels of the local Gd-O vibrations in the first coordination sphere, vibrations in the more distant phosphate and hydroxyl molecular ions. It is seen in this study as well that the Gd3+ ions coupled to this high energy vibration [Citation35]. On the other hand, it is well understood that Gd3+ may enter preferentially the Ca+2 site in order to better optimize the charge balance through the thermal diffusion mechanism occurring in these materials [Citation5,Citation36]. The mechanism can be written as in the equation 1 and 2 [Citation37].
Brixner et al. have alleged that the mechanism given above should affect the non-radiative decay of the excited states of the impurity ions [Citation35]. The excitation spectrum shows only one peak in the region corresponding to 6G3/2 (G = 3/2–13/2) → 8S7/2 transition. The decay curve corresponding to the first and maximum emission peaks at 263 and 278 nm, respectively, were obtained upon pulsed 185 nm excitation.
Additionally, multiple but no splitting bands are observed in the emission spectra. The absorption and emission spectra of Gd3+ are in the UV spectral region depending strongly on the electronic transition of the trivalent Gd3+ ion. Also, the emission band of Ca10-xGdx(PO4)6(OH)2 lies between 263 and 312 nm and is in the UV region. The excitation and emission spectra of the Gd3+doped HAp were analyzed at room temperature. As seen in , with different Gd3+ doping concentrations, the shapes and positions of the emission and excitation peaks have exhibited no obvious changes. Although Ca10-xGdx(PO4)6(OH)2 exhibits an emission band at different wavelengths (263, 278, 294, 312 nm) under excitation with 185 nm, but no peak was observed in the emission spectrum of pure Ca10(PO4)6(OH)2 under excitation with 185 nm (). It can be seen from the results obtained that pure HAp has no photoluminescence properties under excitation with 185 nm. The dependence of the emission intensity on the Gd3+ concentration for the Ca10-xGdx(PO4)6(OH)2 (x = 0.001, 0.002, 0.04 and 0.016) is given in . There was no change in the emission intensity with increasing Gd3+ concentration. For all Gd3+ concentration, the emission intensities of HAp:Gd3+ remained constant in all transition. It is thought that the energy occurring following the electronic transition is transformed into vibrational energy by the OH−, ions and Gd-O bonds, so the emission intensities remain constant with increasing Gd3+ concentration.
In Gd3+ doped Ca10(PO4)6(OH)2 powders, it can be attributed to the former one as such in Gd3+ doped LaF3 [Citation38], ScBO3 [Citation39] and La2O3 [Citation40]. Both the unexcited luminescence centers and the traps absorb the excitation energy [Citation41]. Also, another important factor in the emission behavior of a phosphorescent material is the Stokes shift, which is only one contributor to the emission color and is calculated using the excitation band and the emission band of the synthesized material. The Stokes shift of the synthesized material HAp:Gd3+ was calculated as 16.031 cm−1 using the excitation band at 185 nm and the first emission band at 263 nm.
According to the XRD patterns in , it was confirmed that the synthesized compound was Ca10-xGdx(PO4)6(OH)2, and there was trace amount of Gd+3 in HAp structure. In addition, the non-emitting of the materials synthesized with different Gd+3 additive ratios indicates that the luminescence intensity is independent of Gd+3 amount [Citation30].
5. Electrical resistivity
In this study, the total electrical resistivity of the pure and Gd3+ doped HAp was measured by a custom-made 4-probe method (). The synthesized powder was molded in a steel mold of 15 mm diameter and then sintered at 900°C for 210 minutes, the sample had a shape of a stick, 5 mm in length and 7.5 mm in radius. Tin paste was utilized as electrode. Each measurement was repeated at least three times and the results obtained are given in . As can be seen in , electrical resistance decreases as the Gd3+ doping increases. This is thought to be due to the formation of Ca2+ vacancies as a result of the replacement of the divalent Ca2+ cations by trivalent Gd3+ cations in the synthesized material [Citation30]. Based on the literature on the subject, it is stated that the total electrical conductivity is the sum of the electrical and ionic conductivities. Wang et al. [Citation42] measured the electrical conductivity of GdyCe1-yO2-y/2-x (y = 0.1, 0.2), as a function of temperature and oxygen partial pressure, with a complex impedance method. They reported that the total electrical conductivity increased with the amount of Ce3+ doped to GdO in the high temperatures. In our paper, the increasing rates of Gd+3 were doped to an inorganic compound such as HAp at room temperature. The total electrical conductivity increased due to the crystal defects that may occur due to non-stoichiometric doping. The experimental results overlap with their findings. Since similar researches on the electrical conductivity of Gd3+ doped HAp could not be found in the literature, the mentioned study was taken as a reference.
Figure 5. 4-Probe Conductanmeter
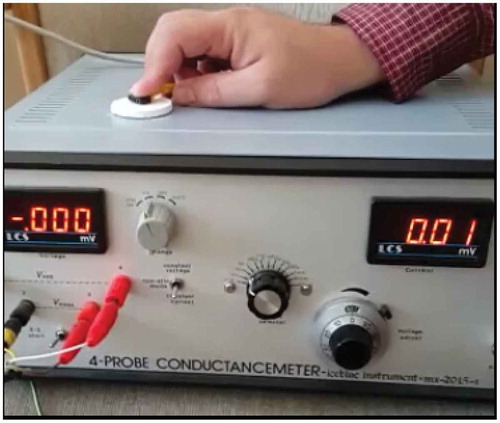
Table 4. Electrical resistivity values of pure Ca10(PO4)6(OH)2 and Ca10-xGdx(PO4)6(OH)2 (x = 0.001, 0.002, 0.04 and 0.016) at room temperature
6. Thermal conductivity
In this study, thermal conductivity measurements of the pure and Gd3+ doped HAp were carried out with a portable heat conductometer (Decagon KD2 Pro Thermal Analyzer). Each measurement was repeated at least three times and the results obtained are given in . The measurements were done at room temperature of 22°C. As can be seen from , it is seen that as the amount of Gd3+ cation increases, the thermal conductivity increases and reached at maximum at 0.004 mol of Gd3+ addition. The increase in thermal conductivity of HAp with the contribution of Gd3+ is a result of the replacement of Ca2+ by trivalent Gd3+ cations in the synthesized material. During the replacement of Ca2+ ions with Gd3+ cations in the synthesized material, Ca2+ cation vacancies may occur in order to ensure the charge balance through the thermal diffusion mechanism, thus phonons activities get easy.
Table 5. Thermal conductivity values of pure Ca10(PO4)6(OH)2 and Ca10-xGdx(PO4)6(OH)2 (x = 0.001, 0.002, 0.04 and 0.016) at room temperature
7. SEM images
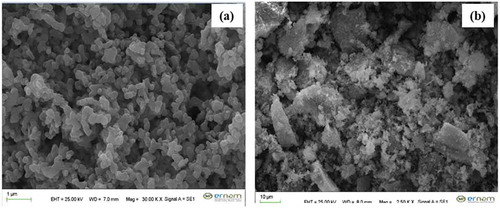
Surface morphologies of pure Gd doped hydroxyapatite were analyzed by SEM as seen from . Accordingly, it is seen that the particle shapes are similar and exhibit a homogeneous distribution.
Figure 6. SEM images of pure (a) and 0.16% Gd3+ doped Ca10(PO4)6(OH)2 (b)
8. Conclusion
Pure and Gd3+ doped Ca10(PO4)6(OH)2 materials were prepared by a sol-gel synthesis method followed by heating of the precursor at 900°C in air. The synthesized materials were characterized using powder XRD, FTIR and SEM. Pure Ca10(PO4)6(OH)2 was not shown to have the photoluminescence property. However, as Gd3+ ions were doped to the host material, Ca10(PO4)6(OH)2:Gd3+ achieved a band emission corresponding to the transition 6D9/2 → 8S7/2, 6I9/2 → 8S7/2, 6P3/2 → 8S7/2 and 6P7/2 → 8S7/2 transitions are observed with the peaks at 263 nm, 278 nm, 294 nm, 312 nm, respectively. Thus, the photoluminescence property of Gd3+ doped Ca10(PO4)6(OH)2 materials was explained by doped Gd3+ ions. The emission band of Ca10-xGdx(PO4)6(OH)2 was observed at 263, 278, 294, 312 nm) under excitation with 185 nm. The Stokes shift of HAp:Gd3+ was calculated to be 16.031 cm−1. On the other hand, the electrical and thermal conductivity of HAp increased with the increase in Gd3+ concentration due to Ca2+ cation vacancies caused by Gd3+doping.
Acknowledgments
The authors would like to thank Erciyes University Scientific Research Projects Coordinator for supporting this study with Project No. FYL-2018-8084. This study was also supported by Erciyes University ERNAM (Nano Technology Research Center).
Disclosure statement
No potential conflict of interest was reported by the authors.
References
- Dorozhkin SV. Hydroxyapatite and other calcium orthophosphates: bioceramics, coatings and dental applications. 2017. p. 1–462. New York: Nova Science Publishers.
- Martinez M, Bayne C, Aiello D, et al. Multi-elemental matrix-matched calcium hydroxyapatite reference materials for laser ablation: evaluation on teeth by laser-induced breakdown spectroscopy. Spectrochim Acta Part B At Spectrosc. 2019;159:105650.
- Gomes DS, Santos AMC, Neves GA, et al. Uma breve revisão sobre a obtenção de hidroxiapatita e aplicação na biomedicina. Cerâmica. 2019;65(374):282–302.
- Slepko A, Demkov AA. Hydroxyapatite: vibrational spectra and monoclinic to hexagonal phase transition. J Appl Phys. 2015;117(7):74701.
- Ternane R, Trabelsi-Ayedi M, Kbir-Ariguib N, et al. Luminescent properties of Eu3+ in calcium hydroxyapatite. J Lumin. 1999;81(3):165–170.
- Ciobanu CS, Massuyeau F, Andronescu E, et al. Biocompatibility study of europium doped crystalline hydroxyapatite bioceramics. Dig J Nanomater Biostructures. 2011;6(4):1639.
- Zhang C, Li C, Huang S, et al. Self-activated luminescent and mesoporous strontium hydroxyapatite nanorods for drug delivery. Biomaterials. 2010;31(12):3374–3383.
- Bach LG, Cao XT, Islam M, et al. Combination of surface initiated reversible addition fragmentation chain transfer polymerization, thiol-ene click chemistry and coordination chemistry for the fabrication of a novel photoluminescent hydroxyapatite nanohybrids. J Nanosci Nanotechnol. 2015;15(8):5897–5900.
- Liu H, Chen F, Xi P, et al. Biocompatible fluorescent hydroxyapatite: synthesis and live cell imaging applications. J Phys Chem C. 2011;115(38):18538–18544.
- Alshemary AZ, Akram M, Goh Y-F, et al. Structural characterization, optical properties and in vitro bioactivity of mesoporous erbium-doped hydroxyapatite. J Alloys Compd. 2015;645:478–486.
- Boanini E, Cassani MC, Rubini K, et al. (9R)-9-hydroxystearate-functionalized anticancer ceramics promote loading of silver nanoparticles. Nanomaterials. 2018;8(6):390.
- Lafarga AKS, Moisés FPP, Gurinov A, et al. Dual responsive dysprosium-doped hydroxyapatite particles and toxicity reduction after functionalization with folic and glucuronic acids. Mater Sci Eng C. 2015;48:541–547.
- Wang P, Li C, Gong H, et al. Effects of synthesis conditions on the morphology of hydroxyapatite nanoparticles produced by wet chemical process. Powder Technol. 2010;203(2):315–321.
- Liu Y, Hou D, Wang G. A simple wet chemical synthesis and characterization of hydroxyapatite nanorods. Mater Chem Phys. 2004;86(1):69–73.
- Madhumathi K, Shalumon KT, Rani VVD, et al. Wet chemical synthesis of chitosan hydrogel–hydroxyapatite composite membranes for tissue engineering applications. Int J Biol Macromol. 2009;45(1):12–15.
- Liu C, Ji X, Cheng G. Template synthesis and characterization of highly ordered lamellar hydroxyapatite. Appl Surf Sci. 2007;253(16):6840–6843.
- Yang Z, Huang Y, Chen S-T, et al. Template synthesis of highly ordered hydroxyapatite nanowire arrays. J Mater Sci. 2005;40(5):1121–1125.
- Murugan R, Ramakrishna S. Crystallographic study of hydroxyapatite bioceramics derived from various sources. Cryst Growth Des. 2005;5(1):111–112.
- Ripamonti U. The morphogenesis of bone in replicas of porous hydroxyapatite obtained from conversion of calcium carbonate exoskeletons of coral. 1991.
- Ripamonti U, Ma -S-S, Van Den Heever B, et al. Osteogenin, a bone morphogenetic protein, adsorbed on porous hydroxyapatite substrata, induces rapid bone differentiation in calvarial defects of adult primates. Plast Reconstr Surg. 1992;90(3):382–393.
- Arita IH, Castano VM, Wilkinson DS. Synthesis and processing of hydroxyapatite ceramic tapes with controlled porosity. J Mater Sci Mater Med. 1995;6(1):19–23.
- Bhattacharjee BN, Mishra VK, Rai SB, et al. Study of morphological behavior of hydroxyapatite, EDTA hydroxyapatite and metal doped EDTA hydroxyapatite synthesized by chemical co-precipitation method via hydrothermal route. Key Eng Mater. 2017; 720:210–214.
- Hu C, Aindow M, Wei M. Focused ion beam sectioning studies of biomimetic hydroxyapatite coatings on Ti-6Al-4V substrates. Surf Coatings Technol. 2017;313:255–262.
- Ben-Arfa BAE, Salvado IMM, Ferreira JMF, et al. Novel route for rapid sol-gel synthesis of hydroxyapatite, avoiding ageing and using fast drying with a 50-fold to 200-fold reduction in process time. Mater Sci Eng C. 2017;70:796–804.
- Zhang M, Liu J-K, Miao R, et al. Preparation and characterization of fluorescence probe from assembly hydroxyapatite nanocomposite. Nanoscale Res Lett. 2010;5(4):675–679.
- Chen M-H, Yoshioka T, Ikoma T, et al. Photoluminescence and doping mechanism of theranostic Eu3+/Fe3+ dual-doped hydroxyapatite nanoparticles. Sci Technol Adv Mater. 2014;15(5):55005.
- Hughes JM, Cameron M, Crowley KD. Structural variations in natural F, OH, and Cl apatites. Am Mineral. 1989;74:870–876.
- Lak A, Mazloumi M, Mohajerani MS, et al. Rapid formation of mono‐dispersed hydroxyapatite nanorods with narrow‐size distribution via microwave irradiation. J Am Ceram Soc. 2008;91(11):3580–3584.
- Ignjatović NL, Mančić L, Vuković M, et al. Rare-earth (Gd3+, Yb3+/Tm3+, Eu3+) co-doped hydroxyapatite as magnetic, up-conversion and down-conversion materials for multimodal imaging. Sci Rep. 2019;9(1):1–15.
- Paterlini V, Bettinelli M, Rizzi R, et al. Characterization and luminescence of Eu3+- and Gd3+-doped hydroxyapatite Ca10(PO4)6(OH)2. Crystals. 2020;10(9):806.
- Blasse G, Brixner LH, Mroczkowski S. The electronic and vibronic transitions in the emission spectrum of Gd3+ in the yttrium hydroxide structure. J Solid State Chem. 1989;82(2):303–306.
- Blasse G, Dirksen GJ. Luminescence of Eu (III) in (NH4) 3YCl6: nonradiative transitions induced by the second coordination sphere. JSSCh. 1992;96:258–262.
- Blasse G. Vibronic transitions in rare earth spectroscopy. Int Rev Phys Chem. 1992;11(1):71–100.
- Blasse G, Meijerink A, De Mello Donegá C. Vibronic rare earth spectroscopy: results and pitfalls. J Alloys Compd. 1995;225(1–2):24–27.
- Brixner LH, Crawford MK, Blasse G. Optical luminescence of electronic and vibronic transitions in Gd2−xYx(SO4)3 · 8H2O. J Solid State Chem. 1990;85(1):1–7.
- Zhang C, Uchikoshi T, Liu L, et al. Synthesis of Eu‐doped hydroxyapatite whiskers and fabrication of phosphor layer via electrophoretic deposition process. J Am Ceram Soc. 2020;103(12):6780–6792.
- Han Y, Wang X, Dai H, et al. Synthesis and luminescence of Eu3+ doped hydroxyapatite nanocrystallines: effects of calcinations and Eu3+ content. J Lumin. 2013;135:281–287.
- Hu M, Wang Y, You Z, et al. Influence of codoped Gd3+ ions on the spectroscopic site symmetry of Dy3+ ions in LaF3 single crystals. J Mater Chem C. 2019;7(43):13432–13439.
- Sytsma J, Meijer A, Blasse G. Spectroscopy of Gd3+ and Eu3+ in the calcite structure. J Solid State Chem. 1992;99(1):78–84.
- Dey R, Rai VK. Yb3+ sensitized Er3+ doped La2O3 phosphor in temperature sensors and display devices. Dalt Trans. 2014;43(1):111–118.
- Pekgözlü İ, Erdoğmuş E, Demirel B, et al. A novel UV-emitting phosphor: Li6CaB3O8.5:Pb2+. J Lumin. 2011;131(11):2290–2293.
- Wang S, Kobayashi T, Dokiya M, et al. Electrical and ionic conductivity of Gd‐doped ceria. J Electrochem Soc. 2000;147(10):3606.