
 ?Mathematical formulae have been encoded as MathML and are displayed in this HTML version using MathJax in order to improve their display. Uncheck the box to turn MathJax off. This feature requires Javascript. Click on a formula to zoom.
ABSTRACT
Porous piezoelectric materials have been widely used in hydrophone applications owing to their excellent hydrostatic charge constant (dh) and voltage constant (gh). However, owing to the difficulty in sample manufacturing, the evaluation of the overall piezoelectric properties for reliable device design using simulations is challenging. Herein, a two-step simulation was performed to accurately determine the overall properties of the porous PZT. First, the piezoelectric charge constant was calculated by displacement calculations using the electrostrictive effect. Second, using the calculated piezoelectric charge constant and impedance spectrum obtained from the experiment, the initial value for optimizing the properties was selected, and the overall properties were obtained using the parametric estimation technique. These parametric estimation simulation procedures were performed with the samples of radial and thickness modes based on the IEEE standards. Finally, the piezoelectric properties obtained were compared and verified with the experimental values. Therefore, the overall piezoelectric properties include mechanical, frequency and dielectric properties according to the porosity were obtained with reliable results.
1. Introduction
Porous piezoelectric materials have been widely used in hydrophone applications owing to their excellent hydrostatic charge constant (dh) and voltage constant (gh) [Citation1–5]. Because these devices require very high precision and reliability, simulations have been employed to obtain a reliable design [Citation6,Citation7]. Although various preprocessing technologies exist, the material properties fundamentally affect the analysis results and final design.
Several attempts have been made to predict the properties of piezoelectric ceramics using simulations and experimental methods [Citation8–16]. Boumchedda et al. investigated the dependence of hydrostatic properties and on the porosity of porous PZT [Citation17]. Ting [Citation18] reported the piezoelectric charge constants and coupling factor (kt) behavior for various porosities of PZT. Eichhorn et al. [Citation19] investigated the hydrostatic properties of porous PZT with different pore orientations. However, most previous studies have investigated the hydrostatic charge constant (dh) and voltage constant (gh), or permittivity (ε) variations with porosity. Properties such as elastic compliance or stiffness have not been reported because of the difficulty involved in sample preparation and the measurements required to determine the overall physical properties required for simulation.
In this study, the hydrostatic charge constant (dh) and voltage constant (gh) of porous piezoelectric ceramics according to the porosity were calculated through simulations. In addition, the elastic compliance and overall piezoelectric properties were obtained through a parametric estimation technique using the calculated piezoelectric constant as a parameter, and the changes according to porosity were analyzed. In addition, the physical properties determined from the simulations were compared and experimentally verified.
2. Method
2.1. Determining the piezoelectric charge constant through displacement calculation based on FEM
Porous piezoelectric ceramic is regarded as a piezoelectric composite composed of PZT and pores. In general, the physical properties of piezoelectric composites, including density, mechanical, dielectric and piezoelectric properties are calculated by Equationequation (1)(1)
(1) according to the general mixture rule [Citation20]
where, ν represents the volume percent of pore and P represents physical properties. However, since this general mixing rule is very linear, it does not clearly describe the practical application piezoelectric parameters of porous ceramics, such as coupling factor (kij), piezoelectric constant (dij) and elastic modulus (Sij),except for density and permittivity [Citation21]. Therefore, in this study, among the material properties of porous PZT, only permittivity and density were calculated according to the general mixture rule, and the following method was used for calculating the rest of the material properties.
Porous PZT for the displacement calculations was modeled using COMSOL Multiphysics® SW ver. 6.0 [Citation22]. To obtain the piezoelectric charge constants (d31, d33) from displacement calculations, the piezoelectric equation is modified as shown in EquationEquations (2)(2)
(2) , (Equation3
(3)
(3) ), and (Equation4
(4)
(4) ) below.
where Sij is the strain in the j-direction for the ceramic polarized in the i-direction, dij is the piezoelectric charge constant, E is the electric field, and t is the length of the ceramic in the j-direction. Therefore, from EquationEquation (4)(4)
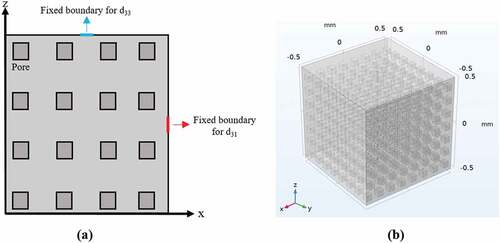
(4) , dij is the value obtained by dividing the change in the length in the j-direction by the applied voltage. shows the model used for the displacement calculations. The model had a cubic shape with dimensions of 1 × 1 × 1 mm3, and the internal pores were also arranged in cubic shapes. The internal pore size was modeled and determined to be 20–50 µm according to the porosity to render it almost similar to the actual pore size. ) shows the 2D conceptual model of the finite element model used to calculate the dij of KICET PZT8 ceramics. To determine d33, a fixed boundary with dimensions of 0.01 × 0.01 mm2 was marked in the Z-direction, and to determine d31, a fixed boundary with dimensions of 0.01 × 0.01 mm2 was marked in the X-direction to obtain displacement. The size of the square pillar used as the fixed boundary was very small compared to that of the overall model because the fixed boundary did not affect the displacement significantly. ) shows the 3D model and overall model for pore arrangement and calculations. An electric potential of 1 V was applied to the opposite surface of each fixed boundary to generate a displacement using the electrostrictive effect on the completed geometry.
Figure 1. Finite element model for calculating dij of KICET-PZT8 ceramics: (a) 2D conceptual model and (b) 3D model.
2.2. Parametric estimation using piezoelectric charge constant
The piezoelectric properties of porous PZT were derived through parametric estimation following the method proposed by Shin et al. [Citation23]. shows the process of deriving the overall piezoelectric properties through parametric estimation. The TS mode is an independent vibration mode that does not affect RAD and TE vibrations. Therefore, and d15, which can be derived in TS mode, are the experimental values. The geometry of the model for calculation was the same as that of the actual RAD sample, and the equivalent properties according to the porosity were added to the bulk model without pore modeling. The initial properties for the simulation were derived from the RAD mode sample for each porosity, and the impedance spectrum (ZFEM) was obtained via simulation. The obtained ZFEM was adjusted to fit the experimental impedance spectrum (ZEXP) by considering the frequency response characteristics, according to the parameters listed in . A blue arrow pointing to the left side means a decrease in frequency, and a red arrow pointing to the right side means an increase in frequency. The fitting process for the ZFEM and ZEXP is as follows. To optimize the first resonant frequency (frrad1), the anti-resonant frequency (farad1) in the radial (RAD) mode, and the second resonant frequency (frrad2) and anti-resonant frequency (farad2) were optimized. The corresponding property was selected as the optimized property. Among the properties used for parametric estimation, values obtained through displacement calculation in section 2.1 were used for d31 and d33, which are factors that have an important influence on the frequency response characteristics.
Figure 2. Flowchart for the property optimization of KICET-PZT8 using the finite element method.
Table 1. Effect of frequency of KICET-PZT8 in radial and thickness modes on various parameters.
2.3. Synthesis of porous PZT
For the experimental verification of property optimization, porous PZT was synthesized using calcined KICET PZT-8 powder via a conventional solid-state reaction process. Polyvinyl alcohol (PVA) was added to the dried powders at 4 wt%, and spherical poly methyl methacrylate (PMMA) powder with an average particle size of 35 μm was added at ~10–50 vol%. The powders were molded into shapes according to the IEEE standards [Citation24]. Each shape was divided into radial (RAD), thickness expansion (TE), transverse shear (TS), and longitudinal expansion (LE) modes according to the vibration mode. The molded samples were sintered at 1250°C for 2 h in a sealed alumina crucible containing atmospheric powder with the same composition as the specimens. The specimens were poled in a silicone oil bath at 120°C under an applied electric field of 2.5 kV/mm for 30 min. The piezoelectric properties were calculated by measuring the impedance characteristics using an impedance analyzer (HP 4194A, Agilent).
3. Results and discussion
3.1. Microstructural characteristics of porous PZT
shows the porosity of PZT and its pore size according to the PMMA vol%. As the PMMA content increased, the porosity increased, indicating that PMMA successfully occupied the space and evaporated during particle growth through sintering. In addition, because the average size of the pores was ~ 34–42 µm, which is similar to the size of spherical PMMA powder, PMMA appears to be a suitable material for porous PZT synthesis. shows the microstructure of porous PZT according to the porosity. The microstructure revealed that the number of spherical pores of a certain size increased as the porosity increased. In addition, at porosities of 30% or higher, some pores were connected to each other. The material seems to change from a 0–3 type to a 3–3 type piezoelectric composite when the porosity of the porous PZT is ~ 22%. In addition, porous ceramics were successfully synthesized when the density and resulting pore microstructure were comprehensively considered.
Figure 3. Micrographs of sintered KICET-PZT8 ceramics with different porosities: (a) 7% (b) 13% (c) 22% (d) 30% (e) 39%.
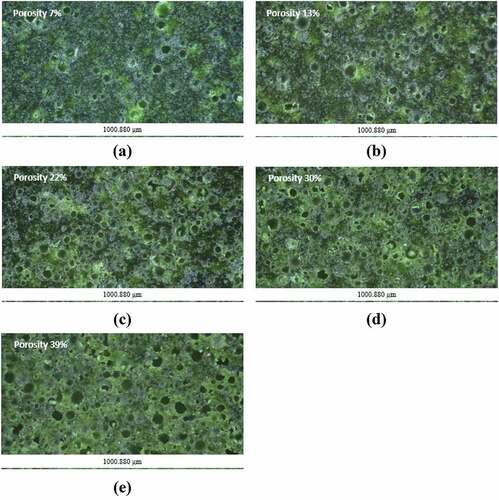
Table 2. Pore characteristics of the fabricated porous KICET-PZT8 ceramics according to PMMA vol%.
3.2. Piezoelectric charge constants of porous PZT derived using displacement calculations
In piezoelectric composites or porous PZT, piezoelectric charge constants such as dij are known to change significantly depending on the shape, size, and number of pores. In particular, porous PZT exhibits significant changes in d33 and d31 depending on the location and distribution of pores at constant porosity [Citation25–27]. Therefore, to use it as an initial property value for parametric estimation, it is necessary to determine the number of pores that exhibit little variation and reflect the actual properties. shows the changes in the d33 and d31 values when the number of pores was changed at a porosity of 30%. It can be seen that the change in both the d33 and d31 values is very large, up to 200 when the number of pores is relatively small, but converges to a constant value when the number of pores is more than 400. This seems to occur because, with an increase in the number of pores beyond a certain level, the internal pores become more regular; thus, the variables affecting the calculation are reduced. Therefore, 400 or more pores were selected for the displacement calculations. The exact number of pores was determined by selecting the number of pores corresponding to a size of 35 × 35 × 35 μm3, which is similar to the actual pore size according to the porosity. shows the results obtained for various piezoelectric charge constants (dij) and piezoelectric voltage constants (gij) after calculating the displacement according to the porosity. dh and gh values were calculated using EquationEquations (5)(5)
(5) and (Equation6
(6)
(6) ), respectively, and the required dielectric constant according to the porosity was mathematically calculated using EquationEquation (7)
(7)
(7) by Marutake et al [Citation28].
Figure 4. Calculated change in dij of KICET-PZT8 according to the number of pores at 30% porosity: (a) d33 (b) d31.
Figure 5. Simulation results of piezoelectric constant at various porosities: (a) d33 and d31 (b) dh (c) gh and (d) dh*gh.
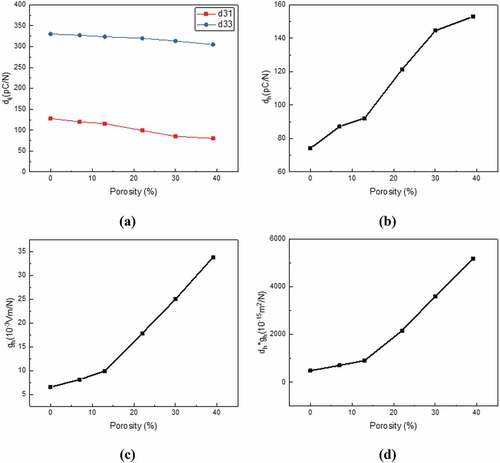
As the porosity increases, d33 and d31 decrease. However, it can be seen that the decrease in d31 is much larger than that in d33. When porosity was greater than 10%, the decrease in d31 increased rapidly. The difference in the extent of the decrease in d33 and d31 according to porosity leads to an increase in dh. Accordingly, as shown in ), dh also increases rapidly above 10% porosity, and the values of gh and dh*gh exhibit a similar trend.
3.3. Piezoelectric properties derived through parametric estimation based on piezoelectric charge constant
Piezoelectric property optimization using parametric estimation was performed using the d31 and d33 values obtained through displacement calculations as two parameters. shows the normalized results for samples with no porosity, to observe the changes in the porosity of the overall piezoelectric properties obtained through optimization. and
increased with increasing porosity, and
decreased at a rate similar to that of the increase in
. In the case of
, the decrease was very small compared to the increase in
, which suggests that with an increase in the porosity, the displacement in 3-directions becomes easier than that in the 1-direction. This results in the decrease in
becoming larger than that in
as the porosity increases. A larger decrease in
led to an increase in
, which in turn increased
and
*
. This also shows a sharp increase when the porosity was greater than 13%. The relative permittivity decreased as the porosity increased and the frequency constant (N) decreased, indicating that the resonance and anti-resonance frequencies were pulled forward as the porosity increased.
Table 3. Normalized mechanical and piezoelectric properties of KICET-PZT8 calculated using h-parametric estimation.
By optimizing the material properties via simulation, the overall trends in the properties were obtained, and the overall piezoelectric properties were obtained using only the impedance spectrum of the Rad mode sample.
3.4. Experimental validation of the simulation results
Experimental verification was performed to verify the piezoelectric properties according to the porosity, as obtained via simulations. As shown in , IEEE-standard samples were prepared for each porosity value, the piezoelectric properties were obtained using the resonance method, and the results were compared with the simulation results. compares the elastic compliance obtained from the simulation and the experiment. and
exhibit values that are quite close to the experimental values. However,
and
exhibit some differences, which can be attributed to an error in the LE-mode sample among the IEEE-standard samples. The LE-mode sample responds very sensitively to the skill of the operator and the shape of the jig because it has a shape that maximizes the vibration in the longitudinal direction. Consequently, it is assumed that an error occurs in the
value derived from the LE mode, and a slightly larger error occurs in the
value calculated using
. shows a comparison of the piezoelectric constants obtained from the simulation and experimental results. The overall constants are similar to the experimental and simulation values. d33 exhibits a difference between the experimental value and graph, but the difference is within 4%, which is considered an error in the measurement. In the case of d31, the value deviated slightly from the initial value obtained from the displacement calculations, mainly because it is a major parameter in the process of fitting the impedance spectrum. In addition, similar values of d31 were obtained experimentally and after parametric estimation, implying that the initial value obtained through the displacement calculation can be optimized to match the experimental value. The dielectric constants (
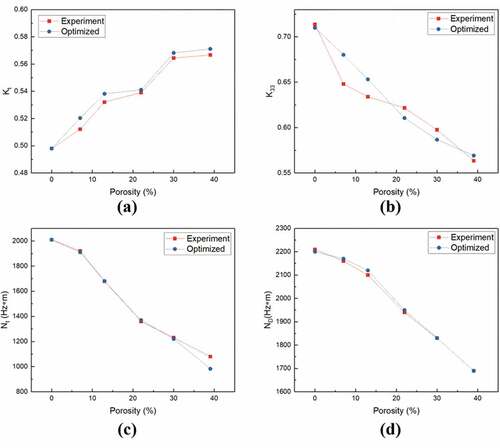
) also decreased with increasing porosity, which is almost consistent with the experimental results. shows a comparison of the coupling factors and frequency constants obtained from the simulation and experimental results. In the case of the coupling factor (k), the value of the coupling factor in the thickness mode (
) increases as the porosity increases, and its value in the longitudinal mode (
decreases, exhibiting a trend consistent with the overall experimental value. Both the thickness direction frequency constant and radial direction frequency constant show that the porosity decreases as the porosity increases. It can also be observed that the frequency constant (N) is almost equal to that obtained from the experimental results. From the experimental verification, it was concluded that the piezoelectric properties obtained from the simulation were reliable.
Figure 6. Fabricated KICET-PZT8 samples with various vibration modes to derive piezoelectric properties using a resonance method based on IEEE standards.
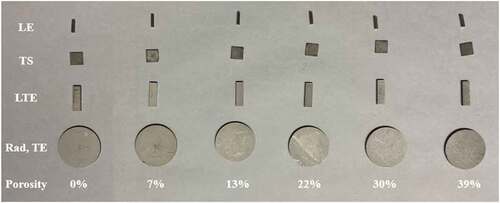
Figure 7. Comparison of the mechanical properties of KICET-PZT8 optimized through parametric estimation and experimental results with various porosities: (a) (b)
(c)
(d)
and (e)
.
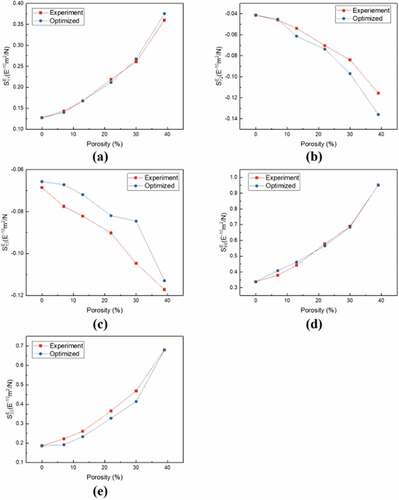
Figure 8. Comparison of piezoelectric and dielectric constants of KICET-PZT8 optimized through parametric optimization and experimental results with various porosities: (a) (b)
(c)
(d)
(e)
(f)
and (g)
.
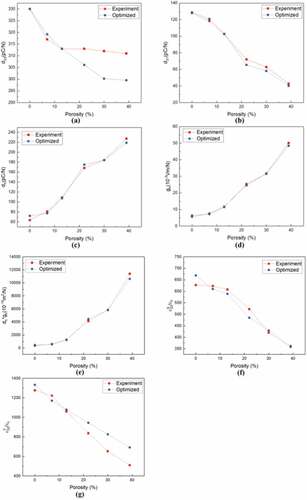
Figure 9. Comparison of coupling factors and frequency constants of KICET-PZT8 optimized through parametric optimization and experimental results with various porosities: (a) (b)
(c)
, and (d)
.
4. Conclusions
In this study, porous KICET-PZT8 ceramics were successfully fabricated, the overall piezoelectric properties required for device design were derived through simulation, and the properties were experimentally verified.
The porous KICET-PZT8 ceramics were sintered by mixing spherical PMMA powder with calcined KICET PZT8 powder. As the PMMA vol.% increased, the porosity of the sintered body also increased. In the overall piezoelectric property derivation process, d33 and d31 were derived via displacement calculations. In the simulation, to select the number of pores with an accurate value that is not affected by the number of pores, the displacement according to the number of pores was calculated. The d33 and d31 values tended to decrease according to the porosity, and the decrease was much greater in d31 than in d33. The derived d33 and d31 values were used as parameters in the parametric estimation process to determine the remaining piezoelectric properties. A parameter estimation technique was used to compare the analyzed impedance spectrum (ZFEM) and the measured impedance spectrum raw data (Zexp) of the test sample according to the change in the piezoelectric constants (sij, dij). The radial vibration mode and thickness expansion modes were used for the predicted and analyzed vibration modes, respectively. The elastic compliance, piezoelectric charge constant, and relative permittivity were obtained using a parametric estimation technique, and each property showed a tendency to increase or decrease according to the porosity. Each property changed more significantly in the section where porosity was ≥ 12%. To experimentally verify the properties obtained through the simulation, samples for each vibration mode according to the IEEE standard were produced for each porosity, and the properties were derived using the resonance method. Each piezoelectric property was very similar to the corresponding property obtained through simulation, but the values of and
showed differences compared to the other properties. This was attributed to the high error in the measurement of the LE sample.
Through this study, it was possible to derive the overall piezoelectric properties (not the partial properties of the porous PZT ceramic) through simulation. The derived piezoelectric properties are quite reliable, and it is expected that they can be used in the design of piezoelectric composites and piezoelectric devices in the future by identifying trends in the overall piezoelectric properties according to porosity.
Acknowledgments
The authors acknowledge the financial support from the Development of Virtual Engineering & Materials Data Platform for Digital Transformation of Ceramics Project of the Ministry of Trade, Industry and Energy (MOTIE) of Korea (grant number: P0022336), and the KICET policy project.
Disclosure statement
No potential conflict of interest was reported by the author(s).
Additional information
Funding
References
- Newnham RE, Skinner DP, Cross LE. Connectivity and piezoelectric-pyroelectric composites. Mater Res Bull. 1978;13(5):525–536.
- Tressler JF, Alkoy S, Dogan A, et al. Functional composites for sensors, actuators and transducers. Compos Part A. 1999;30(4):477–482. www.comsol.com
- Rittenmyer K, Shrout T, Schulze WA, et al. Piezoelectric 3-3 composites. Ferroelectrics. 1982;41(1):189–195.
- Galassi C, Roncari E, Capiani C, et al. Processing of porous PZT materials for underwater acoustics. Ferroelectrics. 2002;268(1):47–52.
- Mercadelli E, Galassi C. How to make porous piezoelectrics? Review on processing strategies. IEEE Transactions on Ultrasonics, Ferroelectrics, and Frequency Control. 2020;(1):1. doi:10.1109/tuffc.2020.3006248
- Wu DH, Chien WT, Yang CJ, et al. Coupled-field analysis of piezoelectric beam actuator using FEM. Sens Actu A: Physical. 2005;118(1):171–176.
- Di Gaeta A, Glielmo L, Giglio V. Modeling of an electromechanical engine valve actuator based on ahybrid analytical–FEM approach. IEEE ASME Trans Mechatron. 2008;13(6): 625–637. doi:10.1109/TMECH.2008.2003469
- Li S, Zheng L, Jiang W, et al. Characterization of full set material constants of piezoelectric materials based on ultrasonic method and inverse impedance spectroscopy using only one sample. J Appl Phys. 2013;114(10). doi:10.1063/1.4821107
- Perez N, Andrade M, Buiochi F, et al. Identification of elastic, dielectric, and piezoelectric constants in piezoceramic disks. IEEE Trans Ultrason Ferroelectr Freq Control. 2010;57(12):2772.
- Wang HF, Cao W. Determination of full set material constants from phase velocities. J Appl Phys. 2002;92(8):4578.
- Joo H, Lee C, Rho J, et al. Identification of material constants for piezoelectric transformers by three-dimensional, finite-element method and a design-sensitivity method. IEEE Trans Ultrason Ferroelectr Freq Control. 2003;50(8):965.
- Rupitsch S, Lerch R. Inverse method to estimate material parameters for piezoceramic disc actuators. Appl Phys A. 2009;97:735.
- Zhu S, Jiang B, Cao W. Characterization of piezoelectric materials using ultrasonic and resonant techniques. Proc SPIE. 1998;3341(154). doi:10.1117/12.307996
- Pérez N, Buiochi F, Brizzotti Andrade M, et al. Numerical characterization of piezoceramics using resonance curves. Materials. 2016;9(2):71.
- Kaltenbacher B, Kaltenbacher M, Lerch R, et al. (2000). Identification of material tensors for piezoceramic materials. 2000 IEEE Ultrasonics Symposium. Proceedings. An International Symposium [October 22-25], San Juan, Puerto Rico(n.d.). CH37121. doi:10.1109/ultsym.2000.921501
- Joo H-W, Lee C-H, Rho J-S, et al. Identification of material constants for piezoelectric transformers by three-dimensional, finite-element method and a design-sensitivity method. IEEE Trans Ultrason Ferroelectr Freq Control. 2003;50(8):965–971.
- Boumchedda K, Hamadi M, Fantozzi G. Properties of a hydrophone produced with porous PZT ceramic. J Eur Ceram Soc. 2007;27(13–15):4169–4171.
- Ting RY. Piezoelectric properties of a porous PZT ceramic. Ferroelectrics. 1985;65(1):11–20.
- Eichhorn F, Kakimoto K, Greil P, et al. Influence of porosity orientation on physical properties in porous PZT ceramics. Adv Eng Mater. 2019;21:1900390. doi:10.1002/adem.201900390
- Wersing W, Lubitz K, Mohaupt J. Dielectric, elastic and piezoelectric properties of porous pzt ceramics. Ferroelectrics. 1986;68(1):77–97.
- Rybyanets AN. Porous piezoceramics: theory, technology, and properties. IEEE Trans Ultrason Ferroelectr Freq Control. 2011;58(7):1492–1507.
- COMSOL Multiphysics® v. 6.0. Stockholm Sweden: COMSOL AB; 2021.
- Shin HYL, Hong IG, Kim JH, et al. Submitted for the JAsCeRS, 2022,Sep.
- Huang Y-H, Yen C-Y, Huang T-R. Dynamic non-destructive evaluation of piezoelectric materials to verify on accuracy of transversely isotropic material property measured by resonance method. Appl Sci. 2020;10(15):5072.
- Roscow JI, Lewis RWC, Taylor J, et al. (2017). Finite element modelling of bilayer porous PZT structures with improved hydrostatic figures of merit. 2017 Joint IEEE International Symposium on the Applications of Ferroelectric (ISAF)/International Workshop on Acoustic Transduction Materials and Devices (IWATMD)/Piezoresponse Force Microscopy (PFM) [May 7-11], Atlanta, USA. doi:10.1109/isaf.2017.8000217
- Zeng T, Dong X, Mao C, et al. Effects of pore shape and porosity on the properties of porous PZT 95/5 ceramics. J Eur Ceram Soc. 2007;27(4):2025–2029.
- ZHANG H, LI J, ZHANG B. Microstructure and electrical properties of porous PZT ceramics derived from different pore-forming agents. Acta Materialia. 2007;55(1):171–181.
- Marutake M, Ikeda T. Elastic constants of porous materials, especially of BaTiO3Ceramics. J Phys Soc Jpn. 1956;11(8):814–818.