
 ?Mathematical formulae have been encoded as MathML and are displayed in this HTML version using MathJax in order to improve their display. Uncheck the box to turn MathJax off. This feature requires Javascript. Click on a formula to zoom.
ABSTRACT
This study aims to determine the effect of the sintering temperature of nanosilica on physical, mechanical, dielectric, and output voltage properties. The nanosilica particles used in this experiment were produced using the alkaline fusion method from natural sand. The green bodies were uniaxially formed with a pressure of 75 MPa and then were pressureless sintered at various temperatures of 1330, 1360, 1390, 1420, and 1450°C for 2 hours in an air atmosphere. The results of sintering showed that the highest bulk density and the relative density of 2.49 ± 0.03 g/cm3 and 94.03 ± 0.01% respectively were achieved at a sintering temperature of 1390°C. The XRD patterns of the sintered silica indicated phases of quartz, tridymite, and cristobalite, with the strongest peak corresponding to the cristobalite phase. The highest compressive strength and diametral tensile strength values of 17.23 ± 0.27 MPa and 6.06 ± 0.71 MPa respectively were obtained on specimens sintered at 1390°C. However, the highest values of the dielectric constant of 544.28, dielectric loss of 195.94, and output voltage of 1.58 mV were obtained at a sintering temperature of 1330°C. Various sintering temperatures do not significantly influence the characteristic of dielectric and output voltage of the sintered specimens.
1. Introduction
The development of new and renewable energy is an alternative solution to meet energy needs in various countries. One alternative for small-scale renewable energy is harvesting mechanical energy from various forms of human activity using piezoelectric materials. However, the electrical energy produced is relatively small, so it cannot be used directly. Generally, the energy produced from piezoelectric material is stored first in electrical energy storage in the form of a battery.
Piezoelectric materials are one type of smart materials. Piezoelectric materials are materials that can produce electric energy when mechanical stress is applied, or materials that there will be mechanical deformation or a change in the dimensions of the material when the electric field is applied. Piezoelectric materials are polycrystalline materials that are widely used in transducers, actuators, sensors, and other electronic equipment [Citation1–3]. Piezoelectric materials that have been well known used so far include barium titanate and lead zirconate titanate (Pb(Zr, Ti)O3). Both materials have good piezoelectric properties, high dielectric permittivity, high electromagnetic, and significant piezoelectric coefficient [Citation4,Citation5]. However, both materials have limitations, for example, barium titanate is expensive, and lead zirconate titanate impacts the environment, so it is necessary to look for alternative piezoelectric materials. Recently, the development of piezoelectric materials from natural sources has been receiving great attention from researchers. One of the potential piezoelectric material candidates is silica (quartz) [Citation6]. Silica material has several advantages compared to other materials, such as being safe for the environment, abundant, and widely available in various regions in Indonesia [Citation7].
In the previous study, the authors found that silica sand was taken from Poso, Central of Sulawesi, Indonesia containing elements such as oxides such as SiO2, Fe2O3, Al2O3, TiO2, CaO, MgO, and K2O [Citation8]. In addition, nanosilica synthesized from silica sand using the alkali fusion method has been successfully prepared [Citation8]. Silica is generally a crystalline polymorph. So naturally, silica consists of three main phases, namely the structure of quartz, cristobalite, and tridymite [Citation9]. Silica is widely used in various applications such as the rubber industry [Citation10], concrete mix [Citation11], lithium-ion battery base material [Citation12], environment remediation, biomedical imaging, biosensors, tissue engineering [Citation13], energy storage material [Citation14], dielectric [Citation15]. Silica is one of the natural ingredients that are commonly found in nature, such as quartz sand [Citation8,Citation16], rice husk ash [Citation17], pumice stone, fly ash, wheat straw, bamboo leaf [Citation18], corn cobs, palm kernel shell, coconut shell, sugarcane bagasse [Citation19] and various other minerals. Several methods are used for the synthesis of nanosilica, such as sol-gel [Citation20], hydrothermal [Citation21], sodium silicate solution [Citation22,Citation23], and alkali fusion [Citation8,Citation24]. The alkaline fusion method is a dry method by heating a mixture of natural sand and NaOH at a temperature of 600°C. The advantage of this method is that it can produce more nanosilica than other methods. Several previous research reports the use of nanosilica as a reinforcing material such as cement for high-strength concrete [Citation25]. Nanosilica can improve the mechanical properties of cement and increase abrasion resistance [Citation26]. Although many studies on nanosilica have been carried out, based on the author’s knowledge, research on the effect of sintering temperature on the physical, mechanical and electrical properties of nanosilica synthesized from local silica sand (Poso, Indonesia) has not been reported.
The nanosilica used in this work was synthesized from Poso silica sand using the alkali fusion method as reported by the previous author’s work [Citation8]. The nanosilica was compacted at different sintering temperatures, namely at temperatures of 1330, 1360, 1390, 1420, and 1450°C at a constant pressure of 75 MPa under atmospheric conditions. The effect of sintering temperature on physical, mechanical, and electrical properties was investigated.
2. Materials and Methods
2.1. Materials
The material used is nanosilica synthesized from silica sand using the alkaline fusion method with by assisted of a 200 Hz speaker membrane vibration [Citation8]. Nanosilica with an average size of 207.4 nm and a purity of 99.30% based on the results of the XRF (X-Ray Fluorescence) test. The results of the nanosilica XRF test are shown in . The silica sand was obtained from Poso Regency, Central Sulawesi, Indonesia. The sodium hydroxide and hydrochloric acid used in this work were purchased from Merck.
Table 1. Chemical composition of nanosilica.
2.2. Methods
Nanosilica were mixed with 1% molasses by weight fraction as binder. A uniaxial pressure of 75 MPa is applied in the compaction process to produce green body. The shape of the green body is cylindrical, with a diameter of 15 mm and a thickness of about 2.5 mm. The green body has bulk density and relative density of 1.476 g/cm3 and 55.68%, respectively. The green body is then pressureless sintered with temperature variations of 1330, 1360, 1390, 1420, and 1450°C for 2 hours in a Carbolite furnace in air atmospheric environment. The bulk density of sintered specimens was measured using the Archimedes principle with mercury as the fluid medium. The phases was examined using X-ray Diffraction (Bruker D2 Phaser). The parameters used in the XRD analysis are the increment angle of 0.03°, scanning speed of 3 °/min, and the diffraction angle range of 2θ from 5° to 90°. The microstructures and elements of the sintered specimen were observed using SEM equipped with Energy Dispersion Spectrometer. The specimen for SEM observation were thermally etched on a polished surface at a temperature of 1300 ℃ for 30 minutes. The compressive strength and diametral tensile strength were tested using the Torsee universal testing machine. The method used to measure the compressive strength refers to the ASTM C373-72 standard. The Equationequation (1)(1)
(1) used to calculate the compressive strength is as follows:
where σc is compressive strength, F is the maximum load, and A is the cross-sectional area of the test sample. The diametral tensile strength is determined to follow the ASTM C496-11 standard. The formula (2) used to calculate the diametral tensile strength is as follows:
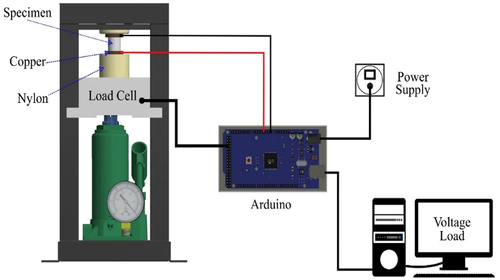
where is diametral tensile strength, P is the maximum load, t is thickness and d is the diameter of the sample. The dielectric properties of the samples were tested using a computerized impedance spectroscopy device with a sine frequency generator producing a modulating frequency in the range of 10 to 500 kHz with an interval of 10 kHz. The piezoelectric properties were examined using Arduino devices. To determine the magnitude of the electrical voltage signal that comes out of the sintered silica due to mechanical stress, the signal characterization is carried out. Arduino as a microcontroller was used to characterize the output signal of nanosilica. The main function of this circuit is as a voltage signal amplifier. The schematic of the piezoelectric test apparatus is shown in .
Figure 1. Schematic of a piezoelectric testing tool.
3. Results and Discussion
3.1. Physical Properties
3.1.1. Crystal Structures
shows the XRD patterns of nanosilica synthesized using alkaline fusion assisted by the vibration of the membrane speaker show that the dominant phase is quartz phase (database_code_amcsd 0000791).
Figure 2. XRD patterns of nanosilica.
shows the XRD patterns of sintered nanosilica at various temperatures of 1330, 1360, 1390, 1420, and 1450°C. It can be seen in that three phases of nanosilica present i.e quartz, cristobalite, and tridymite.
Figure 3. XRD patterns of sintered nanosilica at various temperatures.
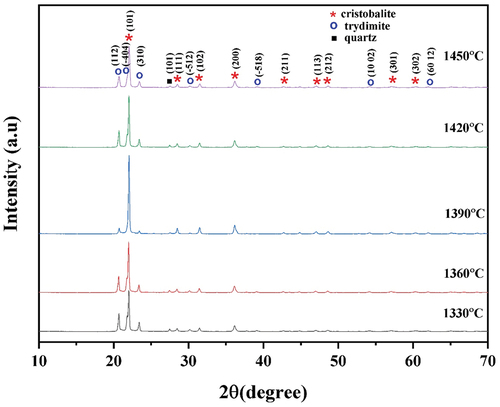
The diffraction patterns show the characteristics of the quartz phase formed at a peak angle of 26,48° according to quartz (database_code_amcsd 000791), the tridymite phase is formed at angles of 20.68, 21.79, 23.40, and 30.19° (database_code_amcsd 0000531). The cristobalite phase formed at 22.01, 28.48, 31.49, 36.15, 47.11, 48.67, 57. 15 and 62.10° (database_code_amcsd 0001629). From the analysis, the phase formed is mostly the cristobalite phase, a little tridymite, and quartz phase, according to previous research [Citation27,Citation28].
3.1.2. Density
In this study, the results of the bulk density and relative density of sintered nanosilica ceramic were obtained at each variation of the sintering temperature. The bulk density of the sintered specimens are in the range of 2.29 g/cm3 – 2.49 g/cm3 as shown in . The bulk density and relative density increase with increasing sintering temperature from 1330 ℃ to 1390 ℃, and then decrease at 1420 ℃ to 1450 ℃. The maximum bulk density of 2.49 ± 0.03 g/cm3 and relative density of 94.03 ± 0.01% are obtained at a sintering temperature of 1390 ℃. The increase in density is due to the occurrence of inter-particle densification or greater particle pooling, while the decrease in bulk density and relative density is due to the increase in porosity, as shown in . The presence of porosity acts as stress concentration causing a decrease in the strength of the material.
Figure 4. Effect of sintering temperature on the bulk density and relative density of sintered nanosilica ceramics.
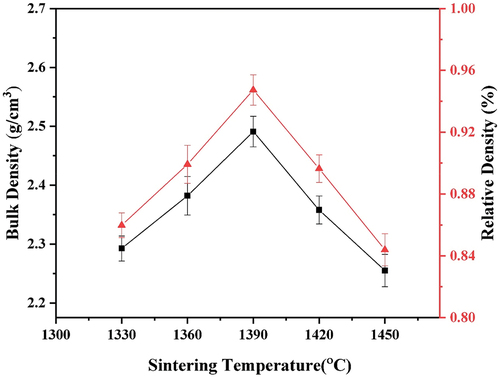
Figure 5. Images of nanosilica observed using: a). SEM and b). TEM.
3.1.3. Microstructure Observations
SEM and TEM were used to observe the morphology of nanosilica powders. In addition, SEM was also used to observe the microstructures of the sintered silica at various sintering temperatures. The microstructures observation may explain the densification process, which is corresponding to the relative density data as shown in to determine the optimum sintering temperature. The optimal temperature produces optimal mechanical properties. and 5b show the SEM and TEM images of silica nanoparticles, respectively. It can be observed that the nanosilica powders have irregular spherical shape and form agglomerations.
Figure 6. SEM images of sintered nanosilica ceramic with various sintering temperatures, a). 1330°C, b). 1360°C, c). 1390°C, d). 1420°C, e). 1450°C.
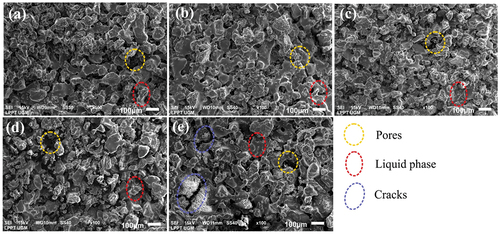
The microstructures of nanosilica ceramic sintered at different temperatures of 1330, 1360, 1390, 1420, and 1450°C can be seen in , 6b, 6c, 6d and 6e. The grain shapes are seem to be relatively uniform. In addition, the grain shapes are irregular and the grain boundaries are also visible. The increase in grain size compared to the particle size is probably caused by the tendency of nanosilica particles to cluster close together, face to face, and the formation of liquid phase during the sintering process so that the bonds between the particles show a strong bond as a result of sintering process. On the other hand, porosity is also formed during sintering. The least porosity formed is at a sintering temperature of 1390°C, and it can be concluded that the optimum sintering temperature is at a temperature of 1390°C. In general, the microstructures of sintered nanosilica ceramics show the presence of a liquid phase. This result is in line with research on sintered silica ceramics at sintering temperature of 1200–1350°C that produce a liquid phase [Citation29]. The liquid phase is probably produced by the present of small amount of oxide impurities in the nanosilica sample such as calcium oxide (CaO), titanium oxide (TiO2), nickel oxide (NiO), copper oxide (CuO), zinc oxide (ZnO), iron oxide (Fe2O3) and barium oxide (BaO). The liquid phase will increase the bond between grains and can improve the mechanical properties of sintered nanosilica ceramics. These results are in line with the study of silica-based ceramics sintered at high temperatures resulting a liquid phase which improves the bonding between grains and the mechanical properties [Citation30]. In addition, during cooling the cristobalite phase undergoes a phase transformation from -cristobalite to
-cristobalite which leads to the formation of micro-cracks which can further reduce the strength [Citation31].
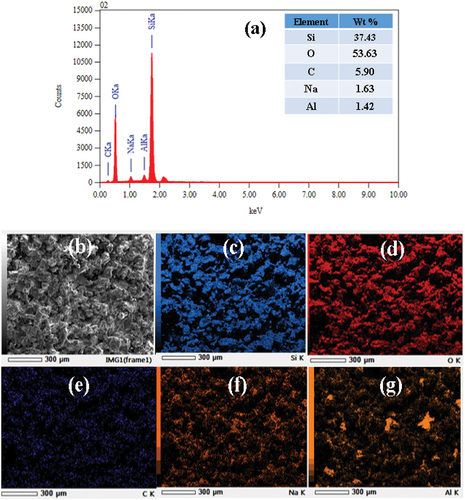
In the sintered nanosilica ceramics with sintering temperatures of 1420°C and 1450°C, besides porosity, cracks are also clearly visible. This is due to the phase transformation process from quartz to tridymite or tridymite to cristobalite. -7 g show the EDS and mapping analysis results of nanosilica ceramics sintered at 1390°C. Most elements are silicon and oxygen, with small amount impurities of sodium, carbon, and aluminum. The amount of carbon content in the sample probably comes from the molasses binder trapped in the sample.
Figure 7. SEM/EDS test results of nanosilica at sintering temperature of 1390°C.
a). Element distribution result EDS, b). Image SEM c). Element Si, d). Element O, e). Element C, f). Element Na and g). Element Al.
3.2. Mechanical Properties
3.2.1. Compressive Strength
The results of the compressive strength test of the specimens as a function of sintering temperature are shown in .
Figure 8. Effect of sintering temperature on compressive strength and diametral tensile strength of sintered nanosilica ceramics.
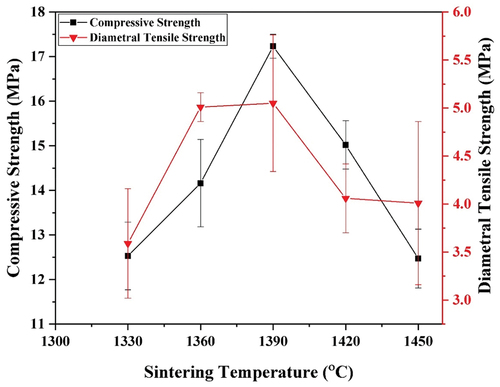
The compressive strength increases with increasing sintering temperature from 1330 to 1390 ℃, and then it decreases as the sintering temperature increases from 1390 to 1450 ℃. The maximum compressive strength of 17.23 ± 0.27 MPa occurs on the specimen sintered at 1390℃. The increase in compressive strength from sintering temperature from 1330 to 1390 ℃ is due to the increase in relative density which is indicating the densification process occurred. At above 1390 ℃ the relative density decreases due to the presence of porosity. This porosity takes a role as stress concentration and yields decreasing compressive strength. The results of this study are consistent with the results reported by previous researchers where porosity and densification greatly affect the mechanical strength of ceramics [Citation28,Citation32].
3.2.2. Diametrical Tensile Test
The results of the diametral tensile test of the specimens as a function of sintering temperature are shown in . Similar to the results of compressive strength, the diametral tensile strength also increases as the sintering temperature increases from 1330 to 1390 ℃, and then it decreases as the sintering temperature decreases from 1390 to 1450 ℃. The maximum diametral tensile strength of 6.06 ± 0.71 MPa occurs on the specimen sintered at 1390℃. The increase in diametral tensile strength from sintering temperature from 1330 to 1390 ℃ is due to the increase in relative density which is indicating the densification process occurred. At above 1390 ℃ the relative density decreases due to the presence of porosity. This porosity takes a role as stress concentration and yields decreasing diametral tensile strength. These results are in agreement with previous results where porosity and densification greatly affect the mechanical strength of ceramics [Citation28,Citation32].
3.3. Dielectric Properties
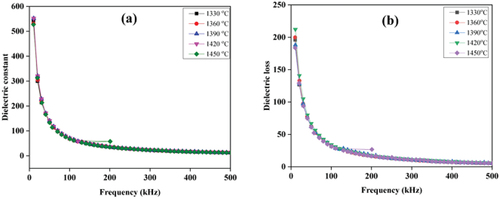
shows the dielectric constant and dielectric loss as a function of frequency for all samples at room temperature in the frequency range from 10 to 500 kHz with an interval of 10 kHz. The dielectric constant and dielectric loss properties can be observed in , which has a high value of the dielectric constant and dielectric loss at a low frequency. The dielectric constant and dielectric loss decrease significantly up to a frequency of 100 kHz. At above 100 kHz, the dielectric constant and dielectric loss decreases slowly and are almost constant at high frequency. This phenomenon is one of the characteristics of dielectric materials. At low frequencies, various types of polarization in materials such as dipolar, ionic, electronic, and interfaces can be generated easily by the influence of electric fields/potential differences. The sample consists of two main parts, namely grains and grain boundaries. Grains are areas that have small resistance due to their perfect crystalline nature, while in the grain boundary region, they have high resistance due to interfacial polarization occurring in the grain boundary region. Dielectric properties as shown in , where the highest dielectric value occurs at a temperature of 1330°C. This is because nanosilica at high temperatures can cause a decrease in dielectric properties. The large crystal size may influence the reduced dielectric properties of nanosilica. The larger the crystal size, the larger the grain size, causing the grain boundaries to decrease. As a result, the grain boundary is reduced, causing the continuity of polarization to occur in the sample. These results are in line with previous studies that have reported that other factors that affect the value of dielectric materials are defects, residual stresses at the interface, grain boundaries, particle size, the existence of the second phase and variations in crystal structure parameters [Citation8,Citation33–36]. At temperatures of 1330, 1360, 1390, 1420 and 1450°C the dielectric constant values were 544.28, 544.19, 530.90, 540.28 and 527.36, respectively, while the dielectric losses are 195.94, 199.85, 188.094, 200.18, and 183.69, respectively.
Figure 9. Frequency-dependent plot of permittivity for sintered nanosilica ceramic with variations of sintering temperature, (a) dielectric constant, and (b) dielectric loss.
3.4. Output Voltage
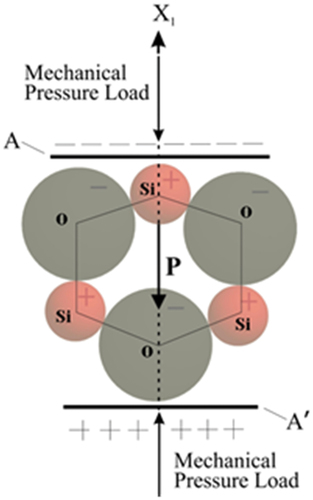
To determine the magnitude of the electrical voltage signal that comes out of the sintered nanosilica ceramics due to mechanical stress, it is necessary to characterize the signal. The tool used to characterize the output signal from the sintered nanosilica ceramics uses Arduino as a microcontroller. The primary function of the signal conditioning circuit is as a voltage signal amplifier. The magnitude of the electrical voltage signal generated by sintered silica ceramics is small so that in order to the voltage signal can be read, a signal conditioning circuit is needed. Based on the test results on the sintered nanosilica ceramic material, it appears that when mechanical stress is applied, it produces an electric voltage, and vice versa, when the mechanical stress is released (stress-free condition), the voltage produced by the sintered nanosilica ceramic drops quickly. This phenomenon indicates the presence of piezoelectric properties. The mechanism of appearing of electrical voltage on the sintered nanosilica ceramic material, if the sintered silica nano ceramic material is subjected to mechanical stress along the X-axis direction, as shown in , the upper silicon ion will shift between the two oxygen ions, and the lower oxygen ion will shift between the two lower silicon ions. The movement of positive ions and negatively charged ions from the cell structure toward each other causes electrical polarization [Citation37]. Quartz, cristobalite, and tridymite phases of silica have piezoelectric properties because their structures do not have an inverted center of symmetry, and opposite sides have structurally distinct surfaces and carry opposite electrical charges [Citation38]. In general, polycrystalline ceramics do not have piezoelectricity and ferroelectricity before polarization occurred [Citation39].
Figure 10. Direct piezoelectric effect within the simplified unit cell of sintered nanosilica ceramic longitudinal piezoelectric effect.
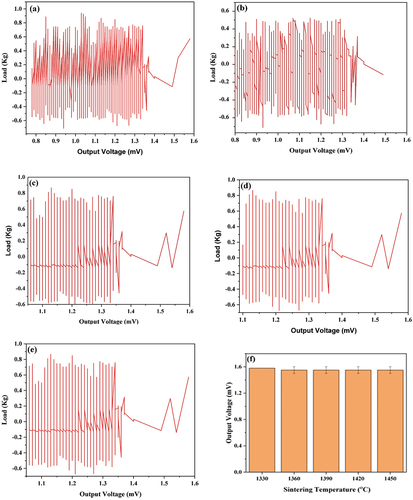
The comparison of the output voltages obtained from the sintered nanosilica ceramic material at various temperatures can be seen in . The output voltage on the sintered nanosilica ceramics with sintering temperatures of 1330, 1360, 1390, 1420, and 1450°C are 1.58 mV, 1.48 mV, 1.48 mV, 1.48 mV, and 1.48 mV, respectively. There is no significant difference in the output voltage due to the absence of differences in the crystal structure of sintered nanosilica ceramics at each sintering temperature, as shown in . Another factor that affects the output voltage is the density and particle size. Density and grain size influence the piezoelectric effect of any ceramic material [Citation3,Citation40].
Figure 11. Signal display of the sintered nanosilica ceramic measurement results at sintering temperature variations of a) 1330°C, b) 1360°C, c) 1390°C, d) 1420°C, e) 1450°C, and f) maximum output voltage at each sintering temperature variation.
4. Conclusion
The sintering temperature has an important influence on the densification process indicated by the relative density. The bulk density, relative density, compressive strength, and diametral tensile strength increase with increasing sintering temperature from 1330 to 1390 ℃. The maximum value of the bulk density, relative density, compressive strength, and diametral tensile strength occur on the specimen sintered at 1390 ℃ i.e 2.49 ± 0.03 g/cm3, 94.03 ± 0.01%, 17.23 ± 0.27 MPa and 6.06 ± 0.71 MPa, respectively occur on the specimen sintered at 1390 ℃. At the above sintering temperature of 1390 ℃ the bulk density, relative density, compressive strength, and diametral tensile strength decrease. The highest values of the dielectric constant of 544.28, dielectric loss of 195.94, and output voltage of 1.58 mV were obtained at a sintering temperature of 1330°C. The characteristic of dielectric and output voltage of the sintered specimens are no significantly influenced by various sintering temperatures.
Acknowledgments
This work was supported by the Ministry of Education, Culture, Research and Technology of the Republic of Indonesia and the Indonesia Endowment Fund for Education (LPDP) with contract number KET-574/LPDP.4/2020.
Disclosure Statement
No potential conflict of interest was reported by the author(s).
Additional information
Funding
References
- Chen Y, Ye H, Wang X, et al. Grain size effects on the electric and mechanical properties of submicro BaTiO3 ceramics. J Eur Ceram Soc. 2020;40(2):391–400.
- Wang J, Wu Y, Yang Z, et al. Design and experimental performance of a low-frequency piezoelectric motor based on inertia drive. Sens Actuat A: Phys. 2020;304:111854.
- Hu S, Luo C, Li P, et al. Effect of sintered temperature on structural and piezoelectric properties of Barium Titanate ceramic prepared by nano-scale precursors. J Mater Sci. 2017;28(13):9322–9327.
- Zhang Y, Chen L, Zeng J, et al. Aligned porous barium titanate/hydroxyapatite composites with high piezoelectric coefficients for bone tissue engineering. Mater Sci Eng C. 2014;39(1):143–149.
- Gao J, Xue D, Liu W, et al. Recent progress on BaTiO3-based piezoelectric ceramics for actuator applications. Actuators. 2017;6(3):3.
- Tichy J, Erhart J, Kittinger E, et al. Fundamentals of Piezoelectric Sensorics. Verlag Berlin Heidelberg: Spinger; 2010. p. 1–13.
- Ismail A, Saputri LNMZ, Dwiatmoko AA, et al. A facile approach to synthesis of silica nanoparticles from silica sand and their application as superhydrophobic material. J Asian Ceram Soc. 2021;9(2):665–672.
- Hamzah MS, Wildan MW, Kusmono,et al. Synthesis of Silica Nanoparticles from Silica Sand via Vibration Assisted Alkaline Solution Method. Inter J Engin Tran A. 2022;35(5): 1300–1306
- Vatalis KI, Charalambides G, Benetis NP, et al. Market of high purity Quartz innovative applications. Procedia Econ Finance. 2019;24:734–742.
- Torbati FN, Hosseini SM, Razzaghi KM. Effect of the silica-rubber interface on the mechanical, viscoelastic, and tribological behaviors of filled styrene-butadiene rubber vulcanizates. Polym J. 2020;52(10):1223–1234.
- Ahmad S, Baghabra Al-Amoudi OS, Khan SMS, et al. Effect of silica fume inclusion on the strength, shrinkage and durability characteristics of natural pozzolan-based cement concrete. Case Studies Construction Mater. 2022;17(February):01255.
- Favors Z, Wang W, Bay HH, et al. Scalable synthesis of nano-silicon from beach sand for long cycle life Li-ion batteries. Sci Rep. 2014;4(1):1–7.
- Sarkar J, Mridha D, Sarkar J, et al. Biocatalysis and Agricultural Biotechnology Synthesis of nanosilica from agricultural wastes and its multifaceted applications: a review. Biocatal Agric Biotechnol. 2021;37(September):102–175.
- Jittabut P. Effect of nanosilica on mechanical and thermal properties of cement composites for thermal energy storage materials. Adv Mater Res. 2015;1131:182–185.
- Mentlík V, Michal O. Influence of SiO2 nanoparticles and nanofibrous filler on the dielectric properties of epoxy-based composites. Mater Lett. 2018;223:41–44.
- Wahyudi A, Dessy A. Preparation of Nanosilica from Silica Sand Through Alkali Fusion. Indonesian Min J. 2013;16(3):149–153.
- Carmona VB, Oliveira RM, Silva WTL, et al. Nanosilica from rice husk: extraction and characterization. Ind Crops Prod. 2013;43(1):291–296.
- Chen H, Wang F, Zhang C, et al. Preparation of nano-silica materials: the concept from wheat straw. J Non-Crystalline Solids. 2010;356(50–51):2781–2785.
- Boonmee A, Jarukumjorn K. Preparation and characterization of silica nanoparticles from sugarcane bagasse ash for using as a filler in natural rubber composites. Polym Bull. 2020;77(7):3457–3472.
- Owoeye SS, Abegunde SM, Oji B. Effects of process variable on synthesis and characterization of amorphous silica nanoparticles using sodium silicate solutions as precursor by sol–gel method. 2021;Nanostructures Nano-Objects. 25:100625.
- Potapov V, Efimenko Y, Fediuk R, et al. Effect of hydrothermal nanosilica on the performances of cement concrete. Constr Build Mater. 2021;269:121–307.
- Owoeye SS, Jegede FI, Borisade SG. Preparation and characterization of nano-sized silica xerogel particles using sodium silicate solution extracted from waste container glasses. Mater Chem Phys. 2020;248:122915.
- El-Didamony H, El-Fadaly E, Amer AA, et al. Synthesis and characterization of low cost nanosilica from sodium silicate solution and their applications in ceramic engobes. Boletin de la Sociedad Espanola de Ceramica y Vidrio. 2020;59(1):31–43.
- Wahyudi A, Amalia D. Preparation of nanosilica from silica sand through alkali fusion process. Indonesia Min J. 2014;16:149–153.
- Haruehansapong S, Pulngern T, Chucheepsakul S. Effect of the particle size of nanosilica on the compressive strength and the optimum replacement content of cement mortar containing nano-SiO2. Constr Build Mater. 2014;50:471–477.
- Fu C, Guo R, Lin Z, et al. Effect of nanosilica and silica fume on the mechanical properties and microstructure of lightweight engineered cementitious composites. Constr Build Mater. 2021;298:123788.
- Yang X, Lu D, Zhu B, et al. Phase transformation of silica particles in coal and biomass combustion processes. Environ Pollut. 2022;292(PA):118312.
- Zhong X, Cao L, Huang J, et al. Formula optimization and mechanical properties of thin porcelain ceramic plates mainly containing smoky quartz tailings. Ceram Int. 2022;48(16):24056–24062.
- Sembiring S, Riyanto A, Rumiyanti L, et al. Effect of sintering temperature on the structural and physical properties of forsterite using amorphous rice husk silica as refractory precursors. J Aust Ceram Soc. 2020;56(2):433–440.
- Zheng W, Wu J, Chen M, et al. Improved mechanical properties of SiC fiber reinforced silica-based ceramic cores fabricated by stereolithography. J Mater Sci Technol. 2022;116. 161–168.
- Zheng W, Wu JM, Chen S, et al. Improved mechanical properties of SiB reinforced silica-based ceramic cores fabricated by 3D stereolithography printing. J Ceramics Int. 2022;48(15):21110–21117.
- Jurgelane I, Buss A, Putnina M, et al. Effect of sintering temperature on sorption properties and compressive strength of calcium phosphate ceramic granules. Mater Lett. 2021;282:128858.
- Kumar S, Supriya S, Pradhan LK, et al. Grain size effect on magnetic and dielectric properties of barium hexaferrite (BHF). Physica B. 2020; 579: 411908.
- Chomyen P, Potong R, Rianyoi R, et al. Microstructure, dielectric and piezoelectric properties of 0–3 lead free barium zirconate titanate ceramic-Portland fly ash cement composites. Ceram Int. 2018;44(1):76–82.
- Khattab RM, Abo-Almaged HH, Sadek HEH. Effects of some extracted oxides on silica fume waste for mullite preparation: physical, mechanical, optical, magnetic, and dielectric properties. Mater Chem Phys. 2022;281(February):125880.
- Munidepalli VR, Feng L, Lin W, et al. Effect of grain size on dielectric and ferroelectric properties of nanostructured Ba0.8 Sr0.2 TiO3 ceramics. J Adv Ceram. 2015;2015:46–53.
- Ballas RG. The Piezoelectric Effect - An Indispensable Solid State Effect for Contemporary Actuator and Sensor Technologies. IOP Conference Series: Earth and Environmental Science, Chengdu, China. 2021; 1775.
- Williamson BJ, Pastiroff S, Cressey G. Piezoelectric properties of quartz and cristobalite airborne particulates as a cause of adverse health effects. Atmospheric Environment. 2001;35(20):3539–3542.
- Li S, Liu J, Guo T, et al. Piezoelectricity and flexoelectricity of sodium bismuth titanate-based ceramics. Ceram Int. 2020;46(2):2049–2054.
- Jain A, Panwar AK, Jha AK, et al. Influence of milling duration on microstructural, electrical, ferroelectric and piezoelectric properties of Ba0.9Sr0.1Zr0.04Ti0.96O3 ceramic. Ceramics International. 2016;42. 18771–18778.