
 ?Mathematical formulae have been encoded as MathML and are displayed in this HTML version using MathJax in order to improve their display. Uncheck the box to turn MathJax off. This feature requires Javascript. Click on a formula to zoom.
ABSTRACT
In this report, I studied the structural, morphological, and dielectric properties of new ferroelectric compounds prepared according to the formula Ba0.95Sr0.05Ti1-ySnyO3. The solid-state reaction method enhanced by a high-efficiency metal ball mill was used in the preparation process. The quantitative and qualitative analysis of the XRD patterns confirmed the crystallization of the samples y = 0.00, 0.05 in the tetragonal crystal system and the presence of the tetragonal and cubic crystal systems together in the samples y = 0.10, 0.14. Formation of BaSnO3 impurities in very low percentages in the doped samples. Their prevalence increases with increasing tin content, reaching 8.7% at the ratio y = 0.14. SEM images of the ceramic samples showed the formation of nano-ceramics with a high degree of condensation at the doping ratio y = 0.05. The dielectric analyses showed high thermal stability in the dielectric properties of the ceramic samples y = 0.05, 0.10, which was shown by the flatness of the dielectric constant curve over the entire temperature range studied, where this stability is attributed to the structure of the nano-grains that resist the ferroelectric-paraelectric phase transition. Furthermore, the dielectric properties were interpreted by accurately linking the dielectric measurements with the nano-structural and polar properties.
1. Introduction
Ferroelectric materials are classified as a special group of smart piezoelectric materials. In addition to their distinctive electromechanical properties, they possess the property of spontaneous polarization that can be directed and reversible, which is demonstrated by the ferroelectric Hysteresis Loop, which accurately describes the state of polarization in the material, and the extent to which it is affected by external and internal factors. Most ferroelectric materials have a perovskite structure in its simplest form, known as the general formula ABO3 [Citation1]. The most important characteristic of perovskite compounds is the ease and diversity of preparation methods, in addition to the possibility of modifying and controlling their structural, morphological and electrical properties through qualitative and quantitative doping, and modifying mechanical and thermal preparation conditions [Citation2]. Barium titanate is considered the first ferroelectric material discovered and the most studied and developed. It is the basis for a large number of studies and applications [Citation3]. It has gained wide fame as a ferroelectric ceramic due to its thermal and mechanical stability, its tolerance to various working conditions, its chemical inertness, the possibility of controlling and controlling its properties through doping, modifying preparation conditions, or both together, in addition to its possession of a relatively high Curie point located around 125°C [Citation4,Citation5]. The unique properties of BaTiO3 have been exploited in many medical, industrial, advanced technology, and microelectronics applications. The various applications of these compounds depend on their insulating, ferroelectric, and piezoelectric properties, as well as, its depend on their stability and their sensitivity to external factors such as frequency, temperature, and other factors. Piezoelectric properties have played a fundamental role in the use of BaTiO3 compounds in the medical diagnostic and therapeutic field. They were the basis used in ultrasound imaging devices, in addition to their use in crushing kidney and urinary tract stones, stimulating bone growth, and accelerating the healing of bone fractures [Citation6,Citation7]. Barium titanate nanoparticles (BTPNs) have been used to stimulate cells using electrical signals. Recent studies have shown the high effectiveness of BTPNs in inhibiting breast cancer cells, which makes them of great importance as nanomedicines in biomedical applications [Citation8,Citation9]. The fact that barium titanate retains its unique properties even when used in minuscule dimensions has made it of great significance in microelectromechanical systems and ceramic capacitors (MLCCs) that provide high storage capacity in minuscule dimensions. On the other hand, the widespread and rapid infusion of artificial intelligence technologies into various spheres of daily life has resulted in a substantial uptick in the demand for high-performance memory chips. These chips must be small, have large storage capacity, consume low power, have high thermal stability across different temperatures, and have rapid data transfer and processing capabilities. Ferroelectric memories possess the unique ability to satisfy all these essential requirements [Citation10,Citation11]. Many studies have been conducted to control and develop the properties of BaTiO3, and doping has occupied a prominent position among the studies, both quantitatively and qualitatively, followed by preparation methods and conditions. The location of the impurity atoms in the crystal structure of BaTiO3 depends on the ionic radius of the impurities and the valence state [Citation12–15]. Perovskites have a wide variety of atomic substituents on the form of divalent cations in the A site and tetravalent cations in the B site. As a result, many elements have been used in the doping of barium titanate in order to improve and develop its structural and electrical properties [Citation16]. Strontium ions and tin ions are among the most famous of these alternatives, as doping with one of them leads to improving the dielectric properties, so the dielectric constant values increase, the loss factor values decrease, and the phase transition point shifts to lower temperatures as the dopant content increases [Citation17,Citation18]. On the contrary, Sr2+ and Sn4+ differ in the way they affect the structural properties. The strontium ions lead to a decrease in the dimensions of a unit cell, while the dimensions of a unit cell expand upon doping with tin [Citation18–20]. Accordingly, the solid state reaction method was used to prepare new ferroelectric compounds from barium titanate ceramics doped with fixed proportions of strontium and variable proportions of tin according to the formula Ba0.95Sr0.05Ti1-ySnyO3 for proportions y = 0, 0.05, 0.10, 0.14. An in-depth study was conducted on the structural, electrical, and morphological properties of the prepared compounds to discover new properties and a broader understanding of the phenomenon of stability of electrical insulation properties over the studied temperature range and its relationship to the prevailing crystal system, impurities, dimensions of ceramic grains, relative density and other factors.
2. Experimental
2.1. Samples preparation
We used high-purity raw materials of BaCO3 (Prolabo, 99%), SrCO3 (Merck, 99.9%), SnO2 (Prolabo, 99%), and TiO2 (Sisco Research Laboratories, 99.97%) to prepare solid solution nanopowders of Ba0.95Sr0.05Ti1-ySnyO3 at doping ratios (y = 0.00, 0.05, 0.10, 0.14) by the solid-state reaction method enhanced by a high-efficiency metal ball mill, which plays a major role in obtaining a homogeneous structure and nanoscale dimensions of the prepared solid solution. The sample preparation process was completed in several stages, including carefully weighing the required quantities of each substance based on its molecular weight. Then, mechanical preparation of the weighed powders was carried out by mixing and grinding them using a metal ball mill for 14 hr after immersing them in pure alcohol to obtain the highest degree of homogeneity and smoothness. This process was followed by getting rid of the pure alcohol by heating the samples at a temperature of 100°C for 2 hr, and then the samples were calcined at a temperature of 1100°C for 2 hr to start the reaction between the raw materials to form the target compound and get rid of the volatile materials. The high-efficiency metal ball mill was again used to obtain the highest levels of fineness and uniformity of the powder resulting from calcination. Ceramic discs were prepared from the prepared compositions after mixing specific amounts of powders with a polyvinyl alcohol binder at a rate of 7% by weight of the sample and pressed into a mold with a diameter of 15 mm and a thickness of 2 mm. Thermal treatment of the discs was carried out to form a solid and cohesive ceramic structure through the sintering process at a temperature of 1100°C for 3 hr. The sintering process included holding the temperature at 500°C for an hour to get rid of the bonding material. The surface of the ceramic discs was polished, their morphological properties were studied, and in the final stage they were coated using silver plating to study their electrical properties.
2.2. Characterization techniques
The PHILIPS PW 1840 was used to study the structural properties of the prepared solid solutions through X-ray diffraction measurements within the angular range (20°-85°) and a step size of 0.05°. The apparatus is based on a copper anode that emits CuKα radiation at wavelength λ = 1.54056Å using an operating voltage of 40kV and a current of 45 mA. Specialized software was used to analyze X-ray diffraction (XRD) patterns and accurately measure crystal structure parameters to detect any changes in the crystal system, unit cell parameters, and nanoscale properties. Among the programs used for diffraction pattern analysis is PANalytical X’pert, which enables us to measure the parameters of the unit cell, the dominant crystal system, or crystal systems and their presence in the material and detect additional structures using the Rietveld method. Origin software was also used for the precise analysis of diffraction peaks (peak positions, and peak width at mid-intensity) to identify the Nano-structural properties of the crystal structure by measuring the crystallization size D(nm) and strain ε induced by crystalline stresses. The morphological characteristics and atomic structure of the surface of ceramic samples were studied using the Tescan VEGA XMU device, which includes an SEM scanning electron microscope and EDX spectroscopy. The SEM microscope image data were analyzed using the ImageJ image analyzer to obtain the number and dimensions of the crystal grains formed within an estimated area of 8.7 µm2 of the sample surface. The dielectric properties of the ceramic samples were studied in the frequency range (20 kHz-3 MHz) using a MICROTEST 6379 LCR meter, and a programmable laboratory oven was used to study the effect of temperature change on the electrical properties of the ceramic samples in the range (RT-150°C).
3. Results and discussion
3.1. XRD analyses
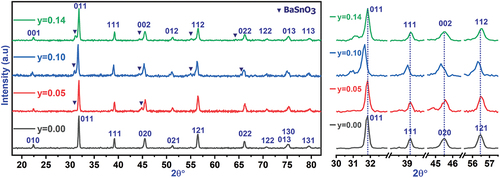
XRD pattern analyses confirmed the completion of the reaction between the raw materials and the formation of the crystal structure of the prepared solid solution. The added proportions of tin affected the locations, intensity, and shape of the main peaks in the diffraction patterns. shows the changes in the diffraction peaks due to the effect of placing tin ions in place of titanium ions in the center of a unit cell at position 1b of the P4mm space group for the tetragonal crystal system or position 1b of the Pmm space group for the cubic crystal system. At tin ratio x = 0.05, there is no obvious and significant change in the peak positions compared to the peak positions in the pure sample, and the modification is mainly limited to the shape and width of the peaks at mid-intensity, which confirms the effect of doping on the crystallization size and the stresses and strains formed within the structure. In contrast, the diffraction peaks are displaced toward the lower angles at higher ratios of tin x = 0.10, which indicates the expansion of the dimensions of the unit cell by the effect of the large Ionic radius of tin (ri = 0.83 Å) compared to titanium (ri = 0.745 Å), which replaces it. In addition, new peaks appear in the diffraction pattern with a low intensity. Careful analysis of these peaks confirmed that they belong to the BaSnO3 compound. Previous studies have confirmed the formation of this compound at elevated temperatures starting from 1300°C. It is possible to explain its appearance in the prepared crystal structure to the great effectiveness of the mechanical preparation of the powders involved in the reaction and the effect of the nanoscale dimensions of the powders on the preparation process, which contribute to a significantly reduced melting point of the compounds involved in the reaction, which was confirmed by previous studies [Citation21,Citation22]. The intensity of the peaks indicating the formation of Barium stannate inclusions increases at the higher ratio of tin x = 0.14, which corresponds to the higher proportion of these crystallized inclusions in the prepared solid solution, and its direct effect on the amount of tin dissolved in the Ba0.95Sr0.05Ti1-ySnyO3, which decreases in favor of the formation of the new compound, which is confirmed by the shift of the XRD peaks toward large angles as a result of decreasing unit-cell dimensions, which only occurs in the case of decreasing proportions of dissolved tin in the crystal structure of the prepared solid solution.
Figure 1. XRD patterns of the solid solution and highlight the changes in the main peaks.
3.1.1. Structural & quantitative analysis
The HighScore Plus software was used to determine the parameters of a unit cell, the crystal system, and the space group in the structure. In addition, Rietveld refinement of the diffraction patterns shown in was used for quantitative phase analysis to determine the dominant crystal systems in the structure, the extent of their prevalence, and the proportions of additional structures in the material, if any. Analysis of XRD patterns of the prepared samples showed that the tin-free structure Ba0.95Sr0.05TiO3 crystallizes in the fully tetragonal crystal system which is consistent with the literature [Citation2,Citation23]. At the doping ratio x = 0.05, the crystal structure preserves the tetragonal crystal system, while the dimensions of a unit cell expand, as shown in , and some additional peaks formed in the diffractogram with very low intensity, which the analysis confirmed to be due to the formation of 1.3% BaSnO3 impurities with a cubic crystal system. The concentration of BaSnO3 inclusions increases with increasing tin content until it reaches 8.7% at x = 0.14 as shown in . The structure tends to form this compound as a result of the disruption of the crystal structure due to the effect of double doping at the A and B sites in the perovskite structure of BaTiO3, where Sr ions with small ionic radius and Sn4+ with large ionic radius replace Ba and Ti ions, respectively, causing crystal stresses, structural distortions, and disorganization of atoms during the reaction process of the raw materials during calcination [Citation24,Citation25]. The structure tends to stabilize by reducing the ratios of Sn4+ dissolved in the compound Ba0.95Sr0.05Ti1-ySnyO3 in favor of forming the structure of the compound BaSnO3, which supports this perception is the shift of the peaks of diffraction patterns toward high angles after the displacement direction was at ratios less than x = 0.14 toward low angles. The BaSnO3 impurity has a cubic structure with relatively large unit cell dimensions (a = 4.086–4.111Å), as shown in , which is consistent with the data reported in the literature [Citation26,Citation27]. Furthermore, the proportion of the cubic system in the structure decreased from 44% at x = 0.10 to 34% at x = 0.14. The percentage of solid solution crystallization was determined using the relation [Citation28,Citation29]: , and the results were organized in , which shows a high crystallization ratio of solid solutions in the studied samples and decreases slightly with increasing tin content may be the result of a shift of the melting point of the solid solution at the ratio x = 0.14 toward high temperatures and its direct effect on the calcination time and temperature, which must also increase until the interaction between the raw materials is complete and the crystallization of the entire material [Citation21,Citation30].
Figure 2. Rietveld refinement analyses of XRD patterns taken for the solid solution Ba0.95Sr0.05Ti1-ySnyO3.
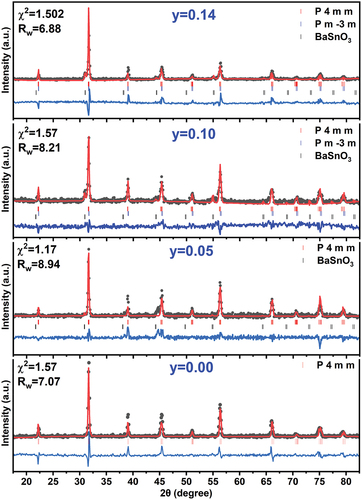
Figure 3. Lattice parameters and dominant phases in the structure for different Sn ratios.
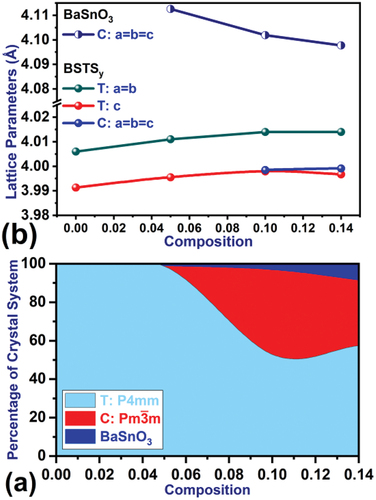
Table 1. Unit cell parameters, dominant crystal system, proportion of phases formed in the structure, crystallization size, and strain.
3.1.2. Crystallization size and strain
Various methods of analysis of the peaks of XRD patterns help us understand the nanoscale structural properties of crystalline size D(nm) and lattice strain ε, which is a measure of the degree of deformation in the crystal structure, structural deformations lead to the distribution of the values of the Crystal Dimension d around the value of dhkl in the ideal case, and the value δd is taken. The relative change in crystal dimension represents the amount of strain ε, and dhkl represents the spacing between crystal planes (hkl). According to the Bragg relation in diffraction
fluctuations in δd cause the peaks to broaden at mid-intensity [Citation31]. The fluctuations are within crystal grains or as a grain-to-grain fluctuation. The size-strain plot method is one of the most important methods used to study the crystallization size and strain in the crystal structure. This method is distinguished from others by giving more accurate average values of crystallization size D(nm) and strain ε. By assigning less weight to the measured data at large angles, where the accuracy is usually lower, the main dependence is on the peaks corresponding to low angles according to the following relationship [Citation31,Citation32]:
Where k is a constant that depends on the shape of the particle and usually takes the value 3/4, λ is the wavelength of the rays used in the study. Changes of as a function of
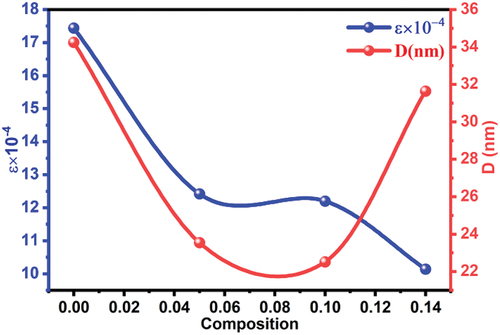
were plotted for all ratios prepared and shown in . While shows the changes in the crystallization size and strain as a function of the doping ratios. Analysis results for all samples are organized in . Experimental measurements showed that the crystallization size D decreases with the effect of tin doping for ratio y = 0.05, where tin ions form attraction centers for neighboring atoms during the reaction process between starting materials and thermal decomposition of compounds, leading to the formation of a large number of Nano-crystalline grains in the material. At higher ratios of tin, the crystallization size decreases because the number of Nano-crystalline grains increases with increasing Sn4+ ratios in the material. For the higher ratio y = 0.14, the crystallization size increases by the effect of the fusion of crystalline grains and their growth in all directions, and their dimensions expand by the effect of the large ionic radius of Sn. The positioning of tin Sn4+(ri = 0.83 Å) in place of titanium Ti4+(ri = 0.745 Å) in the crystal structure of the solid solution Ba0.95Sr0.05Ti1-ySnyO3 in high proportions causes structural deformations resulting from the change in the dimensions of the crystal lattice constants and the imbalance in the regularity of atoms, the experimental results show that the addition of tin at low ratios causes a decrease in strain in the structure due to the formation of nano-dimensional crystal grains possessing a regular atomic structure, it is observed in , that the highest value of crystal strain was at y = 0.00 due to the effect of dislocations, vacancies, and atomic disorder within the crystalline grains, which increases as the dimensions of the grains increase.
Figure 4. The size-strain plots for Ba0.95Sr0.05Ti1-ySnyO3 solid solution.
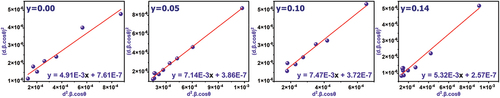
Figure 5. Crystallization size and strain changes as a function of doping ratios.
3.2. Morphological study
3.2.1. SEM analysis
The most important characteristic of ceramic materials is their microscopic and nanostructure. The microscopic structure arises during the sintering process of tablets prepared from highly fine and pure powders that have been subjected to uniaxial press molding in a 15 mm diameter mold at a pressure of 5 tons/cm2. The sintering process results in forming single or multi-crystalline ceramic grains composed of compact or contiguous grains of specific shapes and sizes that are related to the fineness of the powders used, the atomic composition and crystal system of the sample, and the time and temperature of the sintering [Citation28]. Sintering helps to eliminate air pockets, isolate them, and reduce the amount of stresses formed in the crystal structure at the microscopic level [Citation33]. The dielectric, and ferroelectric properties are directly affected by both the size of the ceramic grains and the free surface of these grains, as well as the pores formed in the structure, which are treated as a second phase formed within the main structure [Citation34,Citation35]. shows the SEM microscopic images taken from the surface of the prepared ceramic discs and the accompanying statistical charts that show the range of distribution of the dimensions of the ceramic particles, and their average dimensions. From the image of the pure sample, we find the formation of ceramic grains close together with clear boundaries interspersed with some pores. The accompanying statistical chart shows the presence of some ceramic grains with average dimensions exceeding 250 nm that do not appear in the rest of the proportions. The morphological properties are affected by the addition of tin. At a ratio of y = 0.05, the size of the ceramic particles decreases significantly, and most of them are distributed within the nanoscale range extending from 69 nm to 85 nm, where the average dimensions of the ceramic particles reached Ḡ = 89.6 nm. It is also noted that the pores in the ceramic structure disappear at this ratio. At higher alloy ratios, we notice great homogeneity in the distribution of the dimensions of the ceramic particles and their density. The average dimensions of the ceramic particles also increase with increasing tin content, taking values of 112.9 nm at ratio 0.10 and a value of 127.4 nm at ratio 0.14, as shows. By comparing the dimensions of the ceramic grains with the dimensions of the crystallization grains, we notice a clear and large difference in dimensions, which confirms the formation of the ceramic grains through the merging of the crystallization grains and their growth in all directions during the sintering process, which gives the ceramic grains their spherical shape and great density.
Figure 6. SEM images of ceramic samples and dimensional distribution diagrams of ceramic grains.
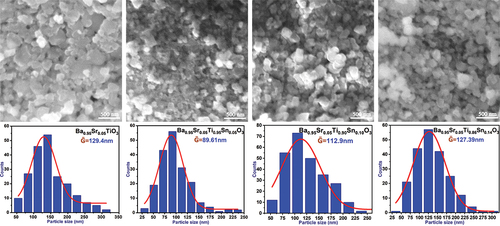
Table 2. experimental, theoretical, and relative density changes, porosity ratio, and ceramic grain size of samples.
3.2.2. EDX analysis
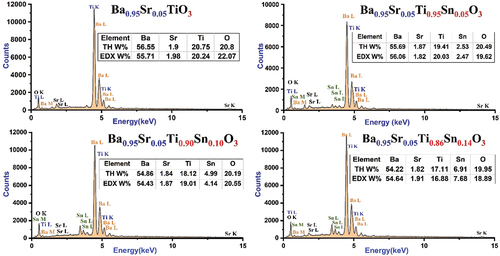
The atomic structure of the surface of the Ba0.95Sr0.05Ti1-ySnyO3 ceramic discs was studied using EDX spectroscopy. The spectra shown in confirmed the presence of titanium, barium, strontium, and oxygen atoms in the uncontaminated sample, which indicates its purity and freedom from any impurities that could reach the sample during the various stages of preparation. Regarding the rest of the ceramic samples, there is a clear consistency between the peaks of the spectra formed and the changes occurring in the percentages of tin added to the pure sample and the samples being free of any external impurity atoms, which indicates accuracy in the preparation process. Moreover, the experimental results obtained with the initial composition of the samples are consistent very well.
Figure 7. EDX spectrum of the Ba0.95Sr0.05Ti1-ySnyO3 ceramics.
3.3. Density measurements
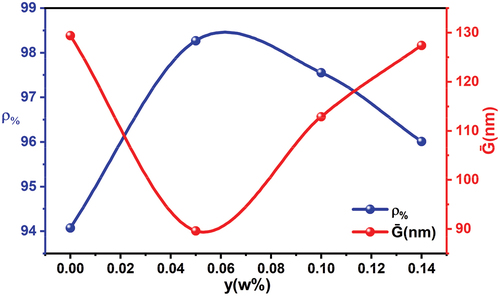
Relative density plays an important role in determining the electrical, mechanical, and microscopic properties of ferroelectric materials and the scope of their use in various applications [Citation36]. Relative density is defined as the ratio of the experimental density ρm of the prepared tablets to the theoretical density ρt, which we obtain based on XRD data [Citation21,Citation37]. shows the changes in the relative density and the average ceramic grain size as a function of tin content. It was found that the highest value of the relative density was 98.55% at the ratio x = 0.05, which corresponds to the lower value of the dimensions of ceramic grains 89 nm located within the field of nanoscale dimensions. It can be said that ceramic nano-grains play a major role in reducing the percentage of pores in the structure and help the ceramic grains accumulate significantly, so the material gains a high relative density. It is possible to note that the relationship between the crystallization size and the relative density is the inverse relationship, when the ceramic grain size is large, the relative density decreases clearly, and pores appear in the structure. Porosity was calculated using relationship [Citation38]: and the results are organized in , which also includes the average dimensions of the ceramic grains and the experimental, theoretical and relative density values.
Figure 8. Relative density and ceramic grain size changes as a function of doped ratios.
3.4. Dielectric study
Ceramic discs subjected to an alternating electric field are equivalent to a capacitor connected in parallel with a resistance that can be determined using an LCR meter at a potential difference of 2 V. They are used to determine the dielectric constant, the loss factor tan, the conductivity, and the extent of their influence on external factors, namely the frequency of the applied field and the temperature of the medium surrounding the discs. The experimental data were interpreted by carefully correlating the electrical properties with the structural and morphological properties of doped content, dominant crystal system, ceramic grain dimensions, relative density, and impurities, if any.
3.4.1. Frequency effect
The polarization mechanisms prevailing in ferroelectric dielectrics are directly affected by the frequency of the applied field, and consequently affect its dielectric properties such as dielectric constant, loss angle tangent, and AC conductivity [Citation39]. The changes in the dielectric properties of ceramics were studied over a wide range of frequencies from 20 kHz to 3 MHz at room temperature and 150°C, where the dielectric constant, loss tangent, and electrical conductivity were calculated according to the following relationships, respectively [Citation21,Citation40,Citation41]:
3.4.1.1. Frequency effect on the dielectric constant
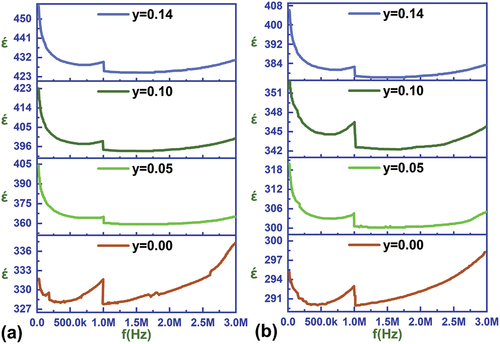
shows the changes in the dielectric constant curve as a function of frequency for all ratios prepared at 22°C and 150°C. Several key points can be observed from these plots: First, the dielectric constant for all ratios has high values at low frequencies due to the contribution of the various polarization mechanisms prevailing in the material, primarily directional polarization and space charge polarization (interfacial and jump polarization), which prevails at low frequencies and fades rapidly with the gradual increase in frequency, which is reflected in έ values [Citation42]. Second: There is a break in the values of έ curve at the frequency of 1 MHz for all ratios at different temperatures as a result of the inability of the moments of the electric dipoles that make up the directional polarization to track the changes in the electric field applied to the material [Citation43]. Third: At high frequencies above 1 MHz, the frequency-independent atomic and electronic polarization mechanisms contribute mainly and directly to the values of έ, but we observe from the plots a steady increase in the values of έ with increasing frequency values within the high-frequency range, which can be explained by the imbalance caused by oxygen vacancies in the distribution of ions within a unit cell and corresponds to the separation of the center of positive and negative charges and the formation of electric dipole moments that increase their effectiveness and impact with the increase in the frequency of the applied field, which provides sufficient energy to direct the moments toward the field with increasing frequency through the activation and regulation of the movement of the ions forming the electric dipole moments. Fourth: The values of the dielectric constant increase clearly with the increase of the tin content as a result of the increase in the relative density of the samples, and the increase in the average dimensions of the ceramic grains directly affects the size of the ferroelectric domains, and the ability of their walls to move under the influence of the applied external electric field, which contributes to the fusion of domains to form larger domains that effectively contribute to the values of the dielectric constant. In addition to the high contribution of vacuum charge polarization due to the decrease in the proportion of pores and the increase in the area of the grain boundaries [Citation44]. Fifth: The values of the dielectric constant decrease at a temperature of 150°C compared to the corresponding values at room temperature of 22°C because the moments of the electric dipoles (directional polarization) are affected by the temperature, so their contribution decreases at high temperatures [Citation45].
Figure 9. Frequency dependence of έ for Ba0.95Sr0.05Ti1-ySnyO3 ceramics sample at (a) 22°C and (b) 150°C.
3.4.1.2. Frequency effect on the loss factor tanδ
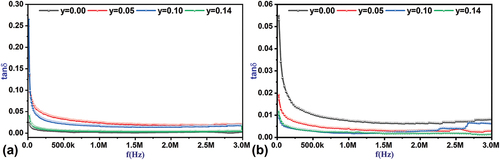
shows the changes in the tangent curve of the loss angle as a function of frequency at different temperatures. High values of the loss factor tanδ at low frequencies result from the contribution of the electrical polarization mechanisms prevailing in the material, most notably vacuum charge polarization and directional polarization. Just as these mechanisms contribute to the dielectric constant, they will contribute to the loss factor tanδ [Citation46]. The contribution of the vacuum charge polarization mechanism fades away quickly with increasing frequency, then the directional polarization slowly fades away until the frequency of 1 MHz is reached, after which the tangent values of the loss angle become independent of frequency [Citation47,Citation48]. shows the decrease in loss angle tangent values as a function of frequency at high temperatures of 150°C compared to the same values at room temperature as a result of the decrease in the contribution of electrical polarization mechanisms, especially directional polarization, at high temperatures [Citation49].
Figure 10. Frequency dependence of tanδ for Ba0.95Sr0.05Ti1-ySnyO3 ceramics sample at (a) 22°C and (b) 150°C.
3.4.1.3. Frequency effect on the electrical conductivity
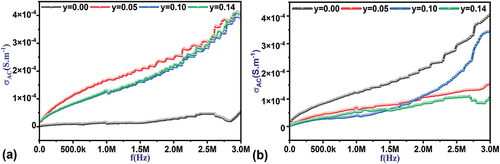
shows the changes in the conductivity of the alternating current as a function of the frequency of the applied field at different temperatures. It is noted from that the weak relationship between electrical conductivity and frequency for the pure sample at room temperature over the entire frequency range studied. This decrease may be related to stability, structural homogeneity, and improved potential barrier properties between adjacent ionic sites within crystalline grains or from one grain to another, or it may be due to the presence of pores in the structure and the decrease in the average free surface of the ceramic grains compared to the rest of the ratios. In contrast, the AC conductivity values of the Ti-doped samples increase directly with increasing frequency. The number of active charge carriers that jump from one location to another increases with increasing frequency, and the electrical conductivity increases with it [Citation50]. Oxygen vacancies are one of the most important mobile charge carriers in these materials, and the carrier electrons are created by the ionization of oxygen vacancies described by the Kroger-Ving notation as follows [Citation3,Citation51,Citation52]:
Figure 11. Frequency dependence of σAC for Ba0.95Sr0.05Ti1-ySnyO3 ceramics sample at (a) 22°C and (b) 150°C.
Whereas is the position of the oxygen in the crystal lattice, represents the vacancies of the two-charged oxygen in the crystal lattice,
which is considered the most mobile charge and the most capable of movement, so it gains great importance in the conduction process, while
represents the charge of the electron.
The generated electrons are captured by tin or titanium ions. If it is captured by Sn4+ it may convert it to the , or
state, which in turn forms electric dipoles with oxygen vacancies in the
or
These ions help electrons jump from Sn2+ to Sn4+ ions or from Sn3+ to Sn4+ ions [Citation53]. In the case of capturing the generated electrons by titanium ions, they are converted to
, which in turn forms electric dipoles with oxygen vacancies as follows
. These ions may facilitate the jumping of electrons from Ti3+ to Ti4+ ions. Moreover, the electrons may be captured by Sn4+and Ti4+ ions together, transforming the tin ions into the state (Sn3+)•, and the titanium ions into (Ti3+)•, forming with the oxygen vacancies electric dipoles of the form
and the random distribution of these ions results in dipoles of different lengths with different relaxation times [Citation54]. shows the changes in the electrical conductivity curve as a function of the frequency of the applied field at a temperature of 150°C, which showed a clear difference compared to the same values at room temperature. Heating leads to thermal activation of the charge carriers, which gives them sufficient energy to be liberated and transported across the ionic vacancies, which appeared clearly in the pure sample. On the contrary, heating in the doped samples led to a slight decrease in the electrical conductivity values due to the random movement of charge carriers on the surface of the ceramic grains.
3.4.2. Temperature effect
3.4.2.1. Effect of temperature on dielectric constant
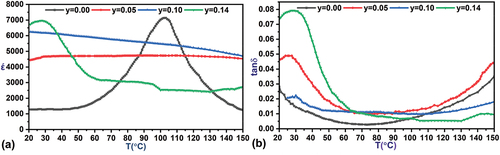
The dielectric constant of ceramic samples was studied over a temperature range (20–150°C) at a frequency of 5 kHz. A programmable convection oven was used to heat the samples at a rate of 3°C.min-1. The oven is equipped with a thermoelectric coupler in contact with the ceramic sample holder for temperature control. shows the changes in the dielectric constant as a function of temperature. At the ratio y = 0.00, it is observed that a peak form in the dielectric constant curve indicating the process of the ferroelectric-paraelectric phase transition at the Curie Point Tc = 104°C, which agrees with a previous study [Citation2] that confirmed the occurrence of the phase transition at Temperature Tc = 109°C for Ba0.95Sr0.05TiO3 sample prepared by the SSR method at a sintering temperature of 1250°C and a sintering time of 4 h. While the rest of the samples showed a significant effect of the tin doping process on the dielectric constant values, at doping ratios y = 0.05, 0.10, the peaks indicating the ferroelectric-paraelectric phase transition disappear and the dielectric constant curve flattens over the entire temperature range studied at relatively high values, where the stability in the values of the dielectric constant as a function of temperature at these ratios is attributed to the effect of the nanoscale dimensions of the ceramic grains that make up the material, which restrict the movement of the walls of the ferroelectric domains to the boundaries of the grain, preventing them from moving, and the polar directions of the domains become governed by the crystalline directions of the ceramic grain [Citation20,Citation55]. The high stability of the nanoscale dimensions of the ceramic bead boundaries limits the thermal effect on the crystal orientations and the corresponding polar orientations within the bead boundaries, thus the value of the dielectric constant in these samples depends on the final result of the polarization distributed to the ceramic beads with the same crystal orientation. In addition to the contribution of free ferroelectric domains distributed on the ceramic beads that have dimensions outside the nanometer scale and are present in the sample in relatively small proportions as shown by SEM morphological study. In addition to the significant densification effect of the grains at these ratios as shown by the relative density values listed in . The very high density of the ceramic grains, in addition to their average dimensions falling within the nanoscale, restricts the process of the ferroelectric-paraelectric phase transition due to the stresses to which the ceramic grains are subjected by their neighboring grains, which resist the thermal expansion of the grain boundaries and prevent the process of transitioning the structure from the tetragonal crystalline system to the cubic one. It limits the thermal effect on the crystallographic directions and the directions of the moments of the electric dipoles that compose it, which makes the structure somewhat independent of the thermal conditions it is subject to [Citation56,Citation57]. The increase in dielectric constant values at y = 0.10 is due to the increase in the average dimensions of the ceramic grains to 112.9 nm compared to 89.61 nm at y = 0.05. It is also observed from the graphs and for y = 0.14, a broad spreading peak with a maximum value of έmax = 6963 at Tc = 28°C indicating a phase transition. The partial dissolution of tin ions and the formation of the compound BaSnO3, as confirmed by XRD measurements in the sample y = 0.14 at a rate of 8.8%, may have a significant impact on the dielectric constant curve and the reappearance of the phase transition peak. BaSnO3 impurities also contribute to the overall dielectric constant at high temperatures, which maintains a relatively high value of more than έ = 2000. Previous studies showed that BaSnO3 has high dielectric constant values at temperatures above 90°C and increases with increasing temperature until the temperature reaches 300°C [Citation58,Citation59]. This explains the return of the dielectric constant curve to rise slowly within the range of temperatures higher than 130°C. The thermal stability of the dielectric properties of Ba0.95Sr0.05Ti1-ySnyO3 ceramic samples can be used in wide electronic applications such as ceramic capacitors, ferroelectric memories, and other applications used in variable temperature working conditions.
Figure 12. Changes in the Dielectric constant έ and loss factor tanδ as a function of temperature.
3.4.2.2. Effect of temperature on the loss factor tanδ
The loss factor tanδ expresses the amount of energy dissipated in electrical insulators in the form of heat or leakage currents. It is also used in classifying electrical insulators, their field of use, and their final applications [Citation60]. The loss factor tanδ is affected by many factors such as temperature, applied field frequency, humidity, porosity, chemical composition, crystal structure, impurities, and ceramic grain size [Citation32]. These factors mainly affect the crystal structure, the polarization mechanisms prevailing in the dielectric material, the movement of charge carriers, as well as the movement of the walls of the ferroelectric domains. shows the changes in the tangent of the loss angle for the as-prepared samples as a function of temperature. It is possible to divide the scheme into three main areas: The first region extends over the low-temperature range from 22°C to 60°C. The loss factor has high values at the low end of this range due to the contribution of all the prevailing polarization mechanisms and the loss of a portion of the electrical energy expended on directing the walls of the ferroelectric dominoes, which resist movement as a result of it not gaining enough energy to redirect the moments of the electric dipoles that form the domain [Citation61]. Moreover, the peaks in the loss factor curve for samples with x ratios of 0.05 and 0.14 indicate the presence of structural disorder, which intensifies as temperature increases until it reaches its peak and then diminishes as the structure of the large ceramic grains transitions from the tetragonal to the more stable cubic crystal system. This decrease continues at higher temperatures due to the thermal expansion of the unit cell, which facilitates the movement of spontaneous and instantaneous dipoles, in addition to the transition of more ceramic grains to the cubic crystal system. This rapid decrease was also noted for the rest of the samples due to the mechanisms of directional polarization and vacuum charge polarization being directly affected by temperature, In addition to the ability of some domain walls to move and merge to form larger polarized domains, as a result of thermal expansion of the unit cell composes the dipoles. The second region extends over the temperature range from 60°C to 110°C, within which the loss factor values decrease and become more stable. The decrease in loss factor values in this field is due to two main factors. The first is the decrease in the contribution of the prevailing polarization mechanisms in the material due to the effect of high temperatures. Second: The expansion of the dimensions of the unit cell due to heating, which would reduce the restrictions on the movement of the spontaneous dipole moments in the ferroelectric phase, and the instantaneous dipole moments in the paraelectric phase, so more electric dipole moments are directed toward the field, resulting in the movement of the walls of the dominoes and their merging together to form larger domains [Citation21,Citation60]. In this case, most of the electrical energy is spent on directing the dipole moments, and a small portion is lost in the material in the form of heat or contributes to the transfer of charges across the boundaries of adjacent grains. The third region extends over the high-temperature range from 110°C to 150°C. The loss factor increases with increasing temperature due to the effect of thermal activation of the charge carriers, which gain sufficient energy to be released and move from their positions through the oxygen vacancies and crystalline defects distributed on the grain boundaries, or their ability to pass The potential barrier formed between adjacent grain boundaries creates leakage currents that pass through the material, increasing the loss and reducing the dielectric constant [Citation21,Citation60]. The relatively high values of the loss factor tanδ in the sample y = 0.14 compared to the rest of the samples may be due to the effect of BaSnO3 impurities formed in the compound, which previous studies confirmed have high values of the loss factor at low temperatures [Citation58,Citation59].
4. Conclusion
The solid-state reaction method enhanced by a high-efficiency metal ball mill was used to prepare new ferroelectric according to the formula Ba0.95Sr0.05Ti1-ySnyO3, and their structural, morphological, and dielectric properties were studied and analyzed. Mechanical preparation of the raw materials contributed to the high heat treatment efficiency, homogeneity, and crystallinity of the prepared solid solution. Rietveld’s analysis of the XRD patterns showed the crystallization of solid solutions with ratios y = 0.00, 0.05 in the tetragonal crystal system, which gives them their ferroelectric properties, and the presence of both tetragonal and cubic crystal systems together in solid solutions with ratios y = 0.10, 0.14. BaSnO3 impurities directly affect the structural properties of the Ba0.95Sr0.05Ti1-ySnyO3 solid solution by reducing the proportion of dissolved Sn4+ in the crystal structure in favor of the formation of impurities. Analyzes of the peaks using the SSP method confirmed that the prepared solid solutions are composed of Nano-dimensional crystalline grains, the dimensions of which decrease with increasing Sn4+ content at doping ratios y ≤ 0.10, given that tin ions form attraction centers for neighboring atoms during the process of thermal decomposition of raw materials and their interaction with each other (calcination), and a large number of Nano-crystalline grains formed. SEM images taken from the surface of the ceramic discs showed the formation of ceramic grains with clear boundaries, homogeneous dimensions, and high condensation, and image analysis confirmed the formation of Nano-ceramics at the doping ratio y = 0.05, where the average dimensions of the ceramic particles reached 89.6 nm. EDX analyses also confirmed the purity of the prepared tablets and that they were free of any external impurities. The dielectric measurements showed a rapid decrease in the values of the dielectric constant έ and the loss factor tanδ with increasing frequency due to the decrease in the contribution of the polarization mechanisms prevailing in the material. Conversely, the conductivity values of doped samples increase with increasing frequency due to the activation of charge carriers that move through oxygen vacancies. Doping with tin led to a noticeable improvement in the dielectric properties of the prepared ceramics, which was demonstrated by an increase in the dielectric constant and a decrease in the loss factor. In addition to the disappearance of the peak of the ferroelectric-paraelectric phase transition and the flattening of the dielectric constant curve at the doping ratios y = 0.05, 0.10 over the entire temperature range studied due to the influence of the nano-ceramic grains, the high relative density of the samples, and the resistance of the structure to the process of transition from the tetragonal to the cubic crystalline system. The unique properties possessed by the prepared ceramic samples are the Nano-sized dimensions of most of the grains that make up the ceramic, the great homogeneity in the grain dimensions, high relative density, and low loss factor values. In addition to the thermal stability shown by ceramic samples with ratios y = 0.05, 0.10, they are of great importance in many advanced technologies, especially energy storage, high-yield solar cells, ceramic capacitors, multi-layer capacitors, class-2 capacitors (EIA), and ferroelectric random access memory (F-RAM).
Disclosure statement
No potential conflict of interest was reported by the author(s).
Correction Statement
This article was originally published with errors, which have now been corrected in the online version. Please see Correction http://dx.doi.org/10.1080/21870764.2024.2388942
References
- Tilley RJD. Perovskites structure-property relationships. Chichester: Uk John Wiley & Sons, Ltd; 2016.
- Jain A, Panwar AS, Jha A. Structural, dielectric and ferroelectric studies of Ba1−xSrxTiO3 ceramics prepared by mechanochemical activation technique. J Mater Sci: Mater Electron. 2016;27(9):9911–9919. doi: 10.1007/s10854-016-5060-x
- Kumar Bain A, Chand P. Ferroelectrics: principles and applications. Weinheim (Germany): Wiley-Vch; 2017.
- Nair KM, Priya S, Jia Q. Advances and applications in Electroceramics. Hoboken (NJ): John Wiley & Sons; 2011.
- Saravanan R. Titanate based ceramic dielectric materials. Millersville (PA): Materials Research Forum LLC; 2018.
- Tang Y, Chen L, Duan Z, et al. Enhanced compressive strengths and induced cell growth of 1-3-type BaTiO3/PMMA bio-piezoelectric composites. Mater Sciamp; Eng C, Biomimetic Mater, Sensors Syst. 2021;120:111699–111699. doi: 10.1016/j.msec.2020.111699
- Zheng T, Yu Y, Pang Y, et al. Improving bone regeneration with composites consisting of piezoelectric poly(l-lactide) and piezoelectric calcium/manganese co-doped barium titanate nanofibers. Compos Part B: Eng. 2022;234:109734. doi: 10.1016/j.compositesb.2022.109734
- Sood A, Desseigne M, Dev A, et al. A comprehensive review on barium titanate nanoparticles as a persuasive piezoelectric material for biomedical applications: prospects and challenges. Small. Published online December 30, 2022:2206401. 2023;19(12). doi: 10.1002/smll.202206401
- Fakhar-E-Alam M, Saddique S, Hossain N, et al. Synthesis, characterization, and application of BaTiO3 nanoparticles for anti-cancer activity. J Clust Sci. [cited 2022 Sep 1];34(4):1745–1755. doi: 10.1007/s10876-022-02346-y
- Tsurumi T, Hoshina T, Takeda H, et al. Size effect of barium titanate and computer-aided design of multilayered ceramic capacitors. IEEE Trans Ultrason, Ferroelect, Freq Contr. 2009;56(8):1513–1522. doi: 10.1109/tuffc.2009.1214
- Simanjuntak FM, Amrillah T, Syed Jalaluddeen A, et al. Perovskite-based emerging memories. Elsevier eBooks. Published online January 1, 2023:401–484. doi: 10.1016/b978-0-323-90586-2.00014-0
- Kumari A, Kumari K, Ahmed F, et al. Influence of Sm doping on structural, ferroelectric, electrical, optical and magnetic properties of BaTiO3. Vacuum. 2021;184:109872. doi: 10.1016/j.vacuum.2020.109872
- Buscaglia V, Buscaglia MT, Canu G. BaTiO3-Based ceramics: fundamentals, properties and applications. Encycl Mater: Technical Ceram Glasses. Published online 2021311–344. doi: 10.1016/b978-0-12-803581-8.12132-0
- Atikur Rahman M. Understanding of doping sites and versatile applications of heteroatom modified BaTiO3 ceramic. J Asian Ceramic Soc. 2023;11(2):215–224. doi: 10.1080/21870764.2023.2203635
- Drdlik D, Marak V, Maca K, et al. Modification of barium titanate sintering via rare earth oxides addition: Dilatometric and microstructural study. Ceram Int. 2022;48(17):24599–24608. doi: 10.1016/j.ceramint.2022.05.105
- Borowski M. Perovskites: structure, properties, and uses. New York (NY): Nova Science Publishers; 2010.
- Lijuan Z, Lihai W, Jiandang L, et al. Dielectric properties and structural defects in BaTi1−xSnxO3ceramics. In: Journal of Physics: Conference Series; 443, 2013. p. 012014. doi: 10.1088/1742-6596/443/1/012014
- Stanculescu R, Ciomaga CE, Padurariu L, et al. Study of the role of porosity on the functional properties of (Ba,Sr)TiO3 ceramics. J Alloys Compd. 2015;643:79–87. doi: 10.1016/j.jallcom.2015.03.252
- Yang L, Wang Y, Wang Y, et al. Synthesis of single-crystal Ba1−xSrxTiO3 (x=0–1) dendrites via a simple hydrothermal method. J Alloys Compd. 2010;500(1):L1–L5. doi: 10.1016/j.jallcom.2010.03.196
- Horchidan N, Ianculescu AC, Vasilescu CA, et al. Multiscale study of ferroelectric–relaxor crossover in BaSnxTi1−xO3 ceramics. J Eur Ceramic Soc. 2014;34(15):3661–3674. doi: 10.1016/j.jeurceramsoc.2014.06.005
- Mohseen Mohammad M, Al-Araj B, Saad Al-Din N. Effect of Sr-doping on structural, morphological and dielectric properties of BaTi0.93Sn0.07O3 ferroelectric ceramics. Open Ceram. 2023;15:100368–100368. doi: 10.1016/j.oceram.2023.100368
- Singh M, Lara S, Tlali S. Effects of size and shape on the specific heat, melting entropy and enthalpy of nanomaterials. J Taibah Univ For Sci. 2017;11(6):922–929. doi: 10.1016/j.jtusci.2016.09.011
- Zaitouni H, Hajji L, Mezzane D, et al. Direct electrocaloric, structural, dielectric, and electric properties of lead-free ferroelectric material Ba0.9Sr0.1Ti1-xSnxO3 synthesized by semi-wet method. Physica B: Condens Matter. 2019;566:55–62. doi: 10.1016/j.physb.2019.04.026
- Brahem R, Rahmouni H, Farhat N, et al. Electrical properties of Sn-doped Ba0.75Sr0.25Ti0.95O3 perovskite. Ceram Int. 2014;40(7):9355–9360. doi: 10.1016/j.ceramint.2014.02.002
- Chihaoui S, Seveyrat L, Perrin V, et al. Structural evolution and electrical characteristics of Sn-doped Ba0.8Sr0.2TiO3 ceramics. Ceram Int. 2017;43(1):427–432. doi: 10.1016/j.ceramint.2016.09.176
- Deepa AS, Vidya S, Manu PC, et al. Structural and optical characterization of BaSnO3 nanopowder synthesized through a novel combustion technique. J Alloys And Compd. 2011;509(5):1830–1835. doi: 10.1016/j.jallcom.2010.10.056
- Janifer MA, Anand S, Prabagar CJ, et al. Structural and optical properties of BaSnO3 ceramics by solid state reaction method. In: Materials Today: Proceedings; 2021, 47. p. 2067–2070. doi: 10.1016/j.matpr.2021.04.429
- Chambi JT, Prado LD, Ferreira B, et al. Quantitative analysis and evaluation of solid-state stability of mebendazole forms a and C suspensions by powder X-ray diffraction using the Rietveld method. Int J Pharm. 2024;650:123721–123721. doi: 10.1016/j.ijpharm.2023.123721
- Dall’olio L, Spinozzi S, Curzi M, et al. Direct derivation of the crystalline fraction of highly potent active pharmaceutical ingredients by X-ray powder diffraction. Eur J Pharm Sci. 2021;159:105692. doi: 10.1016/j.ejps.2020.105692
- Singh KC, Nath AK, Laishram R, et al. Structural, electrical and piezoelectric properties of nanocrystalline tin-substituted barium titanate ceramics. J Alloys And Compd. 2011;509(5):2597–2601. doi: 10.1016/j.jallcom.2010.11.106
- Patel K, Patel A, Jethwa VP, et al. X-ray diffraction analysis of orthorhombic SnSe nanoparticles by Williamson–hall, Halder–Wagner and size–strain plot methods. Chem Phys Impact. 2024;8:100547. doi: 10.1016/j.chphi.2024.100547
- Rajesh Kumar B, Hymavathi B. X-ray peak profile analysis of solid-state sintered alumina doped zinc oxide ceramics by Williamson–hall and size-strain plot methods. J Asian Ceramic Soc. 2017;5(2):94–103. doi: 10.1016/j.jascer.2017.02.001
- Alkathy MS, Gayam R, Raju KCJ. Effect of sintering temperature on structural and dielectric properties of Bi and Li co-substituted barium titanate ceramic. Ceram Int. 2016;42(14):15432–15441. doi: 10.1016/j.ceramint.2016.06.194
- Ali SKM, Shankar J, Kumar AS, et al. Effect of sintering temperature on physical and dielectric properties of SrTiO3 ceramics. In: Materials Today: Proceedings; 2023, 92. p. 976–979. doi: 10.1016/j.matpr.2023.04.587
- Li Z, Molin C, Michaelis A, et al. Modified (Ba,Sr)(Sn,Ti)O3 via hydrothermal synthesis for electrocaloric application. Open Ceram. 2023;16:100502–100502. doi: 10.1016/j.oceram.2023.100502
- Ansaree MJ, Kumar U, Upadhyay S. Solid-state synthesis of nano-sized Ba(Ti1−xSnx)O3 powders and dielectric properties of corresponding ceramics. Appl Phys A. 2017;123(6). doi: 10.1007/s00339-017-1047-6
- Bucur RA, Bucur AI, Novaconi S, et al. Synthesis and characterization of BaTi1−xSnxO3–0.5mol%GeO2. J Alloys And Compd. 2012;539:148–153. doi: 10.1016/j.jallcom.2012.06.026
- Sharma P, Singh D, Dave V. Fundamentals of nano-textile science. Salt Lake: CRC Press; 2022.
- Sarowar Hossain M, Das SK, Moniruzzaman M, et al. Frequency and temperature dependent electric polarization, relaxation, and transport properties of Mo and W doped BaTiO3. Results In Phys. 2021;30:104873–104873. doi: 10.1016/j.rinp.2021.104873
- Arya BB, Choudhary RNP. Structural, dielectric and electrical properties of BaSnO3 and BaSeO3 modified Bi0.5Na0.5TiO3 ceramics. Ceram Int. 2020;46(4):4222–4234. doi: 10.1016/j.ceramint.2019.10.141
- Humera N, Riaz S, Ahmad N. Colossal dielectric constant and ferroelectric investigation of BaTiO3 nano-ceramics. J Mater Sci: Mater Electron. 2020;31(7):5402–5415. doi: 10.1007/s10854-020-03100-8
- Khan MH, Pal S, Bose E. Frequency-dependent dielectric permittivity and electric modulus studies and an empirical scaling in (100−x)BaTiO3/(x)La0.7Ca0.3MnO3 composites. Appl Phys A. 2014;118(3):907–912. doi: 10.1007/s00339-014-8810-8
- Sharma A, Usharani NJ, Bhattacharya SS. Dielectric and ferroelectric properties of multicomponent equiatomic calcium lead strontium titanate (Ca0.33Pb0.33Sr0.33)TiO3. Open Ceram. 2021;6:100130. doi: 10.1016/j.oceram.2021.100130
- Naveed-Ul-Haq M. Exploring Ba(Ti, Sn)O3: an experimental and theoretical study of structural, ferroelectric, electronic, and optical properties. Mater Today Commun. 2021;28:102494. doi: 10.1016/j.mtcomm.2021.102494
- Chen LF. Microwave electronics: measurement and materials characterization. Chichester: Wiley; 2004.
- Kar B, Kumar P, Panigrahi S, et al. Development of mixed phase with improved dielectric and piezoelectric properties in Ca and Sn modified BaTiO3 ceramics. J Alloys Compd. 2024;983:173786–173786. doi: 10.1016/j.jallcom.2024.173786
- Gorur Govinda Raju. Dielectrics in electric Fields. Boca Raton: CRC Press; 2017.
- Nurushev SB, Runtso MF, Strikhanov MN. Introduction to polarization physics. New York (NY): Springer; 2012.
- Tomar R, Pandey R, Singh NB, et al. Electrical properties of barium titanate in presence of Sn2+ dopant. SN Appl Sci. 2020;2(2). doi: 10.1007/s42452-020-2017-8
- Arshad M, Du H, Javed MS. Fabrication, structure, and frequency-dependent electrical and dielectric properties of Sr-doped BaTiO3 ceramics. Ceram Int. 2020;46(2):2238–2246. doi: 10.1016/j.ceramint.2019.09.208
- Sareecha N, Shah WA, Maqsood A. Fabrication and electrical investigations of Pb-doped BaTiO3 ceramics. Mater Chem Phys. 2017;193:42–49. doi: 10.1016/j.matchemphys.2017.01.088
- Alkathy MS, Pattipaka S, Gatasheh MK, et al. Achieving high energy storage performance and efficiency in lead-free SrTiO3 ceramics via neodymium and lithium co-doping technique. J Asian Ceramic Soc. 2023;11(4):491–503. doi: 10.1080/21870764.2023.2259149
- Kola L, Swain AB, Rath M, et al. Impedance characteristics and PTCR effect in lead free BaTi1-xSnxO3 piezoceramics. Mater Res Bull. 2018;106:371–378. doi: 10.1016/j.materresbull.2018.06.021
- Mondal T, Majee BP, Das S, et al. A comparative study on electrical conduction properties of Sr-substituted Ba1−xSrxZr0.1Ti0.9O3 (x = 0.00–0.15) ceramics. Ionics. 2017;23(9):2405–2416. doi: 10.1007/s11581-017-2085-y
- Shur VY. Nano- and micro-domain engineering in normal and relaxor ferroelectrics. Elsevier eBooks. 2008:622–669. doi: 10.1533/9781845694005.5.622
- Lee S, Bock JM, Trolier-McKinstry S, et al. Ferroelectric-thermoelectricity and Mott transition of ferroelectric oxides with high electronic conductivity. J Eur Ceramic Soc. 2012;32(16):3971–3988. doi: 10.1016/j.jeurceramsoc.2012.06.007
- Ghayour H, Abdellahi M. A brief review of the effect of grain size variation on the electrical properties of BaTiO3-based ceramics. Powder Technol. 2016;292:84–93. doi: 10.1016/j.powtec.2016.01.030
- Bradha M, Vijayaraghavan T, Ashok A. Synthesis and total conductivity studies in BaSnO3. Mater Lett. 2014;125:187–190. doi: 10.1016/j.matlet.2014.03.181
- Muhsen KNDK, Osman RAM, Idris MS. Giant anomalous dielectric behaviour of BaSnO3 at high temperature. J Mater Sci: Mater Electron. 2019;30(8):7514–7523. doi: 10.1007/s10854-019-01065-x
- Kumari A, Dasgupta Ghosh B. Effect of strontium doping on structural and dielectric behaviour of barium titanate nanoceramics. Adv Appl Ceram. 2018;117(7):427–435. doi: 10.1080/17436753.2018.1491166
- Ahmadu U, Muazu A, Umar S. Physical properties of porous pure and Zr/Sn-doped Nanocrystalline BaTiO3 ceramics. Recent Adv Porous Ceram. 2018. doi: 10.5772/intechopen.75500