
ABSTRACT
This study explores how often New Zealanders’ deliberately disconnect from the Internet (“digital disconnection”). Utilizing a nationally representative survey of 1,012 participants, the research investigates the frequency of disconnection from the Internet, the motivations, and the challenges associated with disconnection. The study also explores the relationship between these factors and demographic variables. The findings reveal that a majority of New Zealanders intentionally disconnect from the Internet. The primary motivations for disconnection are to enhance face-to-face interactions, particularly with family and friends, and to reduce distractions associated with Internet use. However, disconnecting presents challenges, particularly the necessity of an Internet connection for accessing certain services. The study also uncovers significant correlations between age and gender and the motivations and challenges of disconnecting. This research provides a crucial first step in understanding digital disconnection in Aotearoa, laying the foundation for future studies on how individuals balance their online and offline lives.
Introduction
In a time of unprecedented connectivity to the Internet, people are also choosing to disconnect. Disconnecting from the Internet (‘digital disconnection’) refers to switching off or taking an intentional break from being connected to the Internet (Nassen, Vandebosch, Poels, & Karsay, Citation2023). A popular version of this is a ‘digital detox’, where people abstain from digital technology for a selected period (Syvertsen & Enli, Citation2019). Digital disconnection is encouraged by books such as Carl Newport’s Digital Minimalism (Citation2019) claim there are lifestyle and health benefits from disconnecting from the Internet. The value of digital disconnection is debated in education, with schools in Australia and New Zealand banning personal digital devices from classrooms (Beattie & Cassidy, Citation2021; Keogh & Fuller, Citation2023). Digital disconnection also refers to the modes of disengagement that can occur with digital media (e.g. unfollowing someone on Facebook) (Light, Citation2014). In other words, digital disconnection increasingly occurs with technology, with various productivity and well-being tools becoming available in app stores that offer restricted access to specified websites or apps (Beattie, Citation2020). Digital disconnection is a nascent but rapidly developing area of research that offers novel and valuable insights into digital culture and everyday Internet use.
This study explores the socio-demographics of disconnection in Aotearoa New Zealand. We investigate the degree that New Zealanders are actively disconnecting from the Internet, the reasons why, and challenges in doing so, as well as whether there is any variation across socio-demographic groups. We do so for three key reasons. Firstly, there appears to be little to no research on voluntary disconnection in Aotearoa New Zealand.Footnote1 While a recent New Zealand study found that limiting social media use led to a small improvement in sleep quality (Graham, Mason, Riordan, Winter, & Scarf, Citation2021) we do not more broadly know if New Zealanders actively disconnect from the Internet, as well as the reasons why, or if it is particularly hard to do. Insights about the prevalence, motivations and challenges of digital disconnection will be significant to New Zealand Internet and well-being researchers and policy makers considering the debate that excessive Internet use is detrimental to well-being (Büchi, Festic, & Latzer, Citation2019).
Secondly, a focus in New Zealand draws attention to how place is structured by dis/connectivity, or what Adams and Jansson (Citation2021) call geographies of disconnection. The majority of digital disconnection research has been conducted in the United States or Europe and risks positioning Northern Hemisphere perspectives on disconnection as universal (Treré, Natale, Keightley, & Punathambekar, Citation2020). New Zealand is located in the South Pacific Ocean of the Southern Hemisphere, where dis/connection could be experienced differently. While the country is ranked amongst the world leaders in terms of digital infrastructure, New Zealand is behind in terms of internet affordability (Glimp, Citation2021). Internet speeds are on average slower than those in Europe (Speedtest, Citation2023) and mobile data more expensive (Glimp, Citation2020). Moreover, the idea of being ‘disconnected’ from the rest of the world is arguably part of living in New Zealand. The large distance between New Zealand and Europe is historically significant for Pākehā, or white European New Zealanders, and has formed part of Pākehā identity (Blainey, Citation1966/2001).
Conversely, disconnecting from the Internet might also be viewed or experienced differently for Māori, the Indigenous Peoples of Aotearoa New Zealand. Māori historically lived in large family-based rural communities, with shared responsibility to natural resources. In 1961 the New Zealand Government commissioned the Hunn Report (Citation1961) that encouraged Māori to leave their communities for the city to seek education and employment opportunities and to disregard their cultures. By 2013, 84% of Māori within New Zealand lived in urban areas and were disconnected from their family communities and culture (Meredith, Citation2015). The relationship between ethnicity and voluntary disconnection is not well-studied, unlike involuntary disconnection (Grimes & White, Citation2019). While a recent survey found no significant differences in disconnection attitudes across ethnicity groups (Nguyen & Hargittai, Citation2023), Plaut (Citation2023) has demonstrated how power dynamics can shape historical disconnective practices, with indigenous groups facing different constraints and motivations to disconnect from colonial languages compared to dominant groups. Not only do we seek to understand how Māori and different ethnicities view and experience digital disconnection but also acknowledge the context of Te Tiriti o Waitangi (the Treaty of Waitangi) to this research.Footnote2
Relatedly and thirdly, there is a lack of sociodemographic research in digital disconnection. While qualitative research has highlighted why users disconnect (Jorge, Citation2019; Kaun & Treré, Citation2018; Light & Cassidy, Citation2014; Portwood-Stacer, Citation2012), how users disconnect (Beattie, Citation2020; Mannell, Citation2018), where users disconnect (Adams & Jansson, Citation2021) or the feasibility of disconnection (Kaun & Schwarzenegger, Citation2014) there has been less research into who disconnects or, more specifically, what groups of people can, or want to disconnect from the Internet. The question of who can disconnect is important following speculation that digital disconnection is becoming a luxury enjoyed by those with economic and social privilege (Beattie & Cassidy, Citation2021). While digital divides research and digital inclusion policies have made significant strides in increasing access to the Internet and building digital skills across populations (Hargittai, Citation2002), we need more sociodemographic research to understand the diversity of digital experiences in relation to disconnecting. A digitally inclusive Internet should not stop at accessing or confidently using the Internet but, also include having the opportunity and skills to have a healthy, meaningful, and satisfying relationship with Internet connectivity. We therefore investigate how disconnective experiences and perspectives vary across the Aotearoa New Zealand population. By learning about who wants to disconnect, or can do it, and their reasons for disconnecting, we uncover different attitudes and relationships with Internet connectivity.
In the next section we review existing studies that explore the prevalence, motivations, challenges, and the socio-demographics of disconnection, and state our research questions (RQs). We then describe how we designed the research and conducted the survey, in ‘Methods’. In ‘Findings and discussion’ we report and discuss our exploratory findings. We find that most New Zealanders actively disconnect from the Internet to some extent and are primarily motivated to do so to spend more time with whānau (family) and friends and reduce Internet-related distractions. Furthermore, the main challenge associated with disconnecting is the need to access services that require a connection to the Internet. Connecting our findings to wider communications research, we discuss why men and women, and Pākehā and Māori may disconnect for different reasons, as well as why young people find it harder to disconnect than older people. We conclude the paper with suggestions for further socio-demographic digital disconnection research.
Literature review
Gaps of knowledge about prevalence of digital disconnection
The number of people who disconnect from the Internet, or the prevalence of digital disconnection has not been a focus in disconnection research. This is perhaps due to a lack of measurement tools or consistent approaches to studying the topic (Nassen et al., Citation2023). Studies that report prevalence of digital disconnection greatly vary in terms of what Internet users are disconnecting from or the contexts of disconnection. For example, the United Kingdom (UK) media regulator Ofcom (Citation2016) found that a third of UK internet users report taking a break from being online. In contrast, an Egyptian study found that 83.3% of Egyptians would disconnect from their digital devices when on holiday (Gaafar & Allah, Citation2021). Some studies have focused on the prevalence of disconnection from specific platforms Baumer et al. (Citation2013) found that 31% of Facebook users had either deleted or deactivated their accounts. The prevalence of those who had considered disconnection was higher, with 62% reporting that they had previously thought about deactivating their Facebook account (Baumer, Guha, Skeba, & Gay, Citation2019). Other studies approach the prevalence of disconnection from specific health contexts. In a study into smartphone addiction in South Korea, Lee, Ahn, Choi, and Choi (Citation2014) found that 58.8% of participants disconnected in response to negative experiences with using a smartphone. A study into problematic smartphone use reported that 41.7% of participants used a digital detox or well-being app that helped users to disconnect from aspects of the Internet (Schmuck, Citation2020). Nassen et al. (Citation2023) conclude that prevalence rates for actual disconnection generally range between 22% and 64%, but caution against generalising because of the wide variety of research designs.
Despite the inconsistency of approaches, investigating the prevalence of digital disconnection is still a worthwhile exercise. Highlighting the percentage of people disconnecting provides a baseline figure, which later research can draw from to determine if disconnecting from the Internet is changing over time. Tracking these shifts enables broader discussions about societal behaviours and attitudes towards Internet connectivity. These insights exist in the overlapping area of news avoidance. For example, the Reuters Institute for the Study of Journalism have reported on news avoidance for half a decade and have been able to determine that news avoidance is on the rise worldwide (Coster, Citation2022). Regularly reporting on the prevalence of news avoidance has produced compelling insights about audiences’ changing attitudes towards the news. We contend that similar research into digital disconnection offers insights into Internet users’ relationship with Internet connectivity, and therefore our first research question (RQ1) is:
How prevalent is digital disconnection in Aotearoa New Zealand?
The range of motivations to disconnect
In contrast, there has been ample research that explores Internet users’ motivations to disconnect. We know that people disconnect from social media to improve their mental health or well-being (Vanden Abeele, Halfmann, & Lee, Citation2022) or in relation to a specific social media platform or device (Beattie & Cassidy, Citation2021). At the device or social media platform level, people might disconnect in response to content their find upsetting (Baumer et al., Citation2013) because of anonymity and data privacy concerns (Baumer et al., Citation2013) or as a means of political protest against the platform (Kaun & Treré, Citation2018). Conversely, people might disconnect to avoid feeling pressured to respond immediately to messages and notifications (Mannell, Citation2018). Finally, disconnection can also be part of a lifestyle practice, where people disconnect to either find work-life balance (Gregg, Citation2018) or to resist platforms such as Twitter as a way of expressing one’s politics and/or identity (Jorge, Citation2019; Portwood-Stacer, Citation2012).
One study investigated the prevalence of motivations across a population. Surveying 1163 Swiss Internet users, Nguyen et al. (Citation2022) found that the most popular motivation to disconnect was reducing distractions when needing to concentrate on an activity, and finding disconnecting important for their well-being. The least popular motivations to disconnect were friends and family believing they should use digital media less and wanting to prevent a fear of missing out. We are similarly interested in the prevalence and range of motivations to disconnect in Aotearoa New Zealand, and therefore our second research question (RQ2) is:
What motivates New Zealanders to disconnect?
The challenge of disconnecting from the Internet
Previous research has examined the challenges of disconnecting from the Internet. At a high level, we know that a significant number of people find disconnecting challenging. Ofcom (Citation2016) reported that 34% of UK internet users find it challenging to disconnect from the Internet. In a European study where students were asked to disconnect from the Internet for a week, all participants failed to stay disconnected and were back online within 72 hours (Kaun & Schwarzenegger, Citation2014). The most common reason driving reconnection were social, work or economic purposes. Studies on Facebook disconnection showed that many who quit found it difficult to maintain their disconnection and thus reverted to using Facebook again (Baumer, Guha, Quan, Mimno, & Gay, Citation2015). The key takeaway from these studies is not so much about participants’ lack of willpower, but more to do with the degree that digital technologies and Internet connectivity have become embedded into everyday life. Indeed, the practical difficulties of everyday life without a connection to the Internet has been noted as one of the major challenges to disconnecting from the Internet (Nguyen, Citation2023). We are also interested in what the major barriers to disconnecting from the Internet are in Aotearoa New Zealand, and therefore our third research question (RQ3) is:
What challenges New Zealanders to disconnect?
Different disconnection experiences
Finally, research has also found that some people experience disconnection differently. There are those who do not have regular access to the Internet or experience involuntary disconnection. In Aotearoa New Zealand, Pasifika, Māori, those living in larger country towns, and older members of society are comparatively less likely to have internet access (Grimes & White, Citation2019). For example, Māori households are 16% less likely compared to non-Māori households to have internet access (Digital Government, Citation2021). This is compounded by the fact that Māori households are likely to have multiple generations and extended family members in one house. Māori also voluntarily disconnect for distinct cultural reasons. For example, research has noted that some Māori prefer in-person meetings over digital communication for iwi (tribe) related issues (O’Carroll, Citation2013). That being said, Internet connection is still vital so cultural resources can be accessed that would otherwise not be accessible without travel back to their family communities (Digital Government, Citation2021).
Age and gender also appear to inform attitudes and experiences of disconnection. In their analysis of how different sociodemographic groups in Switzerland experience digital disconnection, Nguyen et al. (Citation2022) found that young people were more likely to disconnect for social reasons but also maintain some level of availability. In addition, they found that female participants were more likely to disconnect due to well-being and social reasons than men. In an interview study with six participants, Franks, Chenhall, and Keogh (Citation2018) found that male and female participants offered different reasons for disconnecting from Facebook and focused on different activities during their time offline. Where male participants enjoyed having more time for work and physical activities, female participants prioritised connecting with their social environment in an offline setting. We are interested in how disconnection is viewed and experienced differently in Aotearoa New Zealand, and therefore our fourth RQ is:
What sociodemographic factors (e.g. age, ethnicity, occupation, level of income) are related to differences (or similarities) in digital disconnection in Aotearoa New Zealand?
Methods
To answer RQs1–4, we conducted a nationwide survey in New Zealand that asked participants to report their views and behaviours regarding disconnection. Ethical approval to undertake the survey was sought and approved by the Victoria University of Wellington Human Ethics Committee (#30733).
Participants
Participant were recruited through Horizon Research Ltd. (www.horizonpoll.co.nz) an online panel provider based in Aotearoa New Zealand. A total of 1,012 participants were selected that were representative of New Zealand, based on age, gender and education. Horizon is a member of Research New Zealand (formerly the Market Research Society of New Zealand) and follows its rules and codes of ethics for online research. Data collection was undertaken by Horizon via their online platform. Participants completed an online survey, which included additional questions about disconnection behaviour not reported here. The demographic breakdown of participants is shown in . Additional details on demographic categories and data preparation are reported in the supplementary material.
Table 1. Sample demographics.
Survey weights, based on age, gender and education were calculated and provided by Horizon. When reporting descriptive results, we apply these weights (unweighted results are available in supplementary material, Table S2, and do not differ substantially).
Materials
In addition to reporting demographic information,Footnote3 participants completed the following sections. Participants indicated their frequency of intentional disconnectionFootnote4 from the Internet using response options: ‘Never’, ‘Rarely’, ‘Sometimes’, ‘Often’, and ‘Almost always’. For analysis, this outcome was treated as an ordinal response scale. Participants who intentionally disconnected (i.e. selected any option other than ‘Never’) were asked about their reasons for avoiding or disconnecting from the Internet. Responses included nine predefined options (e.g. ‘To take a break from social media’) and an ‘Other (please specify)’ free-text option.
These reasons reflect offline motivations, such as work focus, family time, and avoidance of specific online phenomena (e.g. social media, news) (Büchi et al., Citation2019; Nguyen et al., Citation2022). Exploratory analyses treated each reason as a dependent variable and dummy coded (0 = not selected, 1 = selected).
All participants were asked about the reasons they find it challenging or hard to disconnect from the Internet. Eight predefined options were provided (e.g. ‘I feel addicted to my phone or device’), along with an ‘Other (please specify)’ option. Participants could choose multiple answers. For exploratory analyses, each option was treated as a dependent variable and dummy coded (0 = not selected, 1 = selected). Studies on challenges to disconnecting (Kaun & Schwarzenegger, Citation2014; Nguyen, Citation2023) inspired these response options. Data cleaning and analyses were conducted using R (v4.1.0) and R Studio (v2022.07.2). All items and further analysis are detailed in supplementary material (Table S3).
Findings and discussion
Most New Zealanders actively disconnect from the Internet
We asked participants how often they intentionally avoid or disconnect from the Internet. The overwhelming majority of participants reported disconnecting from the internet to some extent: 78.1%Footnote5 reported doing so at least ‘Rarely’ or more often (i.e. did not select ‘Never’). The weighted distribution of responses is shown in . At a high level, this suggests that most New Zealand Internet users are not constantly connected to the Internet, but actively disconnect from time to time. Switching off or taking a break from the Internet appears to be something that most New Zealanders do and value.
Figure 1. Weighted distribution of responses to the question: ‘Do you intentionally avoid or disconnect from the Internet?’ for all respondents (a), and by separated by ethnicity (b). We note that proportions for Pasifika (n = 20) and Other (n = 32) categories should be treated with caution due to low numbers.
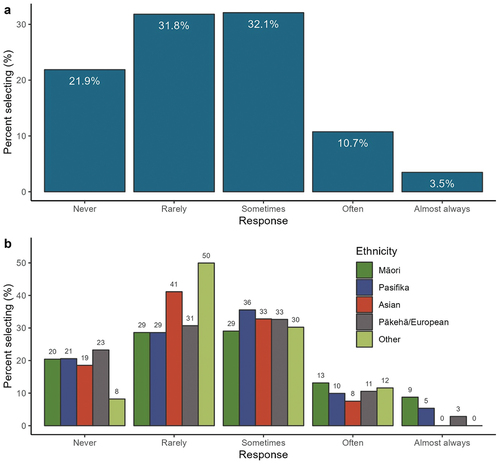
It is also notable that New Zealanders appear to favour infrequent disconnection. The most common response to frequency of disconnection was ‘sometimes’ (32.1%), followed by ‘rarely’ (31.8%) ‘often’ (10.7%) and ‘almost always’ (3.5%). This suggests that most New Zealand Internet users either prefer to be connected to the Internet most of the time or find it difficult to disconnect on a longer or more frequent basis (we discuss these issues in ‘Disconnecting from a demanding, distracting, and unsafe Internet’ and ‘The societal and social cost of disconnection’). A sizeable minority of respondents (22.1%) reported ‘never’ disconnecting. This has several implications: it could either mean these participants have no interest in actively disconnecting from the Internet, or do not have the capacity to do it. Future research could follow up with questions as to why New Zealanders ‘never’ disconnect and ask participants what the differences of what ‘sometimes’, ‘often’ or ‘rarely’ disconnecting entails.
We used a proportional odds logistic regression model (McCullagh, Citation2014) to determine demographic predictors of disconnection frequency. This model compares the likelihood of higher frequency of disconnection among demographic groups, adjusting for variables like gender, age, ethnicity, education, income, and employment status. Results are presented in .
Table 2. Demographic predictors of intentional disconnection.
The model explained a moderate amount of the variation in reported frequency of disconnection (Nagelkerke’s R2 = .14). Gender was the only factor significantly associated with disconnection frequency: Men, compared to women, had lower odds of reporting more frequent digital disconnection (odds ratio (OR) = 0.77, 95%CI [0.61–0.98], p = .037). We visualise this relationship using predicted probabilities of response selection for male and female participants, based on the model, in .
Figure 2. Predicted probabilities (95CI) of response selection for male and female participants derived from proportional odds model ().
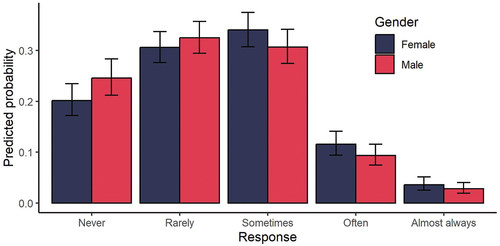
There are several explanations for why women reported higher odds of more frequent disconnection then men. Firstly, women could experience Internet overuse more than men, as research in New Zealand has found that women report spending more time on the Internet than men (Hedges, Pacheco, & Turcu, Citation2023). Secondly, women are more likely than men to be concerned with cyberbullying, online hate speech or threats to privacy (Parkhouse & Bryant, Citation2022). In addition, women may disconnect more than men because of how they use the internet differently to men; women are more likely to use the internet for social media or communication purposes (Parkhouse & Bryant, Citation2022) which, when undertaken excessively, is associated with disconnection (Nguyen et al., Citation2022). In contrast, men are more likely to use the internet for information searching and/or transactions (Parkhouse & Bryant, Citation2022) which, to our knowledge, is less associated with a reason to disconnect.
Disconnecting from a demanding, distracting, and unsafe Internet
Participants who reported any level of digital disconnection – that is, more often than ‘Never’ – were also asked why they disconnected (n = 784). Participants could select any number of nine options presented as well as provide additional reasons via an ‘Other’ free text response option. The weighted proportion of participants selecting each option is shown in .
Figure 3. Weighted proportions of respondents selecting reasons for intentionally disconnecting, among those who report doing so to any extent (a; n = 784) and separated by ethnicity (b). We note that proportions for Pasifika (n = 15) and Other (n = 30) categories should be treated with caution due to low numbers.
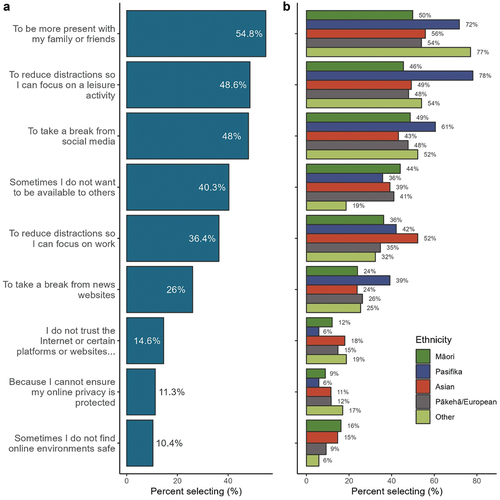
The main reported reason was to be more present with family and friends (54.8% selected), which is recognised as a major motivation driving disconnection behaviour (Nassen et al., Citation2023). That New Zealanders are socially motivated to disconnect suggests a collective awareness of how an Internet connection can be distracting and detrimental to in-person interactions. Take for example, ‘phubbing’, or the act of snubbing someone via using a phone (Haigh, Citation2015). Phubbing is widely seen as rude or a violation of social norms, yet people phub more frequently those they are close to (Al-Saggaf & O’Donnell Citation2019). These findings suggest New Zealanders are motivated to disconnect to avoid phubbing their family and friends. Conversely, a significant number of participants indicated that they disconnect to reduce social availability (40.3%). This is not an anti-social reason to disconnect, but more a response to the extra social demands brought about by social media and Internet connectivity. For example, research suggests many Internet users experience availability stress, which is the internalised norm to remain available to others via social media (Halfmann & Rieger, Citation2019). The popularity of this response suggests New Zealanders could be disconnecting in response to digital pressures like availability stress.
New Zealanders also appear to be motivated to disconnect to reduce distractions that inhibit leisure and work. The second, third and fifth most popular motivations to disconnect were wanting to reduce distractions to focus on leisure (48.6%), take a break from social media (48.0%) and focus on work (36.4%). There is substantial research that claims the presence of a smartphone can reduce cognitive performance and interfere with doing other activities, such as reading a physical book, watching a movie, or playing sports (Skowronek, Seifert, & Lindberg, Citation2023). Of course, many leisure activities can be done online or with digital technologies (e.g. running with a Fitbit), but these findings suggest many New Zealanders enjoy activities without connecting to the Internet. The least often selected reasons were distrust of the internet or certain websites (14.6%), and concerns over privacy (11.3%) and safety (10.4%).
We conducted logistic regression analyses to identify demographic factors influencing reasons to disconnect. Responses were binary coded, and demographic variables were dummy coded. The analyses are preliminary, and significant results with high p values should be considered tentative due to potential false positives. The summarised findings are displayed in a heat map in , showing log odds and odds ratios for demographic categories, with significant effects (p < .05) marked and colour-coded. Detailed results are in the supplementary Table S3.
Figure 4. Heatmap detailing demographic predictors of reasons for voluntary disconnecting from the internet. Values represent odds ratios derived from logistic regression models, with significant effects highlighted. Red shaded cells indicate that a given group (vs reference group) is less likely to select a given response, blue cells the opposite. *p < .05, **p < .01, ***p < .001.
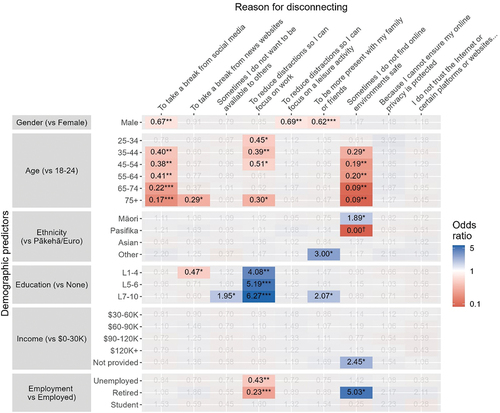
There is not sufficient space to describe all significant effects, but we highlight here several noteworthy patterns. Gender was significantly associated with the probability of selecting several of the response options. Men were less likely than women to cite taking a break from social media (OR = 0.67 [0.50–0.89], p = .006), reducing distraction to focus on leisure activities (OR = 0.69 [0.53–0.91], p = .009) and being more present with family and friends (OR = 0.62 [0.47–0.82], p = .001) as reasons for disconnecting from the internet. As mentioned earlier, possible explanations as to why women are more motivated to disconnect from social media are that women use the Internet for more social purposes and are more concerned about Internet-related issues such as cyberbullying or hate speech than men (Parkhouse & Bryant, Citation2022). Moreover, the reason why women are more motivated than men to disconnect to focus on family and friends, could relate to gender norms, such as the normative expectation that women should value and invest in interpersonal relationships more than men (Beattie, Citation2020; Portwood-Stacer, Citation2014).
Older people were less likely to select certain reasons for disconnection. For example, compared to 18–24 year-olds, 35–44 year-olds were significantly less likely to report taking a break from social media as a reason for disconnection (OR = 0.40 [0.21–0.76], p = .006). This effect increased with age, with the oldest group the least likely to select this reason (OR = 0.17 [0.06–0.42], p < 0.001). We see similar patterns considering reports of reducing distraction to focus on work, or concerns over their safety online. That young people were more likely to select these responses than older people is likely due to young people spending more time on social media than older people (Parkhouse & Bryant, Citation2022). In other words, older people are less motivated to disconnect from social media, because they are less likely to have feelings of overuse.
Ethnicity was not associated with most responses. Although the marginal level of significance warrants some caution, we note that Māori respondents were more likely to report concerns over online safety as a reason for disconnection (compared to Pākehā respondents; OR = 1.89 [1.01–3.40], p = .038). This could be because Māori are more likely to experience online hate than Pākehā (Pacheco & Melhuish, Citation2018). Everyday racism is prevalent on the Internet and New Zealand social media groups, with 62% of comments in Stuff news media articles and 65% comments on Facebook determined as racist (Rapira & Beckett, Citation2018). Māori teenagers are more likely to receive unsolicited naked pictures and to be asked for naked pictures at a higher rate than any other ethnicity, despite many Māori teenagers believing that sexting is not a good idea (Netsafe, Citation2017). That Māori have additional safety reasons than Pākehā to disconnect is a reminder that disconnecting is not just a response to a social demanding and distracting Internet, but also from being discriminated against.
Higher levels of education were associated with higher odds of selecting reducing distractions from work as a reason for disconnection. For example, respondents with a tertiary degree or higher (L7–10) had more than six times greater odds of selecting this response compared to those with no high school education (OR = 6.27 [2.68–17.43], p < 0.001). People with university degrees are more likely to have jobs that involve either working on a computer, or using the Internet and social media, and are therefore professionally susceptible to digital distractions (Gregg, Citation2018). Unsurprisingly, employment status was also associated with the probability of selecting this response; compared to employed respondents, those who were unemployed (OR = 0.43[0.23–0.78], p = .007) or retired (OR = 0.23 [0.11–0.50], p < .001) were less likely to report reducing distraction from work as a reason for disconnection.
The societal and social cost of disconnection
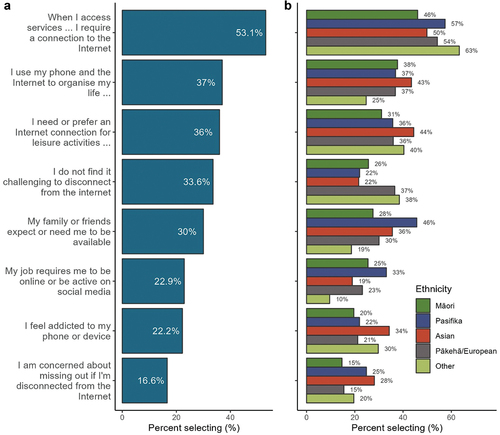
All participants were asked what barriers, if any, limited their ability to intentionally disconnect from the internet. Results suggest there is an increasing societal cost to disconnecting and are shown in . Most New Zealanders reported that they find disconnecting from the Internet challenging: over half of respondents (53.1%) reported that they cannot disconnect when needing to access public or private sector services that require a connection to the Internet. An increasing number of services (such as banking, accessing public transport or grocery shopping) are digitised and either require or are more accessible via the Internet. Leaving the smartphone at home when venturing into town or turning off the Wi-Fi can make accessing certain resources and services more difficult. Disconnecting is also challenging because of how Internet connectivity has become infrastructure for day-to-day life. The next most popular selected barriers to disconnecting were using the Internet for organising (37%) or leisure activities (36%). Diaries and calendars have been digitised into smartphone applications, and social media has become a key tool for scheduling, attending, and participating in social and community events. Smart wearables (e.g. Fitbit or Apple watches) and leisure apps (e.g. Strava, Goodreads) create opportunities to quantify and socialise leisure activities such as exercise or reading. Internet connectivity is increasingly intertwined with day-to-day life which can not only make disconnecting unfeasible but also undesirable.
Figure 5. Weighted proportions of respondents selecting barriers to intentionally disconnecting for all respondents (a), and by separated by ethnicity (b). We note that proportions for Pasifika (n = 20) and Other (n = 32) categories should be treated with caution due to low numbers.
As above, we report the results of logistic regression models investigating demographic predictors of the log odds of selecting a given barrier. Results are summarised in and reported in full in supplementary material Table S4. We remind the reader that these analyses should be treated as exploratory given the number of outcomes considered. We summarise selected responses below.
Figure 6. Heatmap detailing demographic predictors of barriers to intentionally disconnecting from the internet. Values represent odds ratios derived from logistic regression models, with significant effects highlighted. Red shaded cells indicate that a given group (vs reference group) is less likely to select a given response, blue cells the opposite. *p < .05, **p < .01, ***p < .001, †No respondents in this category selected response.
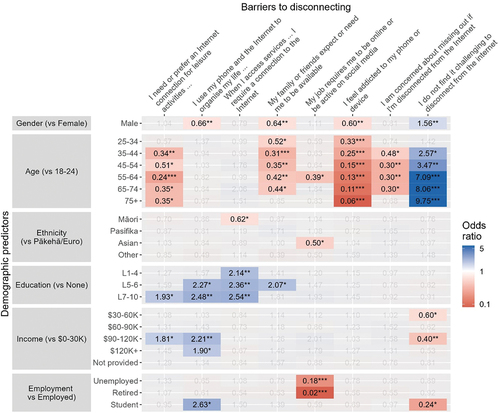
Age was a significant predictor of selecting several barriers to disconnection. Broadly, older respondents were less likely to report needing or preferring to use the Internet for leisure, expectations of availability, or fear of missing out. Notably age was a robust and relatively linear predictor of reporting feeling addicted to one’s phone or device. More than half of 18–24-year-olds in our sample reported that they feel addicted to social media. Compared to 18–24 year olds, 25–34 year olds were less likely to select this barrier (OR = 0.33 [0.17–0.62], p = .001). This effect increased with age, with the oldest age bracket of 75 years or older having the lowest odds (OR = 0.06 [0.01–0.21], p < .001). Young people were much less likely to select the option that they do not find disconnecting challenging.
There are several explanations for why young people reported finding it much harder to disconnect than older people. One explanation is that young people have a problematic relationship with social media, but the purpose of this paper is not to wade into debates about social media addiction (see Pellegrino, Stasi, & Bhatiasevi, Citation2022). Instead, we believe these findings demonstrate that young people have a significantly different relationship with social media and Internet connectivity than older people. Millennials and Generation Z have grown up with digital technologies and social media. To them, the Internet is not ‘cyberspace’, or a distinct place that you visit to look up information, but rather, social scaffolding that is taken with them everywhere they go. Media theorist Annette Markham (Citation2021) argues that social media activities such as posting and sharing are more than mere leisure for young people but forms a part of their self. Whereas previous generations socialised more in pubs, clubs and physical spaces, today’s young people have less physical independence and agency and socialise online (Boyd, Citation2014). As such, social media is central to young people’s lives (Anderson, Vogels, Perrin, & Rainie, Citation2022). For a young person, to disconnect is to lose access to spaces where identity formation occurs and therefore threatens a sense of their self. Put alternatively, the social costs of disconnecting are acutely felt by young people.
It is also notable that women reported finding it harder to disconnect then men. Men, compared to women, were less likely to report using their phone for organising their life, family and friends’ expectations of availability or feeling addicted as barriers (ORs 0.60–0.66, ps < .01). Males were also more likely to report not finding it difficult to disconnect (OR = 1.56 [1.15–2.10], p = .004). These findings support previous claims of a gendered privilege to disconnection. Drawing from feminist theory, Portwood-Stacer (Citation2014) and Beattie (Citation2020) argue that women may find it harder to disconnect than men, because of the societal norms that encourage women to manage and maintain relationships and events – both of which require sustaining a connection to the Internet. As such, disconnecting and suspending social ties may be normatively challenging for women.
Lastly, highly educated and higher income participants identified with certain barriers to disconnecting more than people with less education or lower income. Individuals reporting high school qualification or higher were also more likely to report requiring internet to access services, compared to those with no formal qualifications (ORs 2.14–2.54, ps < .01). Individuals with a tertiary degree (L7–10) were more than twice as likely to report needing their phone or the internet to organise their life, compared to those with no formal qualifications (OR = 2.48 [1.31–4.94], p = .007). Similarly, higher income individuals were also more likely to report using their phone to organise their life as barrier to disconnection. Compared to people earning less than $30,000, those earning $90,001–120,000 (OR = 2.21 [1.25–3.96], p = .007) or more than $120,001 (OR 1.90 [1.04–3.48], p = .038) had higher odds of selecting this response. It appears that having greater technological opportunities (such as owning smart devices or being connected to digital networks) can result in technological dependencies that people with less technological opportunities might not experience. As Nguyen and Hargittai (Citation2023) argue, disconnecting does not just arise from disadvantage but also privilege, with new digital inequalities emerging regarding who has the agency and capacity to moderate their Internet connectivity.
Conclusion
This study is the first to investigate voluntary disconnection in Aotearoa New Zealand. We have found that the majority of New Zealanders actively disconnect from the Internet, with most people favouring infrequent disconnection. We also found that New Zealanders switch off because being connected to the Internet and social media can be socially demanding and prohibitive to in-person interactions, distracting and, for Māori, unsafe. Moreover, we found that disconnecting is challenging for many New Zealanders and highlighted the specific societal and social costs of disconnecting that women, young people, and highly educated people acutely experience. Taken together, these findings indicate there is a human geography dimension of disconnection, where gender, age, ethnicity, socioeconomic status, amongst other sociodemographic factors, can inform opportunities and experiences of disconnecting from the Internet.
There are several limitations of this study and related future research opportunities. Firstly, we relied on self-reported data as opposed to observing New Zealanders disconnect from the Internet. Future studies could ask participants to disconnect from the Internet and report on their experiences. Our study was also exploratory and observed many different outcomes and socio-demographic variables. We call on researchers to test some of our findings (such as the gendered privilege and/or heightened social cost of disconnecting for young people) by undertaking purposive participant recruitment and testing specific hypotheses. Relatedly, our use of an online panel provider for research on disconnection carried some irony and risk of excluding people that are important to research when it comes to disconnection.
Furthermore, while we found that Māori are more likely than Pākehā to disconnect due to feeling unsafe, future research could explore if discrimination based on other factors, such as sexual orientation, identity, or disability are associated with disconnection. There are also other demographic variables that are worth investigating, such as whether location (e.g. living in an urban v rural area) or psychosocial factors (e.g. identifying as neurodiverse or extraverted v introverted) explain any differences or similarities with digital disconnection. Finally, repeat surveys and/or longitudinal research could investigate if digital disconnection behaviours and Internet connectivity experiences change over the lifespan.
Overall, this study has found that most New Zealanders disconnect from the Internet, there are various reasons driving disconnection, and it can be challenging to do so, especially for some New Zealanders. As more aspects of everyday life shift online, we hope this research brings to attention the multitude of experiences that New Zealanders have with Internet connectivity and the value of understanding digital disconnection.
Supplementary materials.docx
Download MS Word (45.6 KB)Disclosure statement
No potential conflict of interest was reported by the author(s).
Supplementary material
Supplemental data for this article can be accessed online at https://doi.org/10.1080/22041451.2024.2370184
Additional information
Funding
Notes
1. There is however a significant amount of research and policy in New Zealand on addressing ‘involuntary disconnection’, or increasing access to the Internet, or people who are permanently ‘disconnected’ (Grimes & White, Citation2019)
2. Aotearoa New Zealand is a settler country with a history of, and ongoing colonisation towards Māori. We recognise Te Tiriti o Waitangi and the equal rights and interest of Māori, and therefore report ethnicity data in , and to avoid grouping all New Zealanders into one category.
3. When participants were asked to report their gender, they were provided with sex terms ‘male’ and ‘female’. While acknowledging the distinction between sex and gender, we note this coding is recommended by Fraser (Citation2018) given comparability with other research and colloquial use. In discussing results, we refer to ‘men’ and ‘women’ as demographic groups.
4. The inclusion of ‘voluntary’ disconnection is to avoid participants thinking that we are interested in self-reported instances of involuntary disconnection (for example, losing mobile connectivity due to using all of the credit from a mobile data plan). News avoidance scholars have similarly called for an in/voluntary distinction in research materials to avoid conceptual ambiguity (see Skovsgaard & Andersen, Citation2019).
5. It is difficult to determine if 78.1% is a high number, given there are not any equivalent studies into the prevalence of disconnection in other countries.
References
- Adams, P. C., & Jansson, A. (2021). Introduction: Rethinking the entangling force of connective media. In A. Jansson & P. C. Adams (Eds.), Disentangling: The geographies of digital disconnection (pp. 1–20). Oxford: Oxford Academic.
- Al-Saggaf, Y., & O’Donnell, S. B. (2019). Phubbing: Perceptions, reasons behind, predictors, and impacts. Human Behavior and Emerging Technologies, 1(2), 132–140. doi:10.1002/hbe2.137
- Anderson, M., Vogels, E., Perrin, A., & Rainie, L. (2022). Connection, creativity and drama: Teen life on social media in 2022. Retrieved from https://www.pewresearch.org/internet/wp-content/uploads/sites/9/2022/11/PI_2022.11.16_Teens-Social-Media-Connection_FINAL.pdf
- Baumer, E. P. S., Adams, P., Khovanskaya, V. D., Liao, T. C., Smith, M. E., Sosik, V. S., & Williams, K. (2013). Limiting, leaving, and (re)lapsing: An exploration of facebook non-use practices and experiences. Proceedings of the SIGCHI Conference on Human Factors in Computing Systems, Paris, France. doi:10.1145/2470654.2466446
- Baumer, E. P. S., Guha, S., Quan, E., Mimno, D., & Gay, G. K. (2015). Missing photos, suffering withdrawal, or finding freedom? How experiences of social media non-use influence the likelihood of reversion. Social Media + Society, 1(2), 2056305115614851. doi:10.1177/2056305115614851
- Baumer, E. P. S., Guha, S., Skeba, P., & Gay, G. (2019). All users are (not) created equal: Predictors vary for different forms of Facebook non/use. Proceedings of the ACM on Human-Computer Interaction, 3(CSCW), Article 80. doi:10.1145/3359182
- Beattie, A. (2020). The manufacture of disconnection. Te Herenga Waka -Victoria University of Wellington. Retrieved from https://researcharchive.vuw.ac.nz/handle/10063/9362
- Beattie, A., & Cassidy, E. (2021). Locative disconnection: The use of location-based technologies to make disconnection easier, enforceable and exclusive. Convergence: The International Journal of Research into New Media Technologies, 27(2), 395–413. doi:10.1177/1354856520956854
- Blainey, G. (1966/2001). The tyranny of distance: How distance shaped Australian history (3rd ed.). Clerkenwell: Pan Macmillan.
- Boyd, D. (2014). It’s complicated : The social lives of networked teens. New Haven: Yale University Press.
- Büchi, M., Festic, N., & Latzer, M. (2019). Digital overuse and subjective well-being in a digitized society. Social Media + Society, 5(4), 2056305119886031. doi:10.1177/2056305119886031
- Coster, H. (2022). More people are avoiding the news, and trusting it less, report says. Reuters. Retrieved from https://www.reuters.com/business/media-telecom/more-people-are-avoiding-news-trusting-it-less-report-says-2022-06-14/
- Digital Government. (2021). Report: Digital inclusion user insights — Māori. Retrieved from https://www.digital.govt.nz/dmsdocument/177~report-digital-inclusion-user-insights-maori/html
- Franks, J., Chenhall, R., & Keogh, L. (2018). The Facebook sabbatical as a cycle: Describing the gendered experience of young adults as they navigate disconnection and reconnection. Social Media+ Society, 4(3), 2056305118801995. doi:10.1177/2056305118801995
- Fraser, G. (2018). Evaluating inclusive gender identity measures for use in quantitative psychological research. Psychology and Sexuality, 9(4), 343–357. doi:10.1080/19419899.2018.1497693
- Gaafar, A. S. M., & Allah, H. (2021). Digital detox tourism at the Egyptian destination: Attitudes and motivators. Journal of Association of Arab Universities for Tourism and Hospitality, 20(2), 88–107. doi:10.21608/jaauth.2021.62562.1130
- Glimp. (2020). New Zealand’s mobile data among the most wxpensive in the world. Glimp. Retrieved from https://www.glimp.co.nz/nz-mobile-data-one-of-the-worlds-most-expensive
- Glimp. (2021). New Zealand Internet cost vs the world. Retrieved from https://www.glimp.co.nz/new-zealand-internet-cost-vs-the-world
- Graham, S., Mason, A., Riordan, B., Winter, T., & Scarf, D. (2021). Taking a break from social media improves wellbeing through sleep quality. Cyberpsychology, Behavior, and Social Networking, 24(6), 421–425. doi:10.1089/cyber.2020.0217
- Gregg, M. (2018). Counterproductive: Time management in the knowledge economy. Durham: Duke University Press.
- Grimes, A., & White, D. (2019). Digital inclusion and wellbeing in New Zealand. Wellington, New Zealand: Motu Economic and Public Policy Research Trust. https://motu-www.motu.org.nz/wpapers/19_17.pdf
- Haigh, A. (2015). Stop phubbing. Retrieved from http://stopphubbing.com
- Halfmann, A., & Rieger, D. (2019). Permanently on call: The effects of social pressure on smartphone users’ self-control, need satisfaction, and well-being. Journal of Computer-Mediated Communication, 24(4), 165–181. doi:10.1093/jcmc/zmz008
- Hargittai, E. (2002). Second-level digital divide: Differences in people’s online skills. First Monday, 7(4). doi:10.5210/fm.v7i4.942
- Hedges, M., Pacheco, G., & Turcu, A. (2023). The world Internet project 2023. Auckland: New Zealand Work Research Institute.
- Hunn, J. K. (1961). Report on department of Maori affairs: With statistical supplement, 24 August 1960/by J.K. Hunn. Wellington, NZ: Govt. Printer.
- Jorge, A. (2019). Social media, interrupted: Users recounting temporary disconnection on Instagram. Social Media + Society, 5(4), 2056305119881691. doi:10.1177/2056305119881691
- Kaun, A., & Schwarzenegger, C. (2014). “No media, less life?” Online disconnection in mediatized worlds. Mediatization, Media Life, Media Experiences, Media Connection, Media Disconnection, 2014. doi:10.5210/fm.v19i11.5497
- Kaun, A., & Treré, E. (2018). Repression, resistance and lifestyle: Charting (dis)connection and activism in times of accelerated capitalism. Social Movement Studies, 1–19. doi:10.1080/14742837.2018.1555752
- Keogh, B., & Fuller, P. (2023). Wellington Girls’ College bans phones in class after ‘constant battles’ with distracted students. The Post. Retrieved from https://www.thepost.co.nz/a/nz-news/350037886/wellington-girls-college-bans-phones-class-after-constant-battles-distracted
- Lee, H., Ahn, H., Choi, S., & Choi, W. (2014). The SAMS: Smartphone addiction management system and verification. Journal of Medical Systems, 38(1), 1. doi:10.1007/s10916-013-0001-1
- Light, B. (2014). Disconnecting with social networking sites. Clerkenwell: Palgrave MacMillan.
- Light, B., & Cassidy, E. (2014). Strategies for the suspension and prevention of connection: Rendering disconnection as socioeconomic lubricant with Facebook. New Media & Society, 16(7), 1169–1184. doi:10.1177/1461444814544002
- Mannell, K. (2018). A typology of mobile messaging’s disconnective affordances. Mobile Media & Communication, 7(1), 76–93. doi:10.1177/2050157918772864
- Markham, A. N. (2021). Echolocation as theory of digital sociality. Convergence: The International Journal of Research into New Media Technologies, 27(6), 1558–1570. doi:10.1177/13548565211047158
- McCullagh, P. (2014). Proportional odds model: Theoretical background. Wiley StatsRef: Statistics Reference Online. doi:10.1002/9781118445112.stat05796
- Meredith, P. (2015). Urban Māori. Retrieved from https://teara.govt.nz/en/urban-maori/print
- Nassen, L.-M., Vandebosch, H., Poels, K., & Karsay, K. (2023). Opt-out, Abstain, unplug. A systematic review of the voluntary digital disconnection literature. Telematics and Informatics, 81, 101980. doi:10.1016/j.tele.2023.101980
- Netsafe. (2017). Teens and sexting report. Netsafe. Retrieved from https://netsafe.org.nz/teens-sexting-report/
- Newport, C. (2019). Digital minimalism: Choosing a focused life in a noisy world. London: Portfolio.
- Nguyen, M. H. (2023). “Maybe I should get rid of it for a while … ”: Examining motivations and challenges for social media disconnection. The Communication Review, 26(2), 125–150. doi:10.1080/10714421.2023.2195795
- Nguyen, M. H., Büchi, M., & Geber, S. (2022). Everyday disconnection experiences: Exploring people’s understanding of digital well-being and management of digital media use. New Media & Society, 14614448221105428. doi:10.1177/14614448221105428
- Nguyen, M. H., & Hargittai, E. (2023). Digital inequality in disconnection practices: Voluntary nonuse during COVID-19. Journal of Communication, 73(5), 494–510. doi:10.1093/joc/jqad021
- O’Carroll, A. D. (2013). Kanohi ki te kanohi, a thing of the past? Examining the notion of virtual ahikā and the implications for kanohi ki te kanohi. Pimatisiwin: A Journal of Aboriginal and Indigenous Community Health, 11(3), 441–455.
- Ofcom. (2016). Communications market report 2016. Retrieved from https://www.ofcom.org.uk/__data/assets/pdf_file/0024/26826/cmr_uk_2016.pdf
- Pacheco, E., & Melhuish, N. (2018). Online hate speech: A survey on personal experiences and exposure among adult New Zealanders. Retrieved from https://www.netsafe.org.nz/wp-content/uploads/2019/11/onlinehatespeech-survey-2018.pdf
- Parkhouse, E., & Bryant, C. (2022). New Zealand’s Internet insights 2022: A Kantar public research report. Retrieved from https://internetnz.nz/assets/Uploads/Internet-insights-2022.pdf
- Pellegrino, A., Stasi, A., & Bhatiasevi, V. (2022). Research trends in social media addiction and problematic social media use: A bibliometric analysis [systematic review]. Frontiers in Psychiatry, 13, 13. doi:10.3389/fpsyt.2022.1017506
- Plaut, E. (2023). Strategic illiteracies: The long game of technology refusal and disconnection. Communication Theory, 33(1), 21–31. doi:10.1093/ct/qtac014
- Portwood-Stacer, L. (2012). Media refusal and conspicuous non-consumption: The performative and political dimensions of Facebook abstention. New Media & Society, 15(7), 1041–1057. doi:10.1177/1461444812465139
- Portwood-Stacer, L. (2014). Care work and the stakes of social media refusal. New Criticals. Retrieved from http://www.newcriticals.com/care-work-and-the-stakes-of-social-media-refusal/prin
- Rapira, L. O. C., & Beckett, L. (2018). The people’s report on online hate and harassment and abuse. Retrieved from https://actionstation.org.nz/publications
- Schmuck, D. (2020). Does digital detox work? Exploring the role of digital detox applications for problematic smartphone use and well-being of young adults using multigroup analysis. Cyberpsychology, Behavior, and Social Networking, 23(8), 526–532. doi:10.1089/cyber.2019.0578
- Skovsgaard, M., & Andersen, K. (2019). Conceptualizing news avoidance: Towards a shared understanding of different causes and potential solutions. Journalism Studies, 21(4), 459–476. doi:10.1080/1461670X.2019.1686410
- Skowronek, J., Seifert, A., & Lindberg, S. (2023). The mere presence of a smartphone reduces basal attentional performance. Scientific Reports, 13(1), 9363. doi:10.1038/s41598-023-36256-4
- Speedtest. (2023). New Zealand Median country speeds June 2023. Speedtest. Retrieved from https://www.speedtest.net/global-index/new-zealand
- Syvertsen, T., & Enli, G. (2019). Digital detox: Media resistance and the promise of authenticity. Convergence, 1354856519847325. doi:10.1177/1354856519847325
- Treré, E., Natale, S., Keightley, E., & Punathambekar, A. (2020). The limits and boundaries of digital disconnection. Media, Culture & Society, 42(4), 605–609. doi:10.1177/0163443720922054
- Vanden Abeele, M. M. P., Halfmann, A., & Lee, E. W. J. (2022). Drug, demon, or donut? Theorizing the relationship between social media use, digital well-being and digital disconnection. Current Opinion in Psychology, 45, 101295. doi:10.1016/j.copsyc.2021.12.007