
 ?Mathematical formulae have been encoded as MathML and are displayed in this HTML version using MathJax in order to improve their display. Uncheck the box to turn MathJax off. This feature requires Javascript. Click on a formula to zoom.
ABSTRACT
Project-based learning is a key approach to better preparing students for professional engineering practice. An overview of current practice within Australia & New Zealand is needed to better support academics and their Learning and Teaching leadership in improving their practice. This paper benchmarks current project-based learning practice in Australian & New Zealand universities to identify how project-based learning is currently being delivered as well as challenges associated with project-based learning. Key considerations noted in our research include a variety in the reasons and subsequent designs for project-based learning, workload concerns for unit coordinators, a need to better support authentic project-based learning experiences, as well as a need to manage expectations around student satisfaction. These findings highlight key concerns associated with current practice and provide data for academics and their Learning and Teaching leadership to understand and take steps to ameliorate the challenges of project-based learning.
1. Introduction
The nature of engineering in practice involves complex problems and working in teams that are often interdisciplinary (de Graaf and Kolmos Citation2003; Hadgraft and Kolmos Citation2020). Socio-technical aspects are key to engineering practice (Trevelyan Citation2019), and successful graduates have identified that skills such as teamwork and emotional intelligence (both social and personal) are key to their success (Scott and Yates Citation2002). Replicating engineering practice within the curriculum would be beneficial to students’ development as engineers (Lawrence Citation2020) and project-based learning (PjBL) does this by exposing them to complex, real-world problems to develop these skills through authentic practice (Hadgraft and Kolmos Citation2020). However, there are some challenges to its long-term sustainability and scalability (Crosthwaite Citation2021). Many of these challenges have been highlighted in specific contexts, but not quantified across the Australian & New Zealand engineering education sector. What is lacking is an understanding of the broader PjBL landscape so that coordinators and L&T leadership can situate and benchmark their own practice to advocate for and enact change in their PjBL units. Hence, this study quantifies current practice in engineering PjBL learning and identifies sector-wide challenges across a range of universities and PjBL courses. This data will inform institutional improvements to existing PjBL offerings and highlight improvements required to retain existing PjBL coordinators and encourage wider adoption of PjBL approaches.
2. Literature Review
PjBL engages students in authentic learning experiences that have practical industry relevance (Blumenfeld et al. Citation1991; Herrington and Herrington Citation2006) and has strong similarity with problem-based learning where students also work on solving open-ended problems; however, Mills and Treagust (Citation2003) delineate project-based learning from problem-based learning as: closer to professional practice; requiring longer periods of time; more directed to application of knowledge; focused on management of time and resources; and requiring greater self-direction.
As PjBL is defined by its central premise of a problem in the form of a project, it can take a range of forms. Morgan (Citation1983) identified three models commonly used in teaching: the project exercise; the project component; and the project orientation. The project exercise involves the application of knowledge and skills that students have previously acquired, often on research-oriented, academic topics; the project component involves greater application of problem-solving skills and independent work, often to solve interdisciplinary, contemporary issues; and the project orientation involves a cross-curriculum approach where projects constitute the entirety of a degree’s educational experience. Examples of project orientation, such as Aalborg University (Denmark) and Olin College (US), are rare.
Benefits of PjBL include the development of professional skills and identity – including better communication and teamwork skills – as well as a better understanding of the complexities of practice and how to apply knowledge in practice (Mills and Treagust Citation2003). In helping students to better understand the role of engineers and generating a clearer target for career development, PjBL’s alignment with engineering practice can have a positive impact on student motivation to engage with course material (Harris and Bigham Citation2014; Li and Howell Citation2019; Stappenbelt and Rowles Citation2009). PjBL can also increase depth of understanding of engineering concepts (Harris and Bigham Citation2014; Stappenbelt and Rowles Citation2009), as well as improve students’ capacities for self-directed learning, accountability for outcomes and problem-solving skills (Wildermoth and Rowlands Citation2012) as it aligns with real engineering problems and design processes.
Significant time is required to design and prepare a project (Zhuge and Mills Citation2009). Care must be taken in the design of the project to meet learning outcomes whilst also remaining engaging to students (Wildermoth and Rowlands Citation2012). Moreover, it is often necessary to find a compromise between developing student learning outcomes and ensuring value for the industry collaborator. As a result, academics can fall into the trap of diluting the industry problem to ensure students can demonstrate a particular knowledge set (e.g. by turning an open-ended problem into a closed problem), which results in the learning experience becoming inauthentic (Ståhl, Sandahl, and Buffoni Citation2022).
PjBL requires substantial preparation to ensure consistency amongst members of the teaching team. Staff training on how best to facilitate PjBL, e.g. around design process, teamwork, team management and cultural sensitivity, is necessary (Stappenbelt and Rowles Citation2009; Zhuge and Mills Citation2009). Develop a shared philosophy and approach to PjBL amongst the teaching team is also important because inconsistencies in their attitudes to PjBL can lead to inconsistent learning experiences across a large cohort (Inchbold-Busby and Goldsmith Citation2017). In a similar vein, there is also a greater need for coordination amongst the teaching team to ensure that expectations for students are clear so that student messaging is consistent (Felipe et al. Citation2017).
The workload during term is also significant. Many PjBL coordinators have reported team organisation and the need to train students in teamwork as requiring considerable effort (Felipe et al. Citation2017; Frank, Lavy, and Elata Citation2003; Harris and Bigham Citation2014; Schaller and Hadgraft Citation2013; Tse and Bona Citation2019). Issues with group work management can have significant negative impact on the student learning experience (Hall, Palmer, and Bennett Citation2012; Mills and Treagust Citation2003), so there is also a need to provide ongoing guidance to students and regularly check that students are on track (Zhuge and Mills Citation2009). Moreover, marking for project reports can be onerous than test-based assessments and more time for marking is needed (Zhuge and Mills Citation2009).
Industry involvement in project-based capstones can be highly beneficial to both industry partners and students. Benefits for industry partners include students’ creative ideation, greater awareness of their company and access to potential employee, whilst benefits for students include the opportunity to work on real-world problems and build their professional identity (Goldberg et al. Citation2014). However, Chattopadhyay and Larkins (Citation2020) indicate that industry-based projects often do not align with university timelines. There is also a need to ensure industry partner expectations are in line with unit requirements (Goldberg et al. Citation2014).
It is widely acknowledged that assessment drives learning (Boud Citation1995). Hence, it is important to constructively align assessment with the aims of PjBL to ensure that the assessment drives engagement in the PjBL approach to learning (de Graaff and Kolmos Citation2003). McKenzie et al. (Citation2004) identified typical assessments for project-based capstones in the US include oral presentations, final written reports, intermediate reports and self/peer-assessment. Other assessment types, such as portfolios and focus groups/interviews, were used by some coordinators, but were less common. In a snapshot of Australian & New Zealand project-based units, assessment tasks are similarly focused on written reports (Felipe et al. Citation2017; Harris and Bigham Citation2014; Hogan Citation2012; Li and Howell Citation2019; Stappenbelt and Rowles Citation2009; Tse and Bona Citation2019; Wildermoth and Rowlands Citation2012; Zhuge and Mills Citation2009) and oral presentations (Felipe et al. Citation2017; Hogan Citation2012; Tse and Bona Citation2019; Wildermoth and Rowlands Citation2012). Reflections (Hogan Citation2012; Tse and Bona Citation2019), peer evaluation (Felipe et al. Citation2017) and exams (Harris and Bigham Citation2014; Zhuge and Mills Citation2009) were also used.
Student feedback on PjBL is mixed. Some researchers (Wildermoth and Rowlands Citation2012) have found that students find the project to be challenging and relevant; however, students have also indicated that adapting to PjBL can be a challenge, especially due to it being a different approach to learning especially compared to their other units (Goldfinch et al. Citation2019). Amongst some students, this can lead to resistance to the open-ended nature of a project, as well as participation in group tasks associated with the project (Inchbold-Busby and Goldsmith Citation2017).
3. Summary
Current challenges include workloads associated with design and delivery of units, difficulties in ensuring authenticity of projects and industry involvement, poor student satisfaction and a lack of guidance around sustainable practice. Whilst all these challenges and potential barriers have been shown to exist in different contexts, there is little in the way of sector-wide data that quantifies the prevalence of these challenges. Such data is needed for the Australian engineering education sector to respond to the Engineering 2035 recommendations in an effective and targeted manner.
4. Objective
The objective of this project is to provide guidance on what coordinators and leadership can do to ensure PjBL is sustainable in light of Engineering 2035. This study focuses on the following research question: what are the current practices and challenges in current PjBL practice?
5. Method
To build a snapshot of the current landscape of PjBL around Australia & New Zealand, a desktop study was conducted to collate data on inputs and approaches, staffing ratios, budget, outcomes of student satisfaction surveys, delivery style, unit design philosophy, unit format and project focus. The data collection drew on openly-available unit data in university handbooks, as well as open-ended survey data from coordinators regarding their units. The ethical aspects of this study have been approved per UNSW HREAP H: Science/Engineering REF NO. HC210523. Unit workload was calculated from estimates of actual coordinator workloads (provided by coordinators on hours spent on coordination, sourcing projects, lecturing, marking and tutor training) and casual teaching hours. Where a casual teaching budget was provided, the casual teaching hours were approximated by dividing by the hourly non-PhD tutorial rate from 2020 for the university (obtained from the enterprise/collective agreements).
Data from 66 units (also known as courses, subjects or papers) across 15 Australian & New Zealand universities were collected. Of the 66 units reviewed, the majority of the units (n = 43) are discipline-based with the remainder taught across disciplines (n = 21) or with non-engineering students (n = 2). Moreover, 55 units are core units, whilst 11 are elective units. The cross-engineering units are often large (>120 students), first-year units and the two units taught with non-engineering students are electives. Some units (n = 8) were coordinated by more than one academic. Moreover, units badged with the same unit code but run at separate campuses (n = 4) were treated as separate units. Data on several units was incomplete due to privacy and operating constraints.
Appropriate statistical tests were identified and applied to the data. These are reported in the Results & Discussion section. An α = 0.05 was selected to determine statistical significance. The study collected both 2020 (early pandemic) data and 2017–2019 (pre-pandemic) average data as it was unclear during data collection whether there would be pandemic-related impacts due to the shift to blended and online teaching modes. It was noted that student numbers and workload were not significantly affected by the pandemic, so the data from 2017–19 and 2020 were combined; however, student satisfaction was noted to be impacted by the pandemic.
6. Results & discussion
Below, we outline key findings and insights into challenges such as unit design, academic staffing and workloads, industry involvement, assessment and student feedback in PjBL units. We have defined units by size (small <20 students, medium 20–120, large > 120). No discernible difference was noted between core and elective units other than size.
7. Unit design
There is much variety in the focus of projects that are used in PjBL in Australian & New Zealand universities. Rationales for designing PjBL experiences in engineering education are also highly varied, with reasons cited for using a PjBL approach including:
building professional identity and an understanding of the complexities of professional practice (n = 27)
application of skills and knowledge through real-world problems (n = 20)
building professional skills, e.g. communication and teamwork (n = 25)
building technical skills (n = 11)
a history of PjBL in the unit (n = 9)
student engagement (n = 9)
student satisfaction (n = 6)
support from management (n = 3)
alignment with other units in the curriculum (n = 2)
student retention (n = 2)
accreditation requirements (n = 1)
Of the units that provided data on delivery methods for 2017–2019 and 2020 (n = 59), unit delivery was predominantly in face-to-face (n = 39) and blended (n = 20) modes prior to 2020. In contrast, unit delivery in 2020 shifted towards blended learning (n = 24) and online modes such as online-only and hybrid (n = 33) as necessitated by pandemic measures, with only two offerings that remained face-to-face only (n = 2).
It is unclear from the literature how to quantitatively define a project exercise vs how to define a project component (Morgan Citation1983). We define units that have greater than 50% test-based assessment as‘project exercise’ in approach and units that scaffold the project process (i.e. have a preliminary and/or mid report) as project component in approach. Using this classification, of the 66 units in our study, there are 9 units that use a project exercise approach whilst there are 30 units that use a project component approach. Project exercise units are more common in second (n = 3) and third (n = 3) year units, whilst project component units are more common in first (n = 9) and final (n = 9) year units.
Different models of using PjBL along the length of a degree include:
a multidisciplinary 1st year & single-disciplinary units from 1st to 4th year (e.g. UTS)
a multidisciplinary 1st year & single-disciplinary units onwards (e.g. UNSW)
a multidisciplinary 1.5 years & single-disciplinary units onwards (e.g. Massey)
a multidisciplinary 1st and 2nd year & single-disciplinary units onwards (e.g. CQU)
a multidisciplinary 1st to 4th year (e.g. USyd pre-2022, Macquarie)
a multidisciplinary 2nd and 3rd year (e.g. USyd post-2022)
Whilst we find project orientation in overseas institutions (e g. Olin College), it is far more typical to find intermediate models in Australia & New Zealand. Many institutions have models of PjBL in ‘cornerstone’ units, often in junior unit offerings and some along the full length of the degree (using a spine model, where core design units run each year and form a vertically integrated curriculum, e.g. Blackmore, Browne, and Smith Citation2019; Tse and Bona Citation2019).
There is increasing interest in interdisciplinary projects so that students build a better understanding of engineering practice and their place in society. Engineering educators and industry are calling for greater exposure to interdisciplinary components within the curriculum (e.g. Hadgraft and Kolmos Citation2020). Whilst some units bring together different engineering disciplines, our study only identified two units (at the University of Sydney and the University of Melbourne) where non-engineering students were involved and both are elective units run in conjunction with a business unit. This concurs with Crosthwaite (Citation2021), who indicates that Australian examples of projects that bring together engineering and non-engineering students are relatively rare (e.g. Kavanagh and Cokley Citation2011, with journalism students; Prpic and Hadgraft Citation2011 with science, environments, commerce and arts students; Lynch et al. Citation2019 with environmental science students) and that these units are often short-lived as they rely on individual academics to champion them. Of these units, two (Kavanagh and Cokley Citation2011; Prpic and Hadgraft Citation2011) are now discontinued and one (Lynch et al. Citation2019) no longer runs with non-engineering students.
8. Academic staffing and workloads
8.1. Unit coordinator profile
PjBL is used by academics across all levels; however, larger units are often coordinated by junior staff () and these larger classes tend to be first-year units. Only two units coordinated by a level A (junior) academic had a cohort of less than 120 students. Data associated with external academics (n = 1) was removed and an independent samples t-test was conducted to assess whether the mean student numbers of junior academics (Levels A – B) is significantly higher than senior academics (Levels C – D). Descriptive statistics for the student numbers in each group are:
Figure 1. Coordinator level with class size for all units (n = 75).
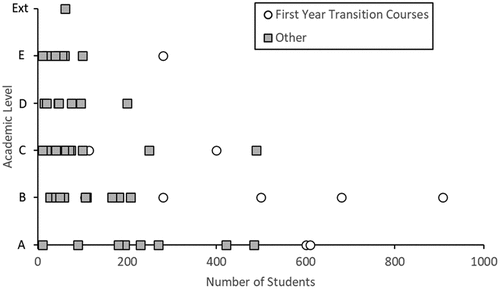
Junior academics (Levels A – B): n = 30, M = 238.53, SD = 224.46
Senior academics (Levels C – D): n = 44, M = 75.16, SD = 99.46
Student numbers were log-transformed to reflect the relatively lower impact of changes in student numbers as class sizes increase. The independent samples t-test yielded a statistically significant result (t(72) = 4.76, p < .001, two-tailed). The effect size was measured by Cohen’s d; a large effect was noted, and the positive value confirmed that junior academics have greater student numbers than senior academics (d = 1.13).
At some institutions (e.g. RMIT), there are clear limits placed on the units that junior staff can coordinate in the enterprise agreement; however, at many institutions (e.g. USyd, Macquarie University, UWA), the enterprise agreements simply indicate teaching expectations should be commensurate with skills and experience. The tendency for larger, junior units to be coordinated by junior staff appears to be a widespread and long-standing occurrence across Australian & New Zealand universities. Dobele et al. (Citation2014) found that junior academics in business schools take a substantial part of the teaching workload at RMIT and Griffith University. Furthermore, Reilly (Citation1985) found that, in language teaching at the University of Melbourne, senior staff believed that, whilst junior staff may take a greater teaching load in terms of units and student numbers, this is offset by the complexity of research and disciplinary depth required to prepare for senior units. Although possibly outdated, a similar comment was made by engineering academics during our project which suggests this concept is entrenched. What this does not acknowledge is that modes of learning such as PjBL require complex and lengthy preparation. This is particularly concerning as Kavanagh et al. (Citation2012) noted that junior staff in engineering faculties often feel powerless to change teaching culture at their institutions.
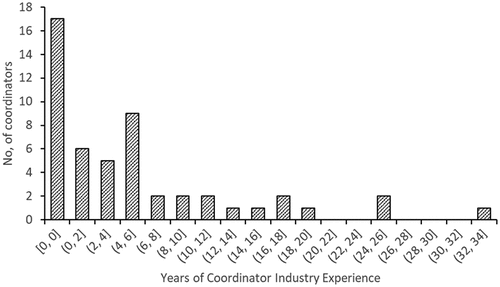
Coordinators have highly variable experience in industry (). Whilst 33% of coordinators have no industry experience, 46% of coordinators have significant industry experience (>5 years). The 1st quartile of experience is 0 years, the second quartile (median) is 4 years and the third quartile is 7 years.
Figure 2. Coordinators’ industry experience (n = 52).
8.2. Unit workload
To assess whether the pandemic had a statistically significant impact on the student numbers and workload, the dataset was reduced to paired data from 2017–19 & 2020 (n = 56 for student numbers, n = 28 for total workload, n = 28 for coordinator workload, n = 40 for casual workload). Of the 28 units that had total workload data from both 2017–19 and 2020, 21 units indicated a change in delivery mode whilst only 4 units indicated no change. It was hypothesised that the transition from predominantly face-to-face and blended offerings to predominantly online and blended offerings might have an impact on workload. Wilcoxon signed-rank tests were conducted to explore this. Student numbers and workload were log-transformed due to interest in relative changes. The Wilcoxon signed-rank test showed that there was no statistically significant difference in student numbers (T = 497.0, p = .478, two-tailed), in total workload (T = 18.0, p = 1, two-tailed), in coordinator workload (T = 7.0, p = .463, two-tailed) and in casual workload (T = 18.0, p = 1, two-tailed) between 2017–19 and 2020; the pandemic did not affect student numbers and student workload.
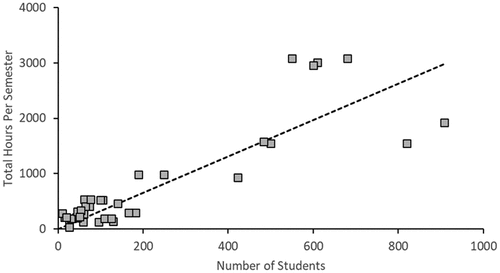
The total unit workload hours (coordinator + sessional staff) () increase with cohort size. A Kendall’s tau correlation was used to explore the relationship between student number and total workload (n = 58). A statistically significant positive correlation ( = 0.431; p < .001) was noted. The τ-value suggests there is a medium effect size and hence a moderate association between student number and total workload. Moreover, the positive value highlights that as the number of students increases, there is a tendency for a higher total workload. A linear regression analysis was subsequently performed with an assumed intercept of 0 (as there is no workload associated with no students). The fitted regression model was: total workload (hrs) = 3.554 × student number. This regression was statistically significant (R2 = 0.849, F(57) = 321.3, p < .001) and suggests that, on average, resourcing of 3.5 hrs per student is allocated for PjBL units.
Figure 3. Total hours vs student number (n = 70), where total hours = 3.291 x student number (R2 = 0.832).
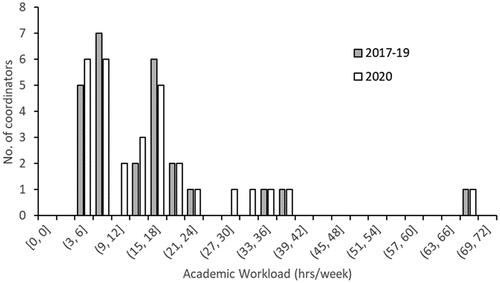
The mean coordinator workload per week is 14.8 hrs/week (SD = 13.15) (). Coordinator workload per week was calculated assuming that two weeks before and after each term is also dedicated to the unit (i.e. each equivalent term is the university’s term length +4 weeks). Given a 1FTE of 37.5 hrs/week, the mean workload is equivalent to 0.4FTE; however, some coordinators reported workloads of > 1FTE. Workload concerns are not uncommon for educators who use PjBL (Brown Citation2020). Relatively low coordinator workloads are often offset by higher casual budgets, which can be interpreted as higher casual budgets allowing academics to reduce their workload. Since larger units tend to be coordinated by junior staff, who are likely to have less agency in seeking adequate budgets, this raises concern over how these larger units are supported. Approximately half of the units in our study (n = 31) have multiple academic staff on the teaching team, with several (n = 10) having 5+ academic staff. In contrast, multiple staff with coordination responsibilities for the same unit is less common (n = 8). This concurs with findings from the UK that PjBL unit coordinators are often ‘lone champions’ with limited time, resourcing and support (Graham and Crawley Citation2010). For small units, there is often no casual teaching budget. There are also medium-cohort units that run on minimal casual budgets, which are often resourced by multiple academic staff instead.
Figure 4. Coordinator workload (n = 26 for 2017–19; n = 30 for 2020).
Other resources not included here are consumables and costs associated with participation in design challenges. With this funding being up to $20,000 (equivalent to over 350 hrs), this can significantly offset coordinator and casual hours.
9. Industry involvement
As highlighted by , many coordinators have less than 5 years of industry experience. However, there are many ways in which a coordinator can compensate for their own lack of industry experience, including: finding mentors with greater industry experience; bringing in tutors with industry experience; and using industry partners in teaching (e.g. guest lectures, project briefs, marking). In our study, we focused on remunerated contributions and found only a few units (n = 9) drew on industry experts as part of the teaching team. Of these units, one unit is coordinated by an affiliate staff member who predominantly works in industry, whilst one unit is mainly coordinated by an industry partner but has an ‘official’ academic coordinator who performs minor administrative tasks. Industry partners who provided guest lectures and supported the development of project scopes were generally not remunerated.
Most units in this study (n = 50) contain projects based on real-world problems that are determined by the coordinator. Of these units, 29 were run by a coordinator with less than 5 years of industry experience. Given the lack of significant industry experience among coordinators who are determining the project brief, it is necessary to have greater direct involvement of industry partners to ensure authenticity of learning practices. However, only 16 units (n = 16) have external industry input into the project brief and 3 of these units are challenge-based where the process of determining the project brief is transferred to external challenge project organisers.
10. Assessment
10.1. Assessment types and structure
shows the different types of assessments used in PjBL units and their prevalence along the length of the degree. Product-oriented assessments include preliminary reports, mid-project reports, final reports and presentations. There are also process-based assessment types, such as portfolios, logs, reflections, as well as self/peer-review (where students are assessed on their review of either their own or other students’ work). There are also quizzes and exams (tests) which do not assess the project but rather assess knowledge and understanding of course content. Other assessment components include class participation, professional conduct, self/peer-assessment (where marks are adjusted based on student contribution) and laboratory tasks.
Figure 5. Types of assessment along the length of the degree (n = 14 for 1st year; n = 9 for 2nd year; n = 20 for 3rd year; n = 15 for 4th year; n = 8 for postgraduate; n = 66 for all).
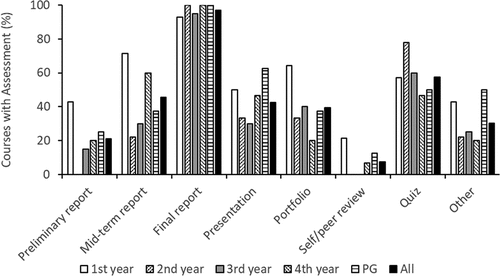
As expected, the most prevalent assessment type is the final report; it is used in all but 1 unit, where the project is assessed solely through a portfolio. Written reports are often considered to align with industry standards and requirements (Stappenbelt and Rowles Citation2009). The second most prevalent assessment type is some form of a test to assess knowledge of unit content. Our unit data indicates that quizzes and exams are seen to ensure individual student competency, meet institutional requirements for individual marks, and assess concepts not addressed through the project. Fugate (Citation2018) suggests that test-based assessment is a necessary complement to project work, as a significant number (25%) of students assessed through an exam in a PjBL unit performed differently, often more poorly, than in their project work.
There are different scaffolding requirements as students progress from first to final year, which are reflected in the assessment structure for a unit. Atman et al. (Citation2005) compared design solutions generated by first-year and final-year engineering students and found improvements in the quality of the work as they progressed through the degree. In particular, they noted that first-year students spend limited time on problem scoping and ideation stages. In our study, the recognition of the need to support first-year students in these stages is reflected in a Fisher’s exact test indicating a statistically significant relationship between the use of mid-project reports, as well as portfolios, logs and reflections in the assessment structures of first-year units when compared to later-year units (p = .025 and p = .007 respectively). Coordinators also highlight that providing opportunities for feedforward through these scaffolding tasks not only better supports student learning experience, but also better reflects the nature of the engineering workplace.
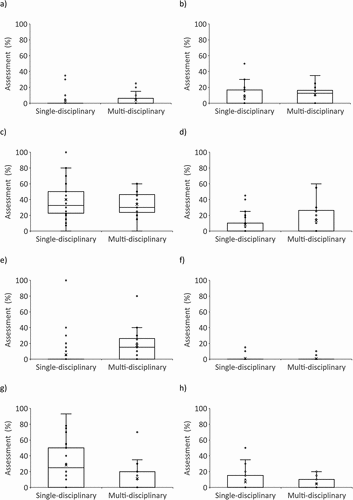
shows that the assessment structures for multidisciplinary and single-disciplinary units differ significantly. There is a tendency for multi-disciplinary units to document the project through portfolios, logs and reflections, which was noted to be statistically significant according to a Mann-Whitney U test (U = 729.0, p < .001). Moreover, Fisher’s exact tests indicate that this use of portfolios, logs and reflections is linked to learning outcomes such as professional conduct (p = .046) and teamwork (p = .035). Given the different foci of multidisciplinary and single-disciplinary units in terms of learning outcomes (discussed further below), this reflects constructive alignment in assessment design.
Figure 6. Assessment prevalence in multidisciplinary units (n = 22) and single-disciplinary units (n = 44) for a) preliminary reports, b) mid-project reports, c) final reports, d) presentations, e) portfolios, logs and reflections f) self/peer-review, g) tests and h) other assessment types.
10.2. Learning outcomes
Unit learning outcomes were coded against the EA Stage 1 Elements of Competency (EoC) in two categories, namely technical learning outcomes (1.1–6 Knowledge and Skill Base & 2.1–4 Engineering Application Ability), as well as professional learning outcomes (3.1–6 Professional and Personal Attributes). These also correspond with the Engineering New Zealand (Citation2020) competencies due to alignment with the Washington and Sydney Accords. Where a learning outcome spanned multiple categories (e.g. ‘problem identification and the design of the solution with … creativity and innovation’), a count was assigned to each category. Two authors performed the mapping and Cohen’s kappa was used to assess inter-rater reliability. Substantial agreement between the raters (κ = 0.79) was noted. Single-disciplinary units were found to have a greater focus on technical knowledge and application than multidisciplinary units. A Fisher’s exact test indicated a significant association between the type of unit (multi-disciplinary or single-disciplinary) and the assessment types used (p < .001). For both multidisciplinary and single-disciplinary units, key professional learning outcomes were communication, teamwork, as well as professional responsibility and development. In contrast, creativity was a relatively uncommon learning outcome. shows the proportional spread of all learning outcomes for single-disciplinary and multidisciplinary units.
Table 1. Proportion of learning outcomes in technical and professional categories.
On average, 60% of a PjBL unit’s learning outcomes are technical; however, this varies along the length of a degree. First-year units typically have the lowest proportion of technical outcomes (39% on average), which reflect students’ limited disciplinary exposure and the resulting multidisciplinary approach of many first-year units. In contrast, second-year units typically have the highest proportion of technical outcomes (75% on average) and the proportion of technical outcomes decreases in more senior years. The focus on technical learning outcomes in second year may reflect the fact that this is often when fundamental disciplinary content is first introduced to students and there is a need to build strong technical competency at this early stage of the degree.
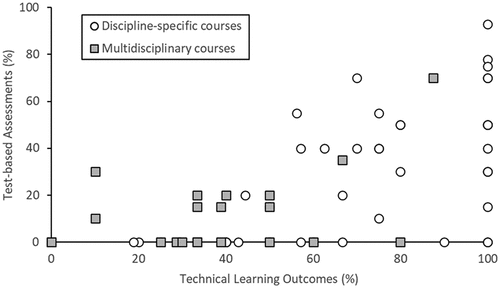
Where there are more technical learning outcomes, there can be a greater component of the assessment through tests (). However, there exist many units where there are technical learning outcomes and yet no test-based assessments (n = 27), demonstrating that it is entirely possible for technical outcomes to be assessed through project work. There are also units that have 100% technical learning outcomes. These are all single-disciplinary units (n = 14) and the lack of professional learning outcomes may indicate that professional skills are not being explicitly taught or assessed in these units.
Figure 7. Technical learning outcomes vs test-based assessments (n = 65).
11. Student feedback
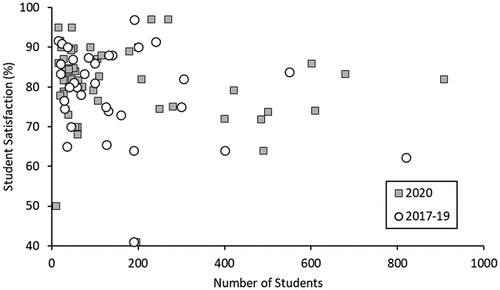
Descriptive statistics for student satisfaction across all units in the sample are: n = 88; M = 80.51; SD = 10.57. Student satisfaction typically lies in the range 2 standard deviations from the mean; however, some units (n = 3) have student satisfaction scores of ≤ 50% (). A paired t-test showed statistical difference between student satisfaction in 2017–19 and 2020 (t(29) = −2.30, p = .029, two-tailed). The effect size was measured by Cohen’s d; a higher mean student satisfaction in 2020 and a small-to-medium effect was noted (d = −0.440). Descriptive statistics for student satisfaction associated with different class sizes in 2017–19 are:
Figure 8. Student satisfaction against class size (n = 34 for 2017–19; n = 55 for 2020).
Small: n = 2; M = 87.5; SD = 4.16
Medium: n = 15; M = 82.12; SD = 5.68
Large: n = 16; M = 75.85; SD = 13.89
and in 2020 are:
Small: n = 4; M = 81.50; SD = 18.55
Medium: n = 34; M = 82.56; SD = 6.29
Large: n = 17; M = 78.32; SD = 12.84
For large classes, student satisfaction is lower than smaller cohorts on average; however, a Kendall’s tau correlation showed no statistically significant correlation between student numbers and satisfaction (n = 34, = −0.138, p = .253 for 2017–19; n = 55,
= −0.162, p = .086 for 2020). An independent samples t-test also showed that there was no statistical difference between core and elective units in terms of student satisfaction (t(28) = 0.80, p = .428 for 2017–19 and t(28) = −0.28, p = .777 for 2020). This contrasts with existing findings that student numbers are weakly inversely-related to student satisfaction (Gannaway, Green, and Mertova Citation2018) and that electives perform better in student satisfaction surveys than core units (Neath Citation1996).
Multi-disciplinary courses have lower student satisfaction than single-disciplinary courses on average (). Descriptive statistics for student satisfaction for multi-disciplinary vs single-disciplinary units in 2017–19 are:
Figure 9. Student satisfaction for multi-disciplinary and single-disciplinary units (n = 21 for single-disciplinary 2017–19; n = 11 for multi-disciplinary 2017–19; n = 35 for single-disciplinary 2020; n = 20 for multi-disciplinary 2020).
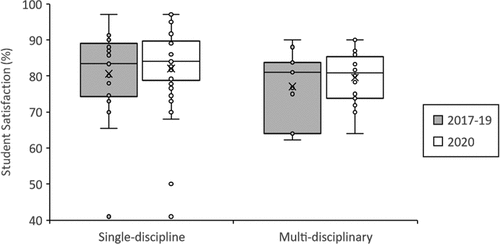
Multi-disciplinary (2017-19): n = 12; M = 77.31; SD = 8.96
Single-disciplinary (2017-19): n = 21; M = 80.60; SD = 11.96
and in 2020 are:
Multi-disciplinary (2020): n = 20; M = 79.60; SD = 6.96
Single-disciplinary (2020): n = 35; M = 82.07; SD = 11.56
As shown in , multi-disciplinary units tend to have a greater focus on non-technical competencies. Research has noted that students that choose to study engineering degrees often have a mindset prepared to take on the challenges of technical skills development but are less interested in professional skills development (Hatakka Citation2016). As a result, there can often be resistance to the complexity of project work (Goldfinch et al. Citation2019; Willey and Machet Citation2018) from students who are more accustomed to being posed problems with a single correct solution. More work needs to be done to better communicate to future engineering students the important role that PjBL plays in developing industry-ready graduates. However, Mann-Whitney U tests indicate no statistically significant difference between multi-disciplinary and single-disciplinary units (U = 95.5, p = 0.261 for 2017–19; U = 262.0, p = 0.125 for 2020).
Other student-facing variables, such as coordinator workload per student, casual workload per student and project percentage, were also considered and no statistically significant relationships were noted. The lack of statistical significance in these and the above student feedback analyses, as well as inconsistent findings in the existing literature (Gannaway, Green, and Mertova Citation2018), highlight the difficulties in untangling cause and effect in relation to student feedback. These variables are not necessarily effective predictors of student satisfaction in isolation, which suggests that models that account for the complex relationships associated with student feedback will need to be considered in future. More data on student satisfaction, in terms of both more PjBL units and other local variables (e.g. institutional norms), is also needed to draw stronger conclusions about student satisfaction with PjBL units.
12. Conclusions
The findings of this study present a useful snapshot of contemporary norms in PjBL within the Australian & New Zealand context. It is recognised that this study has captured a limited sample of units, however the study represents the most comprehensive and current assessment of its type. Also, while the sample is not representative of all Australian & New Zealand PjBL engineering units and institutions, these findings align with existing literature reporting on single-institution studies of PjBL (e.g. Brown Citation2020; Tse and Bona Citation2019). We have identified four key challenges that warrant both further investigation as to their applicability across the sector and active consideration by those delivering PjBL or in Learning and Teaching leadership positions with responsibility for resourcing PjBL units:
Understanding different purposes of PjBL: This sample demonstrates the range of learning focus PjBL currently supports, from multi-disciplinary to single-disciplinary. Assessment types and structure reflect different scaffolding requirements throughout the degree, as well as different foci of multi-disciplinary and single-disciplinary units. The sample also confirms existing findings that interdisciplinary units are relatively rare and highlights the need to explore mechanisms to improve uptake of such units if L&T leadership are keen to better prepare future graduates for interdisciplinary work.
Implications for workload & staff retention: Junior staff (who are often least equipped to seeking appropriate resourcing) tend to have significantly larger classes, which is associated with higher workloads. Although the data shows a benchmark for what is typical of staff resourcing in PjBL units, this may not be indicative of the appropriate level of resourcing to ensure retention of staff in these units, or the ability to attract senior staff to run them. L&T leadership should identify suitable resourcing in line with their institutional ecosystem. Nevertheless, junior academics can use this data to identify if they are significantly below benchmark levels of resourcing and, if so, use this data as evidence in advocating for themselves. L&T leadership can also use this data to review and identify gaps in resourcing for junior academics. Moreover, some coordinators reported > 1FTE workloads and shared/team teaching should be considered to reduce such workloads to acceptable levels. Given that the average coordinator has a 0.4FTE workload, this provides evidence for coordinators with higher workloads to seek more reasonable workloads. Whilst we recognise that reducing workloads may have the unintended consequence of leading to additional other work, the onus is on L&T leadership to ensure workloads are reasonable so as to retain staff in these roles.
Supporting authentic experiences: There is currently a lack of industry collaborations or industry-experienced staff involved in delivering PjBL units. While this may not necessarily mean that learning experiences are inauthentic, there is a risk that delivery of PjBL is disconnected from practice. Current approaches to addressing this draw on industry partners but often not in remunerated roles. It also needs to be recognised that there are time costs for coordinators in generating and maintaining industry relationships. Again, there is an onus on L&T leadership to better support coordinators in developing and delivering authentic learning experiences.
Managing expectations of student satisfaction: Student satisfaction can be relatively low for PjBL, particularly for multi-disciplinary units. Students are often far more appreciative of such units with hindsight, which is not reflected in student satisfaction scores. Coordinators can use these benchmarks to interpret their student satisfaction results and highlight the difficulties for coordinators of multi-disciplinary units and large classes (where coordinator presence can be quite low) to meet university metrics. T&L leadership should consider the external benchmarks presented here when interpreting student satisfaction survey results for PjBL units.
Overall, the findings of this study echo those of much earlier work in PjBL in the need to support and resource this mode of teaching on its own merits, rather than in a manner on par with more traditional modes of delivery. Future work should continue to monitor the evolving landscape of PjBL, particularly with the shift to post-pandemic teaching (whether a return to pre-pandemic modes or a new normal that is influenced by pandemic conditions) as well as wider developments that occur in light of this study’s findings and recommendations.
Acknowledgments
We would like to acknowledge the support of CQU, Curtin University, Griffith University, Macquarie University, Massey University, RMIT University, University of Melbourne, University of Newcastle, University of South Australia, University of Sydney, University of Tasmania, University of Western Australia, UNSW, UTS and Western Sydney University in providing course data for our study. We are also grateful to the industry collaborators and course coordinators who kindly gave their time to discuss their experiences of project-based learning. We are also grateful to the UTS eResearch Group and Intersect Australia for their advice on the statistical analyses, as well as the anonymous reviewers of our manuscript whose comments have been of great help in improving our manuscript. This work was supported by the Australian Council of Engineering Deans (ACED) and the Australasian Association for Engineering Education (AAEE).
Disclosure statement
No potential conflict of interest was reported by the author(s).
Additional information
Notes on contributors
Guien Miao
Guien Miao holds a PhD in Civil Engineering from the University of Sydney. Her research interests are in a range of areas within soil mechanics and engineering education.
Iresha Ranaraja
Iresha Ranaraja is a sessional academic at RMIT University, Melbourne. She works as a trainer for the library, where she conducts NVivo training for higher degree by research students. Her other teaching commitments lie in the areas of sustainable development for STEM and engineering design. She completed her PhD at the same university in 2023, which explored employability learning of engineering students. Iresha’s research interests include learning and teaching for employability, and diversity and inclusion.
Sarah Grundy
Dr. Sarah Grundy is an Education Focused (EF) Senior Lecturer, SFHEA. Sarah teaches predominated design courses in chemical engineering from first year to final year as well as leads work integrated learning initiatives at the Faculty level. Her expertise is in industry-linked engineering education and research and integrates authentic learning practices (team-based learning, TBL and project-based learning, PBL) into courses.
Nick Brown
Nick Brown is passionate about equipping and empowering engineers to address complex global issues such as poverty, inequality, and sustainability. Nick co-leads RMIT University’s (Australia) Humanitarian Engineering Lab which delivers innovative teaching and research at the intersection of design, technology, and education for social change. Nick has been recognised for his teaching through multiple industry and national teaching awards. Nick studied at the University of Edinburgh (UK) for both his masters and doctorate degrees in civil and environmental engineering.
Marina Belkina
Dr. Marina Belkina is a First Year Experience Coordinator teaching engineering at the Western Sydney University, the College. With over twenty years of research and industry work in materials, environmental engineering, and nanotechnology, Marina transformed into a teaching-focused role and discovered her true passion lies in education, with a proven track record of significantly enhancing student performance and satisfaction. She blends innovative experiments with emerging technologies, constantly exploring new methods and practices to improve the learning experience. Marina actively participates in cross-faculty and cross-institutional research groups, focusing on project-based learning, generative AI in engineering education, curriculum design, and strategies to boost student progression and retention. Specialising in developing student-centered educational programs, she addresses the unique needs of non-traditional engineering students, including first-generation university attendees, migrants, women, indigenous students, and those navigating alternative pathways into tertiary education. Marina’s dedication to education earned her 2023 Western Sydney Women in STEM Award, the Teacher of the Year Award in 2019, and recognition from the Australian Association for Engineering Education in 2023 and 2018. She was also a Fellow at the University of East London in 2016. Marina’s research has been supported by various grants and research publications, book chapter, and two patents in the engineering field. Additionally, she manages a popular Engineering Education YouTube channel with over 3 million views.
Tom Goldfinch
Associate Professor Tom Goldfinch is currently Associate Dean (Teaching and Learning) in the Faculty of Engineering at the University of Sydney. He has published over 50 peer reviewed papers in engineering education in topics ranging from qualitative studies of the social and cultural aspects of engineering education and practice to student learning in engineering mechanics. Tom has a particular passion for building recognition of Australian Indigenous perspectives and knowledge in engineering practice through authentic project based learning. He has served as president of the Australasian Association for Engineering Education from 2016 to 2018, as an associate editor for the Journal of Engineering Education, and on multiple engineering education conference technical committees internationally.
References
- Atman, C. J., M. E. Cardella, J. Turns, and R. Adams. 2005. “Comparing Freshman and Senior Engineering Design Processes: An In-Depth Follow-Up Study.” Design Studies 26 (4): 325–357. https://doi.org/10.1016/j.destud.2004.09.005.
- Blackmore, K., C. Browne, and J. Smith. 2019. “Project-Based Application Streams to Support Student Motivations and External Engagement.” Proceedings of the 30th Annual Conference of the Australasian Association for Engineering Education (AAEE 2019), Brisbane, Queensland, 17–25. Engineers Australia.
- Blumenfeld, P. C., E. Soloway, R. W. Marx, J. S. Krajcik, M. Guzdial, and A. Palincsar. 1991. “Motivating Project-Based Learning: Sustaining the Doing, Supporting the Learning.” Educational Psychologist 26 (3–4): 369–398. https://doi.org/10.1080/00461520.1991.9653139.
- Boud, D. 1995. Assessment for Learning in Higher Education. Edited by P. Knight, 35–48. London: Kogan Page.
- Brown, N. 2020. “Practical Solutions to Manage Staff and Student Workloads in Project-Based Learning Courses.” Global Journal of Engineering Education 22 (1): 20–25.
- Chattopadhyay, G., and J. Larkins. 2020. “Capability Building Through Workplace Based Learning in Maintenance and Reliability Engineering (MRE) Postgraduate Programmes.” Proceedings of the 31st Annual Conference of the Australasian Association for Engineering Education (AAEE 2020), Sydney, NSW, 145–152. Engineers Australia.
- Crosthwaite, C. 2021. Engineering Futures 2035 Engineering Education Programs, Priorities & Pedagogies. Australian Council of Engineering Deans (ACED).
- de Graaf, E., and A. Kolmos. 2003. “Characteristics of Problem-Based Learning.” International Journal of Engineering Education 19 (5): 657–662.
- Dobele, A. R., S. Rundle-Thiele, and F. Kopanidis. 2014. “The Cracked Glass Ceiling: Equal Work but Unequal Status.” Higher Education Research & Development 33 (3): 456–468. https://doi.org/10.1080/07294360.2013.841654.
- Engineering New Zealand. 2020. Requirements for Accreditation of Engineering Education Programmes (ACC 02).
- Felipe, A., T. Pham, E. Amouroux, and M. Nguyen. 2017. “Interdisciplinary Collaborative Teaching in Project-Based Learning Approach.” Proceedings of the 28th Annual Conference of the Australasian Association for Engineering Education (AAEE 2017), Sydney, NSW, 54–61. Macquarie University.
- Frank, M., I. Lavy, and D. Elata. 2003. “Implementing the Project-Based Learning Approach in an Academic Engineering Course.” International Journal of Technology and Design Education 13 (3): 273–288. https://doi.org/10.1023/A:1026192113732.
- Fugate, J. R. 2018. “Assessment for Project-Based Courses.” Journal of Problem Based Learning in Higher Education 6 (12): 153–161. https://doi.org/10.5278/ojs.jpblhe.v0i0.1864.
- Gannaway, D., T. Green, and P. Mertova. 2018. “So How Big Is Big? Investigating the Impact of Class Size on Ratings in Student Evaluation.” Assessment & Evaluation in Higher Education 43 (2): 175–184. https://doi.org/10.1080/02602938.2017.1317327.
- Goldberg, J. R., V. Cariapa, G. Corliss, and K. Kaiser. 2014. “Benefits of Industry Involvement in Multidisciplinary Capstone Design Courses.” International Journal of Engineering Education 30 (1): 6–13.
- Goldfinch, T., J. Vulic, E. Leigh, and K. Willey. 2019. “Student Perceptions of Complexity in Engineering Education.” Proceedings of the 47th SEFI - Annual Conference of European Society for Engineering Education (2019), Budapest. SEFI.
- Graham, R., and E. Crawley. 2010. “Making Projects Work: A Review of Transferable Best Practice Approaches to Engineering Project-Based Learning in the UK.” Engineering Education 5 (2): 41–49. https://doi.org/10.11120/ened.2010.05020041.
- Hadgraft, R. G., and A. Kolmos. 2020. “Emerging Learning Environments in Engineering Education.” Australasian Journal of Engineering Education 25 (1): 3–16. https://doi.org/10.1080/22054952.2020.1713522.
- Hall, W., S. Palmer, and M. Bennett. 2012. “A Longitudinal Evaluation of a Project-Based Learning Initiative in an Engineering Undergraduate Programme.” European Journal of Engineering Education 37 (2): 155–165. https://doi.org/10.1080/03043797.2012.674489.
- Harris, T., and A. Bigham. 2014. “The Use of Project Based Learning in Engineering Fundamentals.” Proceedings of the 25th Annual Conference of the Australasian Association for Engineering Education (AAEE 2014), Wellington, New Zealand, 697–704. Massey University.
- Hatakka, M. 2016. “Assisting Engineering Students in Acquiring Academic Literacy Skills.” Literacy Information and Computer Education Journal 7 (1): 2215–2221. https://doi.org/10.20533/licej.2040.2589.2016.0293.
- Herrington, T., and J. Herrington. 2006. Authentic Learning Environments in Higher Education. Hershey: Information Science Publishing.
- Hogan, K. D. 2012. “Uncanned Learning Through an Industry Based Final Year Project: Food for Thought.” Proceedings of the 23rd Annual Conference of the Australasian Association for Engineering Education (AAEE 2012), Melbourne, Victoria, 1121–1129. Engineers Australia.
- Inchbold-Busby, S., and R. Goldsmith. 2017, January. “Developing Three-Dimensional Engineers Through Project-Based Learning.” 28th Annual Conference of the Australasian Association for Engineering Education (AAEE 2017), 303–311. Sydney, NSW: Macquarie University.
- Kavanagh, L., and J. Cokley. 2011. “A Learning Collaboration Between Engineering and Journalism Undergraduate Students Prompts Interdisciplinary Behavior.” Advances in Engineering Education 2 (3): 1–22.
- Kavanagh, L., L. O’Moore, and L. Jolly. 2012. “Mad As Hell and Not Taking it Any More?: Job Satisfaction Amongst Engineering Educators in Australian Universities.” Proceedings of the 23rd Annual Conference of the Australasian Association for Engineering Education (AAEE 2012), Melbourne, Victoria, 600–608. Engineers Australia.
- Lawrence, R. 2020. Engineering 2035 Report - the Promotion of Future Opportunities and Possibilities for Engineering Graduates. Australian Council of Engineering Deans (ACED).
- Li, H., and S. Howell. 2019, January. “Engaging Engineering Students Through Project-Based Learning and Industrial Site Visits in a Mechanical Design Course.” 30th Annual Conference for the Australasian Association for Engineering Education (AAEE 2019), 596–602. Brisbane, Queensland: Engineers Australia.
- Lynch, E., J. Smith, K. Blackmore, S. Beavis, and L. Schneider. 2019, January. “A Chemist, Engineer and Environmental Scientist Walk into a Classroom … Outcomes from an Interdisciplinary Project-Based Course.” Proceedings of the 30th Annual Conference for the Australasian Association for Engineering Education (AAEE 2019), Brisbane, Queensland, 610–617. Engineers Australia.
- McKenzie, L. J., M. S. Trevisan, D. C. Davis, and S. W. Beyerlein. 2004, June. “Capstone Design Courses and Assessment: A National Study.” Proceedings of the 2004 American Society of Engineering Education Annual Conference & Exposition, Salt Lake City, Utah, 1–18.
- Mills, J. E., and D. F. Treagust. 2003. “Engineering Education—Is Problem-Based or Project-Based Learning the Answer.” Australasian Journal of Engineering Education 3 (2): 2–16.
- Morgan, A. 1983. “Theoretical Aspects of Project-Based Learning in Higher Education.” British Journal of Educational Technology 14 (1): 66–78. https://doi.org/10.1111/j.1467-8535.1983.tb00450.x.
- Neath, I. 1996. “How to Improve Your Teaching Evaluations without Improving Your Teaching.” Psychological Reports 78 (3_suppl): 1363–1372. https://doi.org/10.2466/pr0.1996.78.3c.1363.
- Prpic, J., and R. Hadgraft. 2011. “Interdisciplinarity As a Path to Inclusivity in the Engineering Classroom: A Design-Based Research Approach.” Proceedings of the 22nd Annual Conference for the Australasian Association for Engineering Education (AAEE 2011), Freemantle, Western Australia, 154–159. Engineers Australia
- Reilly, S. 1985. “Gender Divisions in the Academic Workplace.” Compare: A Journal of Comparative and International Education 15 (1): 41–51. https://doi.org/10.1080/0305792850150105.
- Schaller, C., and R. Hadgraft. 2013. “Developing Student Teamwork and Communication Skills Using Multi-Course Project-Based Learning.” Proceedings of the 24th Annual Conference of the Australasian Association for Engineering Education (AAEE 2013), Gold Coast, Queensland, 1–8. Griffith University.
- Scott, G., and K. W. Yates. 2002. “Using Successful Graduates to Improve the Quality of Undergraduate Engineering Programmes.” European Journal of Engineering Education 27 (4): 363. https://doi.org/10.1080/03043790210166666.
- Ståhl, D., K. Sandahl, and L. Buffoni. 2022. “An Eco-System Approach to Project-Based Learning in Software Engineering Education.” IEEE Transactions on Education 65 (4): 514–523. https://doi.org/10.1109/TE.2021.3137344.
- Stappenbelt, B., and C. Rowles. 2009. “Project Based Learning in the First Year Engineering Curriculum.” Proceedings of the 20th Annual Conference for the Australasian Association for Engineering Education (AAEE 2009), Adelaide, South Australia, 411–416. University of Adelaide.
- Trevelyan, J. 2019. “Transitioning to Engineering Practice.” European Journal of Engineering Education 44 (6): 6, 821–837. https://doi.org/10.1080/03043797.2019.1681631.
- Tse, N., and R. Bona. 2019. “Large Scale Vertically Integrated PBL.” Proceedings of the 30th Annual Conference for the Australasian Association for Engineering Education (AAEE 2019), Brisbane, Queensland, 618–625. Engineers Australia.
- Wildermoth, B., and D. Rowlands. 2012. “Project Based Learning in Embedded Systems: A Case Study.” Proceedings of the 23rd Annual Conference of the Australasian Association for Engineering Education (AAEE 2012), Melbourne, Victoria, 227–237. Engineers Australia
- Willey, K., and T. Machet. 2018. “Complexity Makes Me Feel Incompetent and it’s Your Fault.” Proceedings of the 29th Annual Conference of the Australasian Association for Engineering Education (AAEE 2018), Hamilton, New Zealand, 691–697. Engineers Australia.
- Zhuge, Y., and J. Mills. 2009. “Teaching Finite Element Modelling at the Undergraduate Level: A PBL Approach.” Proceedings of the 20th Annual Conference for the Australasian Association of Engineering Education (AAEE 2009), Adelaide, South Australia, 105–110. Engineers Australia.