
ABSTRACT
p-Aminosalicylic acid (PAS) is an important second-line antibiotic for treating multidrug-resistant tuberculosis (MDR-TB). Due to gastrointestinal disturbance and intolerance, its potent and efficacy in the treatment of extensively drug-resistant (XDR)-TB commonly are poor. Thus, it is important to reveal the mechanism of susceptibility and resistance of Mycobacterium tuberculosis (Mtb) to this drug. Herein, we screened and established PAS-resistant (PASr) folC mutated and un-mutated Mtb strains, then utilized a multi-omics (genome, proteome, and metabolome) analysis to better characterize the mechanisms of PAS resistance in Mtb. Interestingly, we found that promotion of SAM-dependent methyltransferases and suppression of PAS uptake via inhibiting some drug transport associated membrane proteins were two key pathways for the folC mutated strain evolving into the PASr Mtb strain. However, the folC un-mutated strain was resistant to PAS via uptake of exogenous methionine, mitigating the role of inhibitors, and promoting DfrA, ThyA and FolC expression. Beyond these findings, we also found PAS resistance in Mtb might be associated with the increasing phenylalanine metabolism pathway. Collectively, our findings uncovered the differences of resistant mechanism between folC mutated and un-mutated Mtb strains resistant to PAS using multi-omics analysis and targeting modulators to these pathways may be effective for treatment of PASr Mtb strains.
Introduction
Tuberculosis (TB), caused by the organism Mycobacterium tuberculosis (Mtb), is a bacterial disease, infecting approximately one-third of the world’s population [Citation1]. Currently, a standard TB treatment includes a prolonged course of antibiotics lasting from 6 months to 2 years [Citation2], that often results in the development of resistance to one or more antibiotics. Antibiotic-resistant Mtb is a major threat to public health. Clearly, greater efforts are required to improve our understanding of this disease and strengthen overall TB control, in order to curb this problem.
Since 1946, para-Aminosalicylic acid (PAS) has been used as a second-line drug for killing Mtb [Citation3]. Shortly before the clinical introduction of PAS, streptomycin as a monotherapeutic drug significantly improved the survival rate of tuberculosis [Citation3]. However, the rapid emergence of streptomycin-resistant Mtb strains posed a threat to this monotherapy strategy for TB infection [Citation3,Citation4]. As PAS is effective against streptomycin-resistant Mtb strains, PAS-based drug resistance combination therapy regimens including streptomycin-PAS-isoniazid treatment regimens, have been widely used [Citation4]. Recently, the World Health Organization drug-resistant tuberculosis (DR-TB) 2016 guidelines reclassified PAS as Group D3 “add-on” drug, while Desai et al., in view of the safety and efficacy of PAS in 250 cases DR-TB patients except for XDR and Category V group, it is recommended to reclassify PAS into Group C rather than Group D3 [Citation5].
Indeed, PAS has been found to dramatically improve cure rates and further reduce the emergence of drug resistance [Citation3,Citation4]. However, PAS is often associated with a high rate of gastrointestinal disturbance which limits its use to the treatment of multi-drug resistant TB [Citation4,Citation6]. Thus, it is important to develop novel strategies to enhance PAS potency, limit adverse reactions and improve treatment success rates. Until recently, the molecular and biochemical mechanisms governing the susceptibility and resistance of Mtb to PAS have not been clearly defined.
It is known that PAS is a selective antimetabolite of the Mtb folate metabolic pathway acting as a structural analog of para-aminobenzoic acid (PABA), which is produced from chorismate by the concerted action of aminodeoxychorismate synthase (PabAB) and aminodeoxychorismate lyase (PabC) [Citation7,Citation8]. PAS is sequentially converted to 2′-hydroxy-7,8-dihydropteroate and 2′-hydroxy-7,8-dihydrofolate by enzymes in the Mtb folate metabolic pathway to potently inhibit Mtb dihydrofolate reductase (DHFR) [Citation4,Citation9–12]. A study using transposon mutagenesis identified loss-of-function mutations in thyA, encoding a folate-dependent thymidylate synthase, associated with resistance to PAS that were also present in clinical isolates resistant to PAS [Citation13]. In addition, various missense mutations in folC encoding dihydrofolate synthase and over-expression of RibD can confer Mtb resistance to PAS [Citation12,Citation14], while, deleting pabC caused increased susceptibility of Mtb to PAS [Citation15].
Another study showed that PAS can be converted to N, N-dimethyl PAS species without anti-tubercular activity in Mtb cells [Citation8]. Since the addition of methionine can potentially enhance the ability of Mtb to methylate PAS by increasing S-adenosylmethionine (SAM) abundance, it is possible that methionine promotes inactivation of PAS through N,N-dimethylation by an unidentified methyltransferase. However, Howe et al. have demonstrated that methionine-mediated antagonism of anti-folate drugs occurs through the sustained production of folate precursors [Citation16]. In addition, they found that intracellular biotin confers intrinsic PAS resistance in a methionine-independent manner [Citation16].
Therefore, new approaches are required to better characterize the mechanisms relating to drug resistance [Citation17,Citation18]. With all this in mind, we used a multi-omics approach, integrating genomic, comparative proteomic and metabolomics to predict new PAS resistance mechanisms in two well-described laboratory PAS-resistant Mtb strains (folC mutated PASr1 Mtb strains, folC un-mutated PASr2 Mtb strains). As a result, our findings reveal that these two PAS-resistant Mtb strains have different resistance mechanisms. folC mutated strains evolved to PAS resistance via two pathways: (1) reducing bioactivation of PAS by increasing the abundance of SAM-dependent methyltranferases and folC mutation; (2) reducing the PAS uptake via decreasing expression of membrane proteins, especially ABC transporters. Moreover, we also found an increasing phenylalanine metabolism pathway in the PASr folC mutated Mtb strains. Different from folC mutated strains, the folC unmutated strains were found to harbour PAS resistance via retaining methionine and mitigating the impact of target inhibitor, viz., overexpression of DfrA, ThyA and FolC.
Results
Establishment of folC mutated and un-mutated PASr Mtb strains
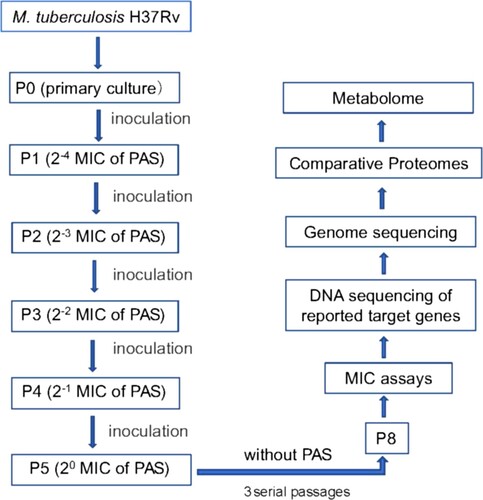
To obtain PASr Mtb strains, wild type H37Rv Mtb strains were treated with PAS according to the route of . Finally, 109 PASr Mtb clones (MIC > 2 μg/ml) were randomly selected for further sequencing to screen mutation of PASr associated genes folC, dfrA, thyA, folP1 and ribD. Results showed 84 of 109 PASr strains (named PASr 1 group) only with mutation of folC gene (448A→C, S150R) after PAS treatment. However, we did not find any mutations on dfrA, thyA, folP1 and ribD gene both on other 25 PASr strains (named PASr 2 group) and the PAS un-treated parental strains (named Control group) (Supplemental Table S1).
Figure 1. Outline of experimental scheme in this study. M. tuberculosis H37Rv strain was cultured on Löwenstein-Jensen (LJ) medium and processed by amplification culture named as passage 0 (P0) strains, which were selected for preparing PAS-resistant strains. Concentration gradients (2−4, 2−3, 2−2, 2−1, 20) of PAS based on the critical concentration (1.0 mg/L PAS) contained LJ medium were prepared, and P0 strains (1 MCF) were cultured in LJ medium (2−4 PAS concentration) for approximately 4 weeks named as passage 1 (P1). Repeat this step till passage 4 (P5) strains, which met to the WHO criteria for PAS-resistant strains, and then the resistant strains were verified by the appropriate concentrations of drug used in the drug-susceptibility test. The resistant strains were continuously cultured to passage 8 (P8) without PAS, and then analysed by the drug-susceptibility test. 218 single colonies were randomly selected and cultured in liquid culture for the extraction of genomic DNA and testing PAS MICs of Mtb strains. Then single colonies were assessed by targeted sequencing of PCR amplicons of genes associated with PAS resistance. The primers used in the targeted sequencing are described in Supplemental Table S8. Two strains, one folC mutant and one non-folC mutant are identified and subjected to full genome resequencing, proteomic and metabolomic analysis.
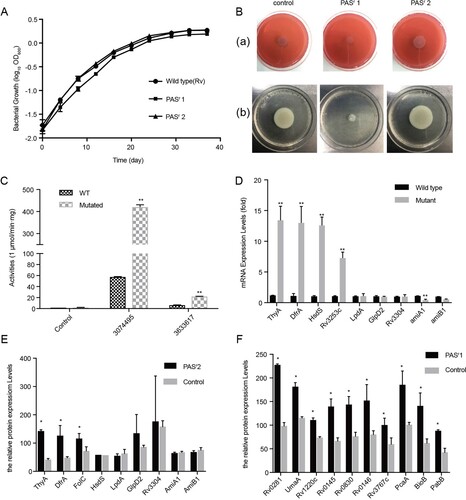
In order to verify whether the mutation was stable, we cultured the PASr Mtb strains for continuous three passages without PAS stimulation and found that the folC mutation and resistance level to PAS were not changed (data not shown), indicating that the PASr Mtb strains have been successfully induced and established. Obviously, we also found the folC mutated and un-mutated PASr Mtb strains had different prevalence and growth characteristics, especially in 79.2% (84/109) PASr1 strains (folC mutated) comparatively having the largest reduction in growth with higher resistance to PAS (>256 μg/ml) compared with the PASr 2 strains (folC un-mutated, 4 μg/ml) ((A,B)), indicating these PASr strains may have different drug-resistant mechanisms. In addition, these two strains were not cross-resistant to other anti-TB drugs except PAS (Supplemental Table S2). Therefore, we have successfully established stable folC mutated and un-mutated PASr Mtb strains.
Figure 2. Characterization of PAS-resistant Mtb used in this study. (A) Growth of M. tuberculosis H37Rv, PASr 1 and PASr 2 strains in 7H9 + ADC liquid media for 37 days. The average of two biological replicates is shown. (B) Phenotypic analysis of M. tuberculosis strains. Wild-type strain (control) was compared to folC mutated PASr strains (PASr1) and folC unmutated PASr strains (PASr2) for the following phenotypes: (a) Colony morphology, (b) Sliding motility. (C) IGR SNPs alter the expression level of downstream genes. Two IGRs on the expression of lacZ in M. smegmatis were examined by performing β-D-galactosidase activity assays on IGR-lacZ constructs. The IGR sequences, with or without the SNPs (3074495 G→A, located in between thyA and Rv2765 and 3633617 C→T, located in between Rv3253c and Rv3254) identified in this study, were inserted into the pSD5B mycobacterial shutter vector that contains a promoterless lacZ reporter gene immediately downstream of the cloning site and β-D-galactosidase activity was assayed. Error bars represent the s.d. calculated from three separate measurements. (D) Semi-quantitative RT-PCR was used to examine the expression of the IGR downstream genes. thyA, drfA and hsdS are located in the downstream of 3074495 SNP, Rv3253c is located in in the downstream of 3633617 SNP and lpdA, glpD2, Rv3304, amiA1, amiB1 are located in the downstream of VNTR 3690 locus. Data were analysed using the ΔΔCT method with the M. tuberculosis reference gene sigA as the control. Data were mean values ± SD from independent biological samples. ** represents P value < 0.01. (E) iTRAQ was used to examine the expression of the IGR downstream genes in PASr2 Mtb. * represents P value < 0.05. (F) SAM-dependent methyltransferases (AdoMet-MT) and some folic acid synthesis-related proteins with significant differences were identified by iTRAQ in PASr1 Mtb compared to the parental strain. * represents P value < 0.05.
Whole-genome sequence of folC mutated and un-mutated PASr Mtb strains
To reveal the difference mechanism of PAS resistance among folC mutated PASr1 Mtb strains, folC un-mutated PASr2 Mtb strains and PAS un-treated parental control strains, whole genome sequencing was performed. Results showed that apart from folC mutant, there was only a non-synonymous in esxK (140G→A) of PASr1 strains (Supplemental Table S3). Notably, a number of mutations including two intergenic regions (IGR) single nucleotide polymorphisms (SNPs) (3074495 G→A, located in between thyA and Rv2765 and 3633617 C→T, located in between Rv3253c and Rv3254) and an insertion mutation of variable number of tandem repeat (VNTR) 3690 locus can be found in PASr2 strain (Supplemental Table S3).
Previous study has been reported that IGR SNPs may affect the expression levels of flanking genes [Citation19]. To verify the impacts of these IGR SNPs, we designed promoterless lacZ gene fusion constructs containing the intergenic sequence between thyA and Rv2765, and between Rv3253c and Rv3254, and introduced them into M. smegmatis, a saprophyte extensively employed as a surrogate model for Mtb [Citation20], and analysed lacZ gene activity. Our results revealed that the Mycobacterium smegmatis strains with IGR SNP in thyA–Rv2765 (3074495 G→A) and Rv3253c–Rv3254 (3633617 C→T) showed 7.3-fold and 3.4-fold higher β-galactosidase activity than IGR un-mutated control M. smegmatis strains, respectively (P < 0.05) ((C)). When a negative control construct (promoterless lacZ gene) was introduced, no β-galactosidase activity was detected. Additionally, Parvez et al., previously reported that the copy number of VNTR 3690, located in the intergenic region between Rv3304 and Rv3303c (encoding gplD2 and lpdA genes, respectively), had an effect on the transcription of lpdA [Citation21]. These results strongly suggest that the SNPs in these drug resistance–associated IGRs would lead to regulation of the downstream genes in Mtb strains. We verified expression of several downstream genes of the above two SNP sites in PASr 2 strains by qRT-PCR analysis. Among these genes, thyA, drfA, hsdS and Rv3253c in the PASr 2 strain were significantly increased compared to the parental strain, respectively (P < 0.01) ((D)).
Global protein expression profiling comparisons of folC mutated and un-mutated PASr Mtb strains
In order to further investigate the changes in protein levels of the strain caused by PAS resistance, we performed global protein expression profiling on the folC mutated and un-mutated PASr Mtb strains and their parental strains. With a highly conservative threshold, in total, 2341 proteins were identified. In PASr1 strains, compared to its parent strains, a total of 361 proteins expression differences were greater than 1.5-fold (P < 0.05), including 290 down-regulated proteins and 71 up-regulated proteins, while in PASr2 strains, 10 down-regulated proteins and 28 up-regulated proteins expression differences were greater than 1.5-fold (Supplementary Table S4). Meanwhile, thyA and dfrA mRNA expression, which proteins were up-regulated, also increase in PASr2 strains, while VNTR 3890 mRNA expression, which proteins were down-regulated, had no significant changes between PASr2 strains and their parental strains ((D,E)). Interestingly, there were no changes of these proteins in folC mutated PASr1 strains, while many S-adenosyl-L-methionine (SAM)-dependent methyltransferases (AdoMet-MT) and two proteins, PabB and BioB, were overexpressed in PASr1 strains ((F)).
Additionally, to further investigate the biological process that mediated by the above differential proteins from PASr1 strains and PASr2 strains, the Gene Ontology (GO) categories were evaluated using DAVID online software (Supplemental Table S4). As a result, in PASr1 strains, 178 down-regulated proteins (61.6%) were associated with plasma membrane, 43 down-regulated proteins (14.8%) related to an integral component of plasma membrane, and 94 down-regulated proteins located on the bacterial cell wall ((A)). Notably, the biological transport process was also significantly enriched ((B)). According to previous reports, Mtb encodes at least 46 putative drug efflux, and in this study, we found 6 efflux pumps (Rv1218c, Rv1458c, Rv1819c, DrrA, DrrB, MmpL3 and PstB) were observably decreased in PASr 1 strains (Supplemental Table S4). These results suggested that the down-regulated membrane proteins may be associated with decreased PAS uptake.
Figure 3. Gene Ontology categories for the differentially expressed proteins in PASr1 strain compared with those in its parent strain using DAVID analysis. (A) Functional classification of the differentially expressed proteins in the cellular component that increased and decreased, respectively. (B) Functional classification of the differentially expressed proteins in the biological processes that increased and decreased, respectively. (C) Functional classification of the differentially expressed proteins in the molecular functions that increased and decreased, respectively.
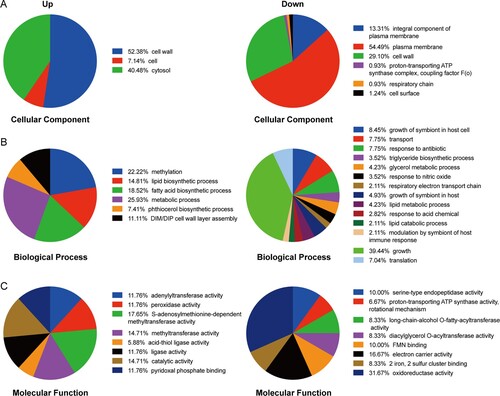
As mentioned above, PASr1 strains grew to a lower yield than the parental control strains ((A)). It is noteworthy that 56 down-regulated proteins associated with the PASr1 strains growth process indicating that these changes may be related to impaired growth ((A)). Additionally, 17.65%, 14.71% and 14.71% of up-regulated proteins mediated S-adenosylmethionine-dependent methyltransferase activity, methyltransferase activity, pyridoxal phosphate binding activity in PASr1 strains, respectively. Meanwhile, 19 of 290, 10 of 290 down-regulated proteins mediated oxidoreductase activity and electron carrier activity, respectively ((C)). Moreover, 5 down-regulated proteins (Rv0221, Tgs1, Tgs2, Rv3087 and Rv2285) involved in long-chain-alcohol O-fatty-acyltransferase activity, and 4 down-regulated proteins (AtpB, AtoF, AtpH and AtpG) involved in proton-transporting ATP synthase activity were enriched, which ultimately led to a decrease in the bacterial energy generation system. ((C)). These results suggest that folC mutation-mediated PAS resistance may be associated with these processes.
Phenylalanine, tryptophan and histidine metabolism pathways were enriched by up-regulated proteins in folC mutated PASr Mtb strains
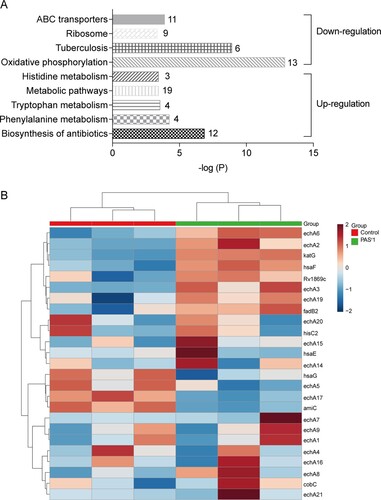
The KEGG pathways analysis using significantly altered proteins in folC mutated PASr 1 Mtb strains showed that ATP-binding cassette (ABC) transporters, ribosome, tuberculosis and oxidative phosphorylation pathways were enriched by down-regulated proteins, while antibiotics, phenylalanine metabolism, tryptophan metabolism and histidine metabolism pathways were enriched by up-regulated proteins ((A,B), Supplemental Table S4). However, there was no pathways were enriched by using 10 down-regulated or 28 up-regulated proteins in folC un-mutated PASr 2 Mtb strains. folC encodes the enzyme responsible for folate polyglutamylation. Several recent studies found that folC mutations mapped within positions corresponding to substrate and nucleoside binding domains result a reduced bioactivation of PAS [Citation10,Citation12,Citation14]. However, the exact mechanism of how folC mutations regulate bioactivation of PAS is unknown. Herein, our results suggest that phenylalanine, tryptophan and histidine metabolism pathways may be involved in the regulation of bioactivation of PAS in folC mutated PASr 1 Mtb strains.
Figure 4. Histogram displaying KEGG pathway of the differentially expressed proteins in PASr 1 strain according to the P value. (A) The upregulated and downregulated pathway were marked. Each related gene numbers is shown on the right of the bars. (B) Heat map showing the average expression level of proteins related to phenylalanine metabolism in in PASr1 Mtb compared to its parental strain.
Phenylalanine metabolism pathways was significantly enriched by up-regulated intracellular metabolites in folC mutated PASr Mtb strains
To investigate the metabolomics level in the folC mutated and un-mutated PASr Mtb strains, the intracellular and extracellular metabolites were evaluated by liquid chromatography coupled with tandem mass spectrometry (LC–MS) and analysed by multi- and univariate analyses [Citation22]. Results showed that the total variance of metabolomes data in folC mutated and un-mutated PASr Mtb strains with their corresponding parental control strains was 63.8% (folC mutated PASr1 Mtb strains) and 47.1% (folC un-mutated PASr2 Mtb strains) by principal component analysis (PCA), respectively ((A,B)). Two-dimensional (2D)-PCA score plot revealed that both PASr1 (42.7% of the variance) and PASr2 (28.8% of the variance) Mtb strains can be distinguished from their corresponding parental strains based on the first principal components. Subsequently, partial least squares-discriminant analysis (PLS-DA) was used to maximize the separation and identify additional metabolites ((C,D)). Then, potential metabolites were selected based on the VIP score (>1) after univariate analysis (Supplemental Table S5). First, we observed that antifolate-generated thymine starvation occurred in folC mutated PASr1 Mtb strains with a 2-fold decrease of thymidine-5’-triphosphate (TTP), and in folC un-mutated PASr2 Mtb strains with reduction of thymine ((A,B), Supplemental Table S5), which is consistent with previous reports about PAS-resistant Mtb [Citation4]. Notably, only phenylalanine metabolism pathway was significantly enriched by up-regulated intracellular metabolites (Supplemental Table S5), which is consistent with the enriched results by up-regulated proteins such as HsaF, KatG, EchA3 and EchA6, in folC mutated PASr1 Mtb strains ((B), Supplemental Table S4). In addition, S-Adenosyl-L-homocysteine (SAH), a by-product of SAM-dependent methyltransferase reactions and biotin were also significantly increased in folC mutated PASr1 Mtb strains ((A)). Moreover, glycerophospholipid, purine and inositol phosphate metabolism pathways were significantly enriched by down-regulated intracellular metabolites (Supplementary Table S5).
Figure 5. PCA score plot and PLS-DA score plot generated using MetaboAnalyst based on intracellular and extracelluar metabolites of PASr strains in positive mode compared with their parent strain, respectively. (A–D) Intracelluar metabolites, (E–H) Extracelluar metabolites. (A, B, E, F) A two-dimensional PCA score plot indicating the natural grouping and differentiation of the individual samples into samples into the PASr strains and the control strain, due to variation in their metabolic profiles. (C, D, G, H) Two-dimensional PLS-DA score plot. Predictive component 1 and component 2 can differentiate the PASr strains and the control strain.
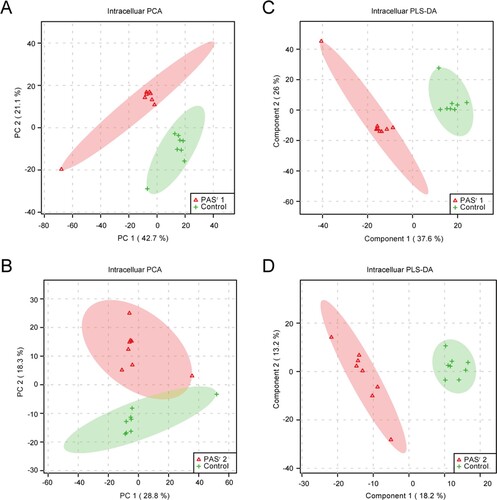
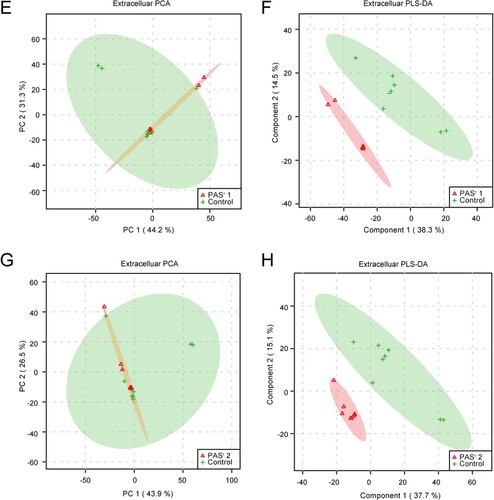
Figure 6. The significantly alterated metabolites related to phenylalanine metabolism pathways were observed in intracellular and extracelluar metabolites of PASr Mtb strains. (A) The intracellular metabolites in PASr 1 Mtb strain. (B) The intracellular metabolites in PASr 2 Mtb strain. (C) The extracellular metabolites in PASr 1 Mtb strain. (D) A schematic summary of the metabolic and proteomic changes involved in phenylalanine metabolism in PASr Mtb strains. The purple characters represent the different metabolites found in the PASr Mtb strain. The red arrows indicate significantly increased proteins, while the green arrows indicate significantly decreased proteins in PASr 1 Mtb strain compared to its parental strain.
Furthermore, we assessed the extracellular metabolites using culture supernatant of folC mutated and un-mutated PASr Mtb strains with their corresponding parental control strains after PCA and PLS-DA analysis ((E,F)). Finally, 79 and 106 putative metabolites were identified in folC mutated PASr 1 Mtb strains and un-mutated PASr 2 Mtb strains, respectively (Supplementary Table S6). Consistent with change of intracellular metabolites, thymidine was decreased both on culture supernatant of PASr1 and PASr2 Mtb strains (Supplemental Table S7). Notably, methionine, which can antagonize PAS activity via affecting folate precursor biosynthesis pathway was also significantly decreased on culture supernatant of PASr2 Mtb strains (Supplemental Table S7). KEGG pathways analysis showed that cysteine and methionine metabolism, biosynthesis of unsaturated fatty acids and linoleic acid metabolism were significantly enriched by up-regulated extracellular metabolites, while phenylalanine metabolism was significantly enriched by down-regulated extracellular metabolites in folC mutated PASr1 Mtb strains (Supplemental Table S6). In folC un-mutated PASr 2 Mtb strains, aminoacyl-tRNA biosynthesis, metabolic pathways, ABC transporters and phenylalanine metabolism were significantly enriched by down-regulated extracellular metabolites (Supplemental Table S6). Interestingly, no significant changes in the proteins and metabolites associated with phenylalanine metabolism were detected within the PASr2 strain, while the significantly reduced metabolites associated with phenylalanine metabolism were detected outside the cells ((C)). In brief, our proteomic and metabonomic results indicated phenylalanine metabolism might be associated with PASr resistance in Mtb ((D)).
Discussion
In this study, we used the increasing concentrations of PAS in vitro to produce two different PAS-resistant strains (folC mutated and un-mutated) and use an integrated genomic-proteomic-metabonomic approach to compare the differentially expressed proteins and metabolites of PAS-resistant Mtb and their parent strain.
folC is the most direct and predominant target of PAS in Mtb
To detect gene mutations directly caused by PAS, we established a PAS-drug resistance model of Mtb in vitro by a continuous drug concentration gradient induction (, Supplemental Experimental Procedures). Different from the method induced by high concentration drugs [Citation10], this method can better simulate the accumulation of drugs in the body. Interestingly, among the reported PASr associated genes, we only found there was an about 77% mutation rate in folC (Supplemental Table S1). These results suggested that folC mutation was the most predominant domains on PASr Mtb strains, consistent with Zhang et al., findings that 34.8% (72/208) of folC mutation have been found in isolated clinical PASr Mtb strains [Citation14].
It is known that FolC can activate PAS through forming the dihydrofolate (H2Pte-Glu) analog hydroxyl dihydrofolate (H2PtePAS-Glu). Crystal structures show that a four-helix bundle (α1–α2/α4–α5), which the FolC mutation (Ser150Arg) was located in, plays an important role in the interaction with hydroxyl dihydropteroate (H2PtePAS), an analog of H2Pte, indicating that this mutant may affect the efficiency of H2PtePAS glutamination. This mutant was also observed in isolated clinical PASr Mtb strains [Citation14]. Compared to laboratory isolated PASr Mtb strains, there were also several different folC mutations observed in clinical PASr Mtb strains. For example, Zhang et al., has reported that five specific residues (positions 40, 43, 49, 150, and 153) accounted for 94.4% (68/72) of the folC mutant isolated from patients, while no mutations except Ser150 were detected in the spontaneous mutants in this study. Zhao et al., found many laboratory folC mutant isolates using a method induced by high concentration of PAS and the mutation of Ser150 in folC was also included [Citation10]. This discrepancy in mutational stability may be related to different strain backgrounds, as well as their difference in growth in vivo versus in vitro.
folC mutated and un-mutated PASr Mtb strains have different drug-resistant mechanisms
Compared to folC mutated PASr Mtb, the un-mutated Mtb contains more genetic mutations in the genome, including several IGR mutations to regulate the expression of proteins related to PAS-resistance, such as DfrA (, Supplemental Table S3 and Supplemental Table S4). Zheng et al. previously reported that overexpression of dfrA was sufficient to confer resistance to PAS in Mtb [Citation12]. Although there were less genomic changes of folC mutated Mtb, proteomic results showed many AdoMet-MTs, pabB and bioB were overexpressed ( and Supplemental Table S4). AdoMet-MT can convert PAS to an inactive status by N,N-methylation [Citation8]. PabB is an essential enzyme required to convert chorismate to PABA in Mtb [Citation23–25]. BioB is a radical SAM-dependent enzyme required for the final step in the synthesis of biotin and the intracellular biotin confers intrinsic PAS resistance. Metabolomic results further showed S-Adenosyl-L-homocysteine (SAH) and biotin were significantly increased in folC mutated PASr1 Mtb strains ( and Supplemental Table S5). These results suggest that PASr1 strain is more likely to inactivate PAS through N, N-dimethylation by SAM methyltransferases and at the same time, increase the intracellular biotin to confer intrinsic PAS resistance in a methionine-independent manner.
In addition, we found several ABC transporters and many other membrane proteins were significantly decreased in folC mutated PASr Mtb ( and Supplemental Table S4). Efflux pumps play a major role in bacterial drug resistance. ABC transporters (one family of efflux pump), which consists of both exporters and importers, are conserved from bacteria to humans, and their activity are significantly associated with the clinical phenotype, toxic events, and drug disposition [Citation26,Citation27]. ABC exporters are responsible for transporting a variety of substrates such as antibiotics, proteins and lipids, while ABC importers transport a broad range of substrates including amino acids, peptides, sugars, metals and other metabolites [Citation28]. Wang et al. found ABC transporter, Rv1217c-Rv1218c to be overexpressed in clinical isolates from MDR-TB patients [Citation29]. Intracellular PAS is excluded by the efflux antiporter TAP of Mtb. Recently, Ramón-García et al. found that a major facilitator superfamily drug efflux pump, Tap (Rv1258c), conferred resistance to PAS on M. bovis BCG [Citation30]. However, our results in here showed that the folC mutated PASr 1 Mtb strains may not efflux PAS through ABC transporters, but reduce the PAS uptake by the down-regulated membrane proteins to produce resistance to PAS.
There is another interest finding in PASr 1 Mtb, viz., the phenylalanine metabolism pathway was enriched at the level of both proteome and metabolome (, , Supplemental Tables S4, S5 and S6). Recently, Patel et al. found phenylalanine-derived (Z)-5-arylmethylidene rhodanines as anti-methicillin-resistant Staphylococcus aureus (MRSA) compounds [Citation31]. Another report has shown phenylalanine metabolism can affect natural synthesis of penicillin G in Penicillium chrysogenum by offering the side chain precursor phenylacetate [Citation32]. Thus, it can be seen that phenylalanine metabolism is related to the drug resistance of pathogenic bacteria, but how does it affect the drug resistance of Mtb need further study.
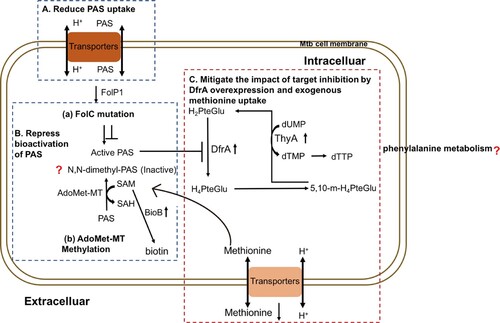
In summary, muti-omics is an uprising approach in pathogen and infectious disease research. Using this revolutionary method, we found folC mutated and un-mutated Mtb have different PAS-resistant mechanisms and a schematic summary of the mechanisms is given in . PASr1 strain evolved into a PAS-resistant Mtb via reducing bioactivation of PAS and the PAS uptake, while PASr2 strain has been shown to confer PAS resistance via overexpression of DfrA and limiting extracellular accumulation of methionine. Currently, we also use genetic and biochemical analysis, such as DfrA gene replacement and transport inhibitor to reveal changes in methionine transport between PAS-resistant and sensitive folC unmutated strains (Data not shown). Notably, we also found phenylalanine metabolism might be associated with PASr resistance in Mtb, however, how it affects PAS resistance needs further study. The results of this study improve our understanding of the mechanisms underlying the response of Mtb to PAS treatment, and may be helpful for the development of novel antibiotics therapy.
Figure 7. Mechanisms of PAS resistance in this study. Three characterized mechanisms relative to this study are shown. (A) Reduce PAS uptake. The PAS uptake is reduced in PASr1 strain via the decreasing membrane proteins, especially ABC transporters. (B) Repress bioactivation of PAS. PASr1 strain can diminish bioactivation of PAS by increasing the abundance of SAM-dependent methyltranferases and FolC mutation. (C) Overexpression of DfrA and ingesting exogenous methionine. In PASr2 strain, inhibition of dihydrofolate reduction can be negated by DfrA overexpression and exogenous methionine uptake. Blue dashed doxes represent PASr1 and red dashed dox represent PASr2 strain.
Materials and methods
Bacterial cultures
Mtb H37Rv strain was cultured on Löwenstein-Jensen (LJ) medium and were treated with PAS according to the route of to obtain PAS-resistance. 218 single colonies were randomly selected and cultured in liquid culture for the extraction of genomic DNA and testing PAS MICs of Mtb strains according to the established protocols [Citation33–35]. Then single colonies were assessed by targeted sequencing of PCR amplicons of loci associated with PAS resistance. The primers used in the targeted sequencing are described in Supplemental Table S8. For downstream experiments, Mtb strains and M. smegmatis MC2155 were cultured as in Parish and Stoker, 2001 [Citation36] (see Supplemental Experimental Procedures).
MTT assay
The MTT assay was done as described by Luciano Mengatto et al. [Citation37] (see Supplemental Experimental Procedures).
Congo red assay
Cells were grown to stationary phase, 2 μL was dropped on 7H10 medium supplemented with 1.5% agar and 100 μg/ml Congo red (Sigma), then incubated at 37°C for 21–30 days [Citation38,Citation39].
Sliding motility assay
Cells were grown to stationary phase, 2 μl was dispensed on plate containing 7H9 medium without any added carbon source (0.3% agar). The plate was then incubated at 37°C for 21–30 days [Citation38,Citation39].
Whole genome resequencing
The Mtb genome was extracted as described by Somerville et al. [Citation40]. PCR-free DNA libraries for full-genome sequencing were constructed from the genomic DNA of selected strains using a TruSeq DNA kit (Illumina, Inc.) according to the manufacturer’s protocol, with an average insert size of 350 bp for each sample, and these were assayed using the Illumina MiSeq or HiSeq 2000 sequencing systems. A base-calling pipeline (version HC1.4/RTA1.12) was used to process the raw fluorescent images and call sequences. An average of 520 Mb of data for each sample was generated, representing >100-fold sequence coverage per genome. High-quality paired-end reads were mapped to the reference H37Rv genome (GenBank NC_000962.3) using SOAP2 [Citation41] or Geneious 6.0 (Biomatters Ltd., Auckland, New Zealand) (see Supplemental Experimental Procedures).
Β-galactosidase assays for determination of promoter activity
Promoters were cloned in pSD5B and the recombinant vectors were used to transform M. smegmatis mc2 155 strains. The β-galactosidase activity of the transformants was measured according to standard procedures (see Supplemental Experimental Procedures).
qRT-PCR
Total RNA was extracted using a FastRNA™ Pro Blue kit (MP Biomedicals, Santa Ana, USA). The cDNA was synthesized from the purified RNA (1 μg) using a SuperScript III First-Strand Synthesis kit (Thermo Fisher Scientific, USA). The mRNA expression of nine different IGR downstream genes relative to sigA was determined using the following equation: 2−(Ct of IGR downstream genes − Ct of sigA) where Ct is the threshold cycle. This value was used to determine the fold difference in the mRNA expression between PASr 2 and its parent strain. The fluorescent probe used was SYBR Green (see Supplemental Experimental Procedures).
Protein preparation and iTRAQ labelling
The proteins were extracted using mechanical crushing method. For each sample, total protein (100 μg) was digested with 3.3 μl of trypsin (1 μg/μl) at 37°C for 24 h. After trypsin digestion, peptides were reconstituted in 0.5 M TEAB and processed according to the manufacturer’s instructions (Applied Biosystems) (see Supplemental Experimental Procedures).
Liquid chromatography-mass spectrometer (LC–MS) analysis
The resolved peptides were submitted to MS on an Q EXACTIVE (Thermo Fisher Scientific, San Jose, CA, USA) with an analytical C18 column (75 μm i.d. × 150 mm, 2 μm, 100 Å, nanoViper, Thermo Fisher Scientific, USA) for identification and quantification. The raw data were searched with Proteome Discoverer v2.2 version (Thermo Scientific) against the H37Rv database with the same parameters setting as previously described [Citation42]. The final proteins that were deemed to be differentially expressed were filtered as a P value <0.05 and 1.5-fold changes (>1.50 or <0.667) relative to the control group.
Metabolite extraction for LC–MS
The collected Mtb were quenched immediately by liquid nitrogen for 10min stored at −80 °C. The intracellular metabolites in Mtb were extracted according to the method described by Loots du [Citation18] and the metabolites in the culture filtrate were extracted according to the method described by Lau et al. [Citation17]. Quality control (QC) samples were prepared by mixing each aliquot with a pooled sample and analysing them in parallel using the same method. The QCs were injected at regular intervals (every eight samples) throughout the analytical run to provide a set of data from which repeatability could be assessed [Citation17] (see Supplemental Experimental Procedures).
Identification of metabolites by LC–MS
The samples were analysed in the positive ion mode on an AB 5600 + Triple TOF mass spectrometer system coupled to an Ekspert UltraLC system (110, AB Sciex) which equipped with ACQUITY UPLC HSS T3 (1.8 μm 2.1 × 100 mm, Waters) column. For MS analysis, the capillary voltage was set at +5500 V (positive mode). Other source conditions were kept constant in all the experiments as follows: the pressure of nebulizer gas (nitrogen) was 40 pa. The sheath gas was maintained at a temperature of 550°C. The scan range was adjusted to 100–1200 m/z (see Supplemental Experimental Procedures).
Data processing and statistical data analysis
The raw MS files (WIFF format file) were converted to ABF (analysis base file format) using the freely available Reifycs file converter (http://www.reifycs.com/AbfConverter/). Peak picking and alignment were performed using MS-DIAL version 2.24 and the parameters were set as follows: Alignment: MS1 tolerance, 0.01 Da; Retention time tolerance, 0.1 min; Identification: Accurate mass tolerance (MS1), 0.025 Da; Accurate mass tolerance(MS1), 0.25Da [Citation43]. Representative MS/MS spectra were exported in abf format for MS-DIAL, and compound identification was performed against MS/MS libraries including MassBank [Citation44] and MONA [Citation45].
Bioinformatics analysis
For the proteomics results, Gene ontology (GO) enrichment and Kyoto Encyclopaedia of Genes and Genomes (KEGG) analysis were performed using DAVID online software. For the metabonomics results, multidimensional statistical analysis was performed using MetaboAnalyst software, including unsupervised principal component analysis (PCA), supervised partial least squares discriminant analysis (PLS-DA). Univariate statistical analysis was performed by Students’ t-tests and KEGG pathway analysis was performed using MBROLE 2.0 online software.
Author contributions statement
W.J.W and T.C conceived, designed and supervised the overall study. L.Z and J.C.Z designed and coordinated the study. H.C.L, H.X.G and Z.Y.L provided the mutated mycobacterial strains. Z.Y.L, J.Z and H.M.Y collected and verified the mycobacterial strains. J.Z, H.M.Y and X.Z.W processed the samples and performed the experiments. W.J.W, H.M.Y, Y.Z and X.L.Z analysed the data. W.J.W and J.Z wrote the paper. All authors read and approved the final manuscript.
Disclosure statement
No potential conflict of interest was reported by the authors.
Data availability
The datasets generated during and/or analysed during the current study are available from the corresponding authors upon request.
Additional information
Funding
Related Research Data
References
- WHO. Global tuberculosis report 2017, (2017).
- Hoagland DT, Liu J, Lee RB, et al. New agents for the treatment of drug-resistant Mycobacterium tuberculosis. Adv Drug Deliv Rev. 2016;102:55–72. doi: 10.1016/j.addr.2016.04.026
- Lehmann J. Para-aminosalicylic acid in the treatment of tuberculosis. Lancet. 1946;1(6384):15.
- Minato Y, Theide JM, Kordus SL, et al. Mycobacterium tuberculosis folate metabolism and the mechanistic basis for para-aminosalicylic acid susceptibility and resistance. Antimicrob Agents Chemother. 2015;59:5097–5106. doi: 10.1128/AAC.00647-15
- Desai U, Joshi JM. Utility of para-aminosalicylic acid in drug-resistant tuberculosis: should it be classified as group D3 or group C? Lung India. 2018;35:488–493. doi: 10.4103/lungindia.lungindia_141_18
- Ferebee SH, Doster BE, Murray FJ. Ethambutol: a substitute for para-aminosalicylic acid in regimens for pulmonary tuberculosis. Ann N Y Acad Sci. 1966;135:910–920. doi: 10.1111/j.1749-6632.1966.tb45533.x
- Nixon MR. Folate pathway disruption leads to critical disruption of methionine derivatives in Mycobacterium tuberculosis. Chem Biol. 2014;21:819–830. doi: 10.1016/j.chembiol.2014.04.009
- Chakraborty S, Gruber T, Barry CE, et al. Para-aminosalicylic acid acts as an alternative substrate of folate metabolism in Mycobacterium tuberculosis. Science. 2013;339:88–91. doi: 10.1126/science.1228980
- Dawadi S, Kordus SL, Baughn AD, et al. Synthesis and analysis of bacterial folate metabolism Intermediates and Antifolates. Org Lett. 2017;19:5220–5223. doi: 10.1021/acs.orglett.7b02487
- Zhao F, Wang X-D, Erber LN. Binding pocket alterations in dihydrofolate synthase confer resistance to para-aminosalicylic acid in clinical isolates of Mycobacterium tuberculosis. Antimicrob Agents Chemother. 2014;58:1479–1487. doi: 10.1128/AAC.01775-13
- Zhang L, Huang Y, Zhou Y, et al. Antibiotic administration routes significantly influence the levels of antibiotic resistance in gut microbiota. Antimicrob Agents Chemother. 2013;57:3659–3666. doi: 10.1128/AAC.00670-13
- Zheng J, Rubin EJ, Bifani P, et al. Para-Aminosalicylic acid is a prodrug targeting dihydrofolate reductase in Mycobacterium tuberculosis. J Biol Chem. 2013;288:23447–23456. doi: 10.1074/jbc.M113.475798
- Rengarajan J, Sassetti CM, Naroditskaya V, et al. The folate pathway is a target for resistance to the drug para-aminosalicylic acid (PAS) in mycobacteria. Mol Microbiol. 2004;53:275–282. doi: 10.1111/j.1365-2958.2004.04120.x
- Zhang X, Liu L, Zhang Y, et al. Genetic determinants involved in p-aminosalicylic acid resistance in clinical isolates from tuberculosis patients in northern China from 2006 to 2012. Antimicrob Agents Chemother. 2015;59:1320–1324. doi: 10.1128/AAC.03695-14
- Yang SS. Deletion of sigB causes increased sensitivity to para-aminosalicylic acid and sulfamethoxazole in mycobacterium tuberculosis. Antimicrob Agents Chemother. 2017;61. doi: 10.1128/AAC.00551-17
- Howe MD, Kordus SL, Cole MS, et al. Methionine Antagonizes para-Aminosalicylic acid activity via affecting folate precursor biosynthesis in Mycobacterium tuberculosis. Front Cell Infect Microbiol. 2018;8:399. doi: 10.3389/fcimb.2018.00399
- Lau SK, Lam C-W, Cureem SO, et al. Identification of specific metabolites in culture supernatant of Mycobacterium tuberculosis using metabolomics: exploration of potential biomarkers. Emerg Microbes Infect. 2015;4:e6. doi: 10.1038/emi.2015.6
- Loots du T. New insights into the survival mechanisms of rifampicin-resistant Mycobacterium tuberculosis. J Antimicrob Chemother. 2016;71:655–660. doi: 10.1093/jac/dkv406
- Zhang H, Li D, Zhao L, et al. Genome sequencing of 161 Mycobacterium tuberculosis isolates from China identifies genes and intergenic regions associated with drug resistance. Nat Genet. 2013;45:1255–1260. doi: 10.1038/ng.2735
- Agarwal N, Tyagi AK. Mycobacterial transcriptional signals: requirements for recognition by RNA polymerase and optimal transcriptional activity. Nucleic Acids Res. 2006;34:4245–4257. doi: 10.1093/nar/gkl521
- Akhtar P, Singh S, Bifani P, et al. Variable-number tandem repeat 3690 polymorphism in Indian clinical isolates of Mycobacterium tuberculosis and its influence on transcription. J Med Microbiol. 2009;58:798–805. doi: 10.1099/jmm.0.002550-0
- Taylor SL, Ruhaak LR, Weiss RH, et al. Multivariate two-part statistics for analysis of correlated mass spectrometry data from multiple biological specimens. Bioinformatics. 2017;33:17–25. doi: 10.1093/bioinformatics/btw578
- Ye QZ, Liu J, Walsh CT. p-Aminobenzoate synthesis in Escherichia coli: purification and characterization of PabB as aminodeoxychorismate synthase and enzyme X as aminodeoxychorismate lyase. Proc Natl Acad Sci U S A. 1990;87:9391–9395. doi: 10.1073/pnas.87.23.9391
- Sassetti CM, Boyd DH, Rubin EJ. Genes required for mycobacterial growth defined by high density mutagenesis. Mol Microbiol. 2003;48:77–84. doi: 10.1046/j.1365-2958.2003.03425.x
- Griffin JE, Gawronski JD, DeJesus MA, et al. High-resolution phenotypic profiling defines genes essential for mycobacterial growth and cholesterol catabolism. PLoS Pathog. 2011;7:e1002251. doi: 10.1371/journal.ppat.1002251
- Ho RH, Kim RB. Transporters and drug therapy: implications for drug disposition and disease. Clin Pharmacol Ther. 2005;78:260–277. doi: 10.1016/j.clpt.2005.05.011
- International Transporter Consortium et al. Membrane transporters in drug development. Nat Rev Drug Discov. 2010;9:215–236. doi: 10.1038/nrd3028
- Tanaka KJ, Song S, Mason K, et al. Selective substrate uptake: the role of ATP-binding cassette (ABC) importers in pathogenesis. Biochim Biophys Acta Biomembr. 2018;1860:868–877. doi: 10.1016/j.bbamem.2017.08.011
- Wang K, Pei H, Huang B, et al. The expression of ABC efflux pump, Rv1217c-Rv1218c, and its association with multidrug resistance of Mycobacterium tuberculosis in China. Curr Microbiol. 2013;66:222–226. doi: 10.1007/s00284-012-0215-3
- Ramon-Garcia, S, Mick V, Dainese E, et al. Functional and genetic characterization of the tap efflux pump in Mycobacterium bovis BCG. Antimicrob Agents Chemother. 2012;56:2074–2083. doi: 10.1128/AAC.05946-11
- Patel BA, Ashby CR, Jr., Hardej D, et al. The synthesis and SAR study of phenylalanine-derived (Z)-5-arylmethylidene rhodanines as anti-methicillin-resistant Staphylococcus aureus (MRSA) compounds. Bioorg Med Chem Lett. 2013;23:5523–5527. doi: 10.1016/j.bmcl.2013.08.059
- Veiga T, Solis-Escalante D, Romagnoli G, et al. Resolving phenylalanine metabolism sheds light on natural synthesis of penicillin G in Penicillium chrysogenum. Eukaryot Cell. 2012;11:238–249. doi: 10.1128/EC.05285-11
- Kim SJ, Hong YP. Drug resistance of Mycobacterium tuberculosis in Korea. Tuber Lung Dis. 1992;73:219–224. doi: 10.1016/0962-8479(92)90090-7
- Larsen MH, Biermann K, Tandberg S, et al. Genetic Manipulation of Mycobacterium tuberculosis. Curr Protoc Microbiol. 2007. Chapter 10, Unit 10A 12. doi: 10.1002/9780471729259.mc10a02s6
- Wang X-D, Gu J, Wang T, et al. Comparative analysis of mycobacterial NADH pyrophosphatase isoforms reveals a novel mechanism for isoniazid and ethionamide inactivation. Mol Microbiol. 2011;82:1375–1391. doi: 10.1111/j.1365-2958.2011.07892.x
- Parish T, Stoker NG. Mycobacterium tuberculosis protocols. Springer Science & Business Media; 2001.
- Mengatto L, Chiani Y, Imaz MS. Evaluation of rapid alternative methods for drug susceptibility testing in clinical isolates of Mycobacterium tuberculosis. Mem Inst Oswaldo Cruz. 2006;101:535–542. doi: 10.1590/S0074-02762006000500009
- Deshayes C, Laval F, Montrozier H, et al. A glycosyltransferase involved in biosynthesis of triglycosylated glycopeptidolipids in Mycobacterium smegmatis: impact on surface properties. J Bacteriol. 2005;187:7283–7291. doi: 10.1128/JB.187.21.7283-7291.2005
- Sondén B, Kocíncová D, Deshayes C, et al. Gap, a mycobacterial specific integral membrane protein, is required for glycolipid transport to the cell surface. Mol Microbiol. 2005;58:426–440. doi: 10.1111/j.1365-2958.2005.04847.x
- Somerville W, Thibert L, Schwartzman K, et al. Extraction of Mycobacterium tuberculosis DNA: a question of containment. J Clin Microbiol. 2005;43:2996–2997. doi: 10.1128/JCM.43.6.2996-2997.2005
- Li R, Yu C, Li Y, et al. Soap2: an improved ultrafast tool for short read alignment. Bioinformatics. 2009;25:1966–1967. doi: 10.1093/bioinformatics/btp336
- Srivastava R, Mannam P, Rauniyar N, et al. Proteomics data on MAP Kinase Kinase 3 knock out bone marrow derived macrophages exposed to cigarette smoke extract. Data Brief. 2017;13:320–325. doi: 10.1016/j.dib.2017.05.049
- Tsugawa H, Cajka T, Kind T, et al. MS-DIAL: data-independent MS/MS deconvolution for comprehensive metabolome analysis. Nat Methods. 2015;12:523–526. doi: 10.1038/nmeth.3393
- Horai H, Arita M, Kanaya S, et al. Massbank: a public repository for sharing mass spectral data for life sciences. J Mass Spectrom. 2010;45:703–714. doi: 10.1002/jms.1777
- Hilbig M, Rarey M. Mona 2: a light cheminformatics platform for interactive compound library processing. J Chem Inf Model. 2015;55:2071–2078. doi: 10.1021/acs.jcim.5b00292