
ABSTRACT
Shiga toxin-producing Escherichia coli (STEC) are foodborne pathogens causing severe gastroenteritis, which may lead to hemolytic uremic syndrome. The Locus of Enterocyte Effacement (LEE), a Pathogenicity Island (PAI), is a major determinant of intestinal epithelium attachment of a group of STEC strains; however, the virulence repertoire of STEC strains lacking LEE, has not been fully characterized. The incidence of LEE-negative STEC strains has increased in several countries, highlighting the relevance of their study. In order to gain insights into the basis for the emergence of LEE-negative STEC strains, we performed a large-scale genomic analysis of 367 strains isolated worldwide from humans, animals, food and the environment. We identified uncharacterized genomic islands, including two PAIs and one Integrative Conjugative Element. Additionally, the Locus of Adhesion and Autoaggregation (LAA) was the most prevalent PAI among LEE-negative strains and we found that it contributes to colonization of the mice intestine. Our comprehensive and rigorous comparative genomic and phylogenetic analyses suggest that the accumulative acquisition of PAIs has played an important, but currently unappreciated role, in the evolution of virulence in these strains. This study provides new knowledge on the pathogenicity of LEE-negative STEC strains and identifies molecular markers for their epidemiological surveillance.
Introduction
Shiga toxin-producing Escherichia coli (STEC) are a group of food-borne pathogens that cause diarrhea and severe diseases, such as Hemorrhagic Colitis (HC) and Hemolytic Uremic Syndrome (HUS), primarily in children under 5 years of age [Citation1]. STEC causes outbreaks and sporadic cases of gastroenteritis affecting both public health and the food industry [Citation2]. Shiga toxins (Stx) are the primary STEC virulence factors responsible for pathologies such as HC and HUS [Citation3]. There are two variants of Stx, Stx1 and Stx2, which include subtypes (Stx1a,c,d and Stx2a-g) defined by nucleotide differences, biological activity and serological reactivity [Citation4]. STEC strains producing Stx1a, Stx2a, and/or Stx2d are associated with the most severe cases [Citation5].
The Locus of Enterocyte Effacement (LEE) Pathogenicity Island (PAI) harbors genes that mediate the adhesion phenotype of a group of STEC strains (LEE-positive) that are associated with HUS and are clinically relevant. Specifically, LEE mediated adherence leads to the loss of intestinal microvilli, resulting in severe diarrhea [Citation6]. However, STEC strains lacking LEE (LEE-negative STEC) have also been isolated from severe disease cases, suggesting the existence of additional virulence factors that also favor the pathogenicity of these bacteria. A study examining a small number of STEC LEE-negative strains demonstrated that this is a heterogeneous group, harboring diverse arrays of virulence factors [Citation7]. Genetic elements such as the PAIs harbor several of these virulence factors. Three PAIs have been reported as exclusively present in LEE-negative STEC strains, namely: the Locus of Proteolysis Activity (LPA) [Citation8], the Subtilase-Encoding Pathogenicity Island (SE-PAI) [Citation9] and the Locus of Adhesion and Autoaggregation (LAA) [Citation10]. However, the pathogenicity mechanisms mediated by these PAIs have not been thoroughly investigated. Recently, LEE-negative STEC strains belonging to serogroups O91, O113, O128, O146 and O174 have been increasingly identified from clinical cases in Europe, Argentina and South Korea [Citation11–15]. Unfortunately, limited surveillance of LEE-negative STEC strains has prevented an accurate assessment of their global spread and impact on public health [Citation16].
A useful strategy for studying the evolution of these pathogens involves combining comparative genomics with epidemiological data [Citation17,Citation18]. Moreover, associations between genetic data and phenotypic behavior improve these analyses and may contribute to reaching new insights into the features that have favored the emergence of these strains in the clinical setting, as well as delineate the virulence potential of specific strains [Citation19]. While studies using these approaches have increased our understanding of LEE-positive STEC strains [Citation17,Citation19,Citation20], the number of studies involving LEE-negative STEC strains is limited [Citation7].
Therefore, we performed a large-scale genomic analysis of 367 LEE-negative STEC strains isolated globally from several sources, including humans, food, animals and the environment. As a result, we were able to identify uncharacterized Genomic Islands (GIs), including two novel PAIs and one Integrative and Conjugative Element (ICE). In addition, we found that LAA was the most prevalent PAI among LEE-negative STEC strains, suggesting that it plays an important role. This work also provides experimental evidence supporting the participation of LAA in the intestinal colonization of a mouse model of STEC infection. Phylogenetic analyses and genomic comparisons suggest that evolutionary events, in which individual genes or groups of genes are acquired, could explain the increased incidence of these strains. This study is a step forward in our knowledge of the evolution of genomes and pathogenic mechanisms of LEE-negative STEC, with important implications for future studies on their epidemiology and surveillance.
Materials and methods
Bacterial strains, plasmids and primers
The STEC strains used in this study are summarized in Table S1. Spontaneously derived streptomycin resistant (Strr) mutants of STEC strains O113:H21 E045-00 and O91:H21 V07-4-4, were used in this study. Strains were grown in static or agitated LB at 37°C. Culture media was supplemented as needed with ampicillin (100 µg/ml), kanamycin (50 µg/ml) or streptomycin (50 µg/ml). Plasmids and primers used are summarized in Table S9.
Genome sequencing
The 35 STEC strains sequenced in this study were isolated from Argentina (n = 14) [Citation21], Chile (n = 16) [Citation22] and Spain (n = 5). Genomic DNA was extracted using the Wizard genomic DNA purification kit (Promega Corp., USA) and sequenced at MicrobesNG (University of Birmingham, UK) using Illumina MiSeq or HiSeq 2500 technology platforms with 2×250-bp paired-end reads. Draft genomes were provided after trimming low quality-ends and assembling reads with SPAdes 3.10 [Citation23]. Assembly statistics were obtained with Quast v4.6.3 [Citation24]. Contigs shorter that 200 nt were removed and sequences were deposited at GenBank under Bioproject PRJNA448751. Nucleotide accession codes are included in Table S1.
Publicly available genome sequences
A total of 332 genome sequences of LEE-negative STEC strains were downloaded from GenBank on 15 January 2018. Sequences management and BLAST searches were performed using Geneious software (v11.0.5; Biomatters Ltd). The presence of stx genes and the absence of the eae gene were confirmed using BLASTn. Genomes accession numbers are listed in Table S1.
In silico serotyping and detection of virulence genes
Serotype was determined in silico using the SerotypeFinder tool [Citation25]. A set of virulence genes (stx, subA, astA, cdtB, sta1, stb, senB, lpfA, iha, espP, espI, epeA, pic, sigA, cba, celb, cma, mcmA, mchB, mchC and mchF) were identified using VirulenceFinder [Citation26]. Other genes were detected using BLASTn: saa (AF399919.3; positions:6290-7840), sab (AY258503.2; positions:118905-123200), eibG (GU295813.1), hes (CP023541.1; positions:4035512-4036252), lesP (CP023541.1; positions:4063646-4067740), tia (JQ994271.1; positions:4726-5472), and hra1 (U07174.1). The presence of a gene was confirmed when a coverage and identity >90% was found. The ag43 gene has several alleles that are divided into two subfamilies [Citation27]. Therefore, the identification of the ag43-I (subfamily I) and ag43-II (subfamily II) alleles was achieved by in silico PCR using primers targeting conserved regions as previously described by Montero et al. [Citation22].
Identification of PAIs and ICEs
Nucleotide sequences of LAA, SE-PAI, LPA and the High-Pathogenicity Island (HPI) were downloaded from GenBank, using accession numbers AFDQ01000026.1 (positions:385984-472336), JQ994271, AJ278144.1 and AL031866 (positions: 78113-114560), respectively. These sequences were used to perform BLASTn searches against each genome. By default, absence was defined as coverage and/or identity <70%. Since LAA is composed of four modules [Citation10], a strain was considered positive for this PAI when at least three of its modules were identified. Identification and characterization of genomic regions with features of PAIs and/or ICEs were performed using REPuter [Citation28], ISfinder [Citation29] and tRNAscan-SE [Citation30]. Open reading frames (ORFs) and the G+C content were determined using Geneious software. Contigs assembly (mapping) against a reference sequence was performed in Geneious software. The genomic regions corresponding to new PAIs and ICEs were extracted from the original genome sequences available in GenBank and then annotated using the RAST server [Citation31] (Files S1-3). These genomic regions were searched in the Islander [Citation32] and PAIDB [Citation33] databases but none of the homologous sequences exceeded 20% of consultation coverage. The association network (based on a presence/absence matrix) showing the co-occurrence or mutually exclusive patterns in the distribution of PAIs was drawn using igraph package [Citation34] in R [Citation35]. For the presence/absence matrix, absence was defined as coverage and/or identity <70%. Comparisons between ICE sequences were performed using progressiveMauve [Citation36].
Construction of isogenic mutants
The LAA PAI was inactivated in the STEC E045-00 and V07-4-4 genomes by allelic replacement, as previously described [Citation37]. Both strains have the complete set of LAA’s genes compared to the prototype LAAB2F1 and the deletion comprised approximately 86 kb. For this, the E045-00 and V07-4-4 strains carrying plasmid pKD46, encoding the lambda-derived Red recombination system, were transformed with a PCR fragment containing the kanamycin resistance (Kan) gene flanked by 49 and 53 nucleotides identical to the 3′-ends of the pheV-tRNA and the LAA PAI (Table S9). The kanamycin-resistant clones were analyzed by PCR to verify the allelic exchange at the right locus using an internal primer to the Kan gene (Kan_rev) and another flanking LAA (LAA_conf_for).
Two-dimensional polyacrylamide gel electrophoresis
Outer membrane protein (OMP) extracts were obtained and analyzed by 2D-PAGE as described [Citation22]. Selected spot proteins were cut from the polyacrylamide gels and identified by MALDI-TOF/TOF at the Mass Spectrometry Core at the University of Texas Medical Branch (Galveston, Texas).
Bacterial adhesion and biofilm formation assays
Bacterial adhesion to Caco-2 and HT-29 epithelial cells and biofilm formation were measured as previously described [Citation10].
Mouse infection studies
All animal experiments were carried out at the Universidad de Concepción, following protocols approved by the Faculty of Biological Sciences Bioethics Committee. Male BALB/c mice (6–8 weeks old; from Instituto de Salud Pública, Santiago, Chile) were randomly distributed into experimental groups. Mice were kept in conventional animal facilities and received water and food ad libitum. The STEC infection mouse model was carried out as previously described [Citation38], with minor modifications. Briefly, mice were given water ad libitum containing streptomycin (5 g/l) 24–48 h prior to inoculation and for the duration of the experiment. Bacterial strains were grown in agitated LB supplemented with streptomycin (50 µg/ml) at 37°C for 18 h. Cultures were centrifuged, the pellets were washed in sterile PBS and resuspended in a 20% sucrose (w/v) and 10% NaHCO3 (w/v) solution in sterile water to ∼1010 colony forming units (cfu)/ml. Bacterial concentration was confirmed by serial dilution and cfu counts in LB agar plates.
Mice were then starved of food and water overnight (12 h). The next morning, each animal was orally infected by pipette feeding with 100 µl of a bacterial suspension containing 109 cfu/ml. Following challenge, animals were housed individually, and food and water supplemented with streptomycin (5 g/l) was reintroduced and provided ad libitum. Intestinal colonization by the challenging bacteria was determined by bacterial shedding in feces over time. Feces were collected daily, weighed, homogenized, suspended in 1 ml PBS and, after serial dilutions in PBS, plated on MacConkey agar plates supplemented with streptomycin (50 µg/ml) to determine the cfu. For the survival experiments mice were handled and infected as described for the colonization experiments’ however, the cfu in feces over time was not recorded.
Phylogeny, phylogroups, molecular typing and Bayesian analysis of population structure (BAPS)
A parsimony phylogenetic tree based on core single nucleotide polymorphisms (SNPs) of 367 complete or draft genomic sequences of LEE-negative STEC, and E. coli K-12 MG1655, was built with kSNP3.1 [Citation39], using a 20-core Dell Poweredge R730 server. Briefly, SNPs flanked by stretches of six nucleotides on each side were identified using k-mers of 13-nucleotides, screened in all the genomes, counted and tabulated into a matrix, in order to build a phylogenetic tree with the parsimony method. A total of 3,956 SNPs were considered for the final tree, which represents the consensus of 100 bootstrap replicates. The tree was further processed with the Interactive Tree of Life tool [Citation40]. LEE-negative STEC population structure was delineated with RhierBAPS [Citation41] using the 3,956 core SNPs. For this, a 3 depth levels and a maximum clustering size of 70 (default = number of isolates/5; 367/5 = 73,4) were specified. Phylogroup assignment was conducted in silico using the ClermonTyping Tool [Citation42]. STs of each strain were determined according to the Achtman scheme [Citation43] using MLST 1.8 tool [Citation44].
Statistical analysis
Differences in the distribution of virulence genes between isolation sources were analyzed using Fisher's Exact test (two-tailed). Pairwise association (co-occurrence or mutual exclusivity) between PAIs, ICEs and toxins was performed in contingency tables by Odds ratios. The statistical significance of these associations was determined using Pearson's chi-squared test or Fisher's exact test (when frequencies were less than 5). When any of the cell values of the contingency table was zero, 0.5 was added to all cells (Haldane correction) to avoid errors in the statistical test. Differences in bacterial colonization and survival rates between groups of mice were analyzed using Mann–Whitney U Test and log-rank test, respectively. Differences between the genome sizes were analyzed using Kruskal–Wallis test followed by Dunn's multiple comparison test. For all statistical tests, a P value of <0.05 was considered significant.
Results
Strains analyzed in this study
Genomes of thirty-five LEE-negative STEC strains isolated in Argentina (n = 14), Chile (n = 16) and Spain (n = 5) were sequenced and analyzed along genomes (draft or complete) of 332 LEE-negative STEC strains isolated worldwide that are available in GenBank (Table S1, Figure S1a). These strains were isolated from humans (n = 150), animals (n = 123), food (n = 45), the environment (n = 4), and from unknown sources (n = 45) (Table S2) between 1947 and 2016 (Figure S1b).
Serotypes, toxins and virulence gene content
A total of 101 serotypes were identified using SerotypeFinder tool [Citation25] (Table S1 and S2); however, in 15 genomes only the ‘H’ antigen was identified. The most frequent serotypes were O91:H14 (n = 29), O113:H21 (n = 29), O91:H21 (n = 22), O174:H21 (n = 18), O146:H21 (n = 17), O174:H8 (n = 12), O22:H8 (n = 10) and O8:H19 (n = 9), which have been previously reported to cause diarrhea, dysentery and HUS [Citation16,Citation45–47]. Previous studies have also demonstrated this significant diversity of O:H types among LEE-negative STEC strains [Citation10,Citation45].
The presence/absence of stx genes and other virulence genes harbored by these strains was determined using VirulenceFinder tool [Citation26] and the BLASTn algorithm (Table S1 and S3). The frequency of detection for each gene is presented in . Among the strains (n = 367), 266 (72.5%) contained only one stx gene and 101 (27.5%) had more than one (Table S4). The most frequent combinations of stx genes were stx1a + stx2a (32/367; 8.7%) and stx1c + stx2b (30/367; 8.2%). The stx2b gene was found in a statistically greater proportion of human strains compared to animal strains. In contrast, stx1d, stx2a and stx2e were found in a greater proportion of animal strains compared to human strains. Additionally, the virulence genes senB, eibG, ag43-I, tia and sigA were significantly more frequent in human strains, whereas sta1, saa, hra1, lpfA, lesP and espP were significantly more often found in animal strains.
Table 1. Distribution of virulence determinants among LEE-negative STEC strains isolated from different sources.
A previous study reported the presence of genes encoding bacteriocins among LEE-negative STEC strains isolated from humans [Citation11]. Bacteriocins are antimicrobial peptides produced by bacteria that are active against closely related strains [Citation48]. E. coli produces two types of bacteriocins, classified by their molecular weight as colicins (25–80 kDa) and microcins (<10 kDa) [Citation48]. Notably, we found that the mch cluster involved in the synthesis of microcins was more frequently detected in strains isolated from humans compared to strains isolated from other sources (). Whether the production of microcins improves the fitness of these bacteria during human infection remains to be investigated. Altogether, these data show that LEE-negative STEC strains contain several genes that potentially provide phenotypes associated with adhesion, colonization and toxicity. While different combinations of some of these genes may contribute to virulence during human infection, others may be necessary for persistence in animal reservoirs.
Identification of novel Pathogenicity Islands and Integrative and Conjugative Elements
PAIs contribute to the evolution and virulence of pathogenic E. coli strains [Citation49]. Therefore, we aimed to determine the distribution of the SE-PAI, LPA and LAA islands. We also searched for the HPI of Yersinia pestis, which is widely present among many Enterobacteriaceae, including E. coli [Citation50]. Several of the virulence genes highlighted in this study have been previously mapped to known PAIs, such as tia and subA in SE-PAI; iha and espI in LPA; and hes, iha, lesP and ag43-I in LAA. Interestingly, BLASTn searches using the complete nucleotide sequences of the PAIs showed that tia is also present in other regions of the chromosome of strains that lack SE-PAI. Further analysis on the genomic context of tia revealed two previously uncharacterized genomic regions which contained this gene and that exhibit features commonly found in PAIs ().
Figure 1. Genetic structure of two new Pathogenicity Islands identified among LEE-negative STEC strains. Predicted genes and direction of transcription are represented as block arrows. Open reading frames (ORFs) are color coded according to gene function (see legend). Names of some genes are shown. Features of each ORF are listed in Tables S5 and S6. (a) Locus of Invasion and Contact-dependent Growth Inhibition (LIC). This genomic region is located adjacent to the selC-tRNA gene in the contig 13 (GenBank accession: NJVC01000013) of the draft genome of STEC O174:H21 str. MOD1-EC1633. The complete LIC sequence is available in File S1 (b) Locus of Adhesion and Colonization (LAC). This genomic region is located adjacent to the pheV-tRNA gene in the contig 3 (GenBank accession: AYKD01000003.1) of the draft genome of E. coli strain FCH1. The complete LAC sequence is available in File S2.
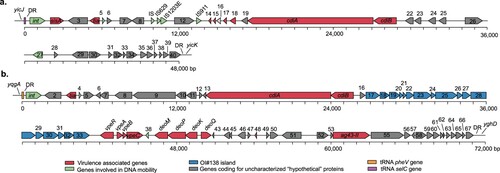
One of these PAIs, found in contig 13 of the draft genome of STEC O174:H21 MOD1-EC1633 (GenBank accession: NJVC01000013), is a 48-kb genomic region located next to the selC-tRNA gene ((a)). Among other characteristics it includes: (i) an integrase-encoding gene (ORF1) localized downstream of the selC-tRNA gene; (ii) it is flanked by 23-bp imperfect direct repeats (DR), corresponding to the 3′ end of the selC-tRNA gene; (iii) a lower GC content than average for the MOD1-EC1633 chromosome; (iv) several insertion sequences (IS); and (v) various virulence-associated genes, such as tia (ORF4), which has been involved in invasion of LEE-negative STEC strains [Citation51], as well as a group of genes (ORFs 14–21) encoding a member of the contact-dependent growth inhibition (CDI) system [Citation52]. Specifically, ORF20 encodes a protein sharing 89.3% similarity with the prototypic CdiA protein (GenBank protein access: AAZ57198.1) of E. coli EC93 [Citation53], while ORF21 encodes a CdiB homolog, a β-barrel protein which exports CdiA through the outer membrane. Since this genomic region contained the tia gene related to bacterial invasion and encoded a CDI system, it was named Locus of Invasion and Contact-dependent Growth Inhibition (LIC).
The second PAI was identified in contig 57 of STEC O22:H8 MOD1-EC3763 draft genome (GenBank access: NJSE01000057.1); nevertheless, this contig is only 13-kb and not thought to contain the whole PAI sequence. This genomic region was not found in other LEE-negative STEC strains within a single contig, but an additional search in GenBank identified a sequence with 99.9% identity in contig 3 (214-kb) of the draft genome of E. coli FCH1 (GenBank accession: AYKD01000003.1). Further analyses revealed that the 13-kb fragment is part of a 71-kb PAI inserted in the pheV-tRNA gene of the FCH1 chromosome ((b)). The characteristics of each ORF in this region are shown in Table S6. Subsequently, the contigs of the MOD1-EC3763 strain were mapped against the Whole Genome Sequence (WGS) of strain FCH1 (see Methods), allowing us to identify 99.6% of the PAI (70,923 bp with 99.8% identity) within 7 ordered and concatenated contigs of the draft genome of strain MOD1-EC3763 (Figure S2). The presence of the PAI structure was also determined in other STEC strains (see below). Interestingly, the FCH1 strain is a human isolate lacking stx genes [Citation54], indicating that this PAI is not restricted to STEC. The characteristics identified in this genomic region include: (i) it is inserted / integrated next to the pheV-tRNA gene; (ii) an integrase-encoding gene (ORF1) located downstream of the pheV-tRNA gene; (iii) flanking 23-bp imperfect DR corresponding to the 3′ end of the pheV-tRNA gene; (iv) IS elements; and (v) several virulence genes, including tia (ORF3); ORF14 encoding a protein sharing 88.1% and 86.5% similarity with the prototypic CdiA protein and the CdiA homolog harbored by the LIC PAI, respectively; the vpe (ORFs 34–37) and deoK (ORFs 39–42) operons, which are also present in GIs of other E.coli pathotypes and promote intestinal colonization by pathogenic E. coli strains in murine infection models [Citation55,Citation56]; and ORF54, which encodes a protein sharing 87.6% and 79.8% similarity with Cah (GenBank access: AAG55356.1) and Ag43 (GenBank access: AUG16753.1), which participate in adhesion, autoaggregation and biofilm formation [Citation27]. Moreover, we identified a group of genes (ORFs 17–33) sharing 91% identity with the OI#138 island (GenBank access: AE005571) of STEC O157:H7. The OI#138 has not been previously characterized, but its predicted function is the biosynthesis of fatty acids and polyketides [Citation57]. Since this group of genes is related to adhesion and colonization, this genomic region was named Locus of Adhesion and Colonization (LAC).
The sigA gene was almost exclusively present in a group of clinical LEE-negative STEC strains (, Table S1). This gene was originally reported in the she PAI of Shigella flexneri 2a [Citation58] and later in two PAIs harbored by the STEC/EAEC O104:H4 strain that caused the 2011 HUS outbreak in Europe [Citation59]. Considering these observations, we sought to determine whether this gene is harbored in a mobile genetic element (MGE). In silico analysis of the genomic context of sigA in the draft genome of STEC O117:H7 str. FHI72 (GenBank assembly accession: GCA_000939255.1) showed that an integrase-encoding gene and a pheV-tRNA are located 20,168 and 20,442 bp upstream of the sigA start codon, respectively ((a)). In addition, a 52-bp perfect DR corresponding to the 3′ end of the pheV-tRNA was also identified 66,066 bp downstream of the sigA start codon. These DR sequences flank an 86,482-bp genomic region inserted in the pheV-tRNA gene, which has a similar G+C content (51%) as the FHI72 chromosome. A total of 103 ORFs were identified, including genes involved in DNA conjugation and type IV pilus biogenesis (Table S7), features that are exhibited by integrative and conjugative elements (ICEs) [Citation60]. Seven ICEs had been identified in E. coli according to the ICEberg database [Citation61]. Consequently, based on the nomenclature proposed by Burrus et al. [Citation62], we named this genomic region ICEEc8 and found that it is present in strains belonging to the serotypes O91:H14 (7/29; 24%) and O117:H7 (5/5; 100%). In addition to sigA (ORF23), another virulence gene carried by ICEEc8 of O117:H7 strains is iha (ORF52), which is absent in ICEEc8 harbored by O91:H14 strains that also has an inverted region of about 40-kb ((b,c)).
Figure 2. Genetic structure of the Integrative and Conjugative Elements (ICEs) identified among LEE-negative STEC strains. (a) and (c) ICEs identified among LEE-negative STEC strains. (a) ICE located adjacent to pheV-tRNA gene in STEC O117:H7 str. FHI72 draft genome (GenBank assembly accession: GCA_000939255.1). The complete ICEEc7 sequence is available in File S3. (c) ICE located adjacent to pheV-tRNA gene in the contig 26 (GenBank accession: LOGV01000031.1) of the STEC O91:H14 str. 2174 draft genome. Predicted genes and transcription direction are represented as block arrows. Open reading frames (ORFs) are color coded according to gene function, as indicated by legend at the bottom. Names of some genes are shown. Features of each ORF in (a) are listed in Table S7. (b) Alignment between ICEs shown in (a) and (c). Alignment was performed using progressiveMauve [Citation36]. Colored segments represent homologous regions. Non-colored areas represent unaligned sequences that may be genome-specific. Inverted regions are identified by boxes below the central line.
![Figure 2. Genetic structure of the Integrative and Conjugative Elements (ICEs) identified among LEE-negative STEC strains. (a) and (c) ICEs identified among LEE-negative STEC strains. (a) ICE located adjacent to pheV-tRNA gene in STEC O117:H7 str. FHI72 draft genome (GenBank assembly accession: GCA_000939255.1). The complete ICEEc7 sequence is available in File S3. (c) ICE located adjacent to pheV-tRNA gene in the contig 26 (GenBank accession: LOGV01000031.1) of the STEC O91:H14 str. 2174 draft genome. Predicted genes and transcription direction are represented as block arrows. Open reading frames (ORFs) are color coded according to gene function, as indicated by legend at the bottom. Names of some genes are shown. Features of each ORF in (a) are listed in Table S7. (b) Alignment between ICEs shown in (a) and (c). Alignment was performed using progressiveMauve [Citation36]. Colored segments represent homologous regions. Non-colored areas represent unaligned sequences that may be genome-specific. Inverted regions are identified by boxes below the central line.](/cms/asset/11b89694-edc1-4146-a778-fdd493f3ff9c/temi_a_1595985_f0002_oc.jpg)
Overall, our results indicated that the most prevalent PAI was LAA (151/367; 41.2%), followed by SE-PAI (65/367; 17.7%), LPA (59/367; 16.1%) and HPI (43/367; 11.7%). The least frequent PAIs were LIC (25/367; 6.8%) and LAC (11/367; 3%) (). Regarding to the distribution of ICEEc8, it was identified in 12/367 (3.2%) human strains. All these MGEs were identified in strains belonging to various serotypes (Table S8), demonstrating their widespread distribution among LEE-negative STEC strains; however, only SE-PAI and LIC were detected with a significantly (p < 0.05) higher frequency in human strains compared to animal strains (). Besides, ICEEc8 was exclusively identified in human strains.
Additionally, we found patterns of association (co-occurrence and mutual exclusivity) among PAIs, the ICEEc8 and some toxin genes (). For instance, LAA, LIC and LAC, SE-PAI and LPA, as well as LPA and HPI, have a high co-occurrence probability (p < 0.005, p < 0.0005 and p < 0.05, respectively) ((b)). In contrast, LAA is mutually excluding with SE-PAI, LPA and HPI (p < 0.0005). Notably, LAA was co-occurrent with stx1a, stx2a, stx2c and stx2d, which encode to the Stx subtypes responsible for the most severe cases of STEC infection [Citation5]. Whether these associations provide selective advantages to particular strains or are linked to the genetic background of each strain is not clear.
Figure 3. Patterns of association between PAIs, ICEs and toxins identified among the LEE-negative STEC strains (a) Graph of modules showing interactions among PAIs, ICEs and toxins. Module links are weighted by both the number of strains linked between modules and the number of strains within modules. Modules and links of PAIs and ICEs are colored according to the legend. The number of strains positive for each PAI and ICE is shown in parentheses in the legend. The number of strains in which two specific PAIs were identified (co-occurrence) is shown next to the links (dotted lines). The figure was prepared using the package igraph [Citation34] in R [Citation35]. (b) Pairwise association plot for PAIs, ICEs and toxins. Red squares represent negative associations (mutual exclusivity); Blue squares represent positively associations (co-occurrence). The color scale represents the magnitude of the association determined by Pearson's Chi-square test or Fisheŕs exact test (when frequencies were less than 5). The figure was prepared using the package corrplot [Citation76] in R [Citation35].
![Figure 3. Patterns of association between PAIs, ICEs and toxins identified among the LEE-negative STEC strains (a) Graph of modules showing interactions among PAIs, ICEs and toxins. Module links are weighted by both the number of strains linked between modules and the number of strains within modules. Modules and links of PAIs and ICEs are colored according to the legend. The number of strains positive for each PAI and ICE is shown in parentheses in the legend. The number of strains in which two specific PAIs were identified (co-occurrence) is shown next to the links (dotted lines). The figure was prepared using the package igraph [Citation34] in R [Citation35]. (b) Pairwise association plot for PAIs, ICEs and toxins. Red squares represent negative associations (mutual exclusivity); Blue squares represent positively associations (co-occurrence). The color scale represents the magnitude of the association determined by Pearson's Chi-square test or Fisheŕs exact test (when frequencies were less than 5). The figure was prepared using the package corrplot [Citation76] in R [Citation35].](/cms/asset/9fdca559-7df0-4ab4-9265-c782dab91fea/temi_a_1595985_f0003_oc.jpg)
Functional analysis of the LAA PAI
The high prevalence of LAA among LEE-negative STEC strains suggests that it may play an important biological role, but its contribution to the pathogenicity remains uncharacterized. Therefore, we generated a LAA deletion mutant of STEC O113:H21 E045-00 to address its role in different functional in vitro and in vivo assays.
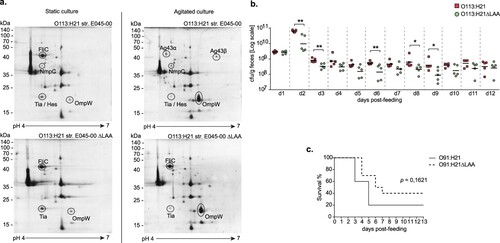
The OMP profiles of E045-00 and its isogenic mutant ΔLAA, grown in static or agitated LB cultures at 37°C, were analyzed by 2D-PAGE (a). Differentially synthesized OMP proteins were identified by mass spectrometry. The LAA-encoded Ag43 protein was synthesized during agitated growth, but not in static cultures. In contrast, the flagellar protein (FliC-H21) was present in samples from static cultures, but it was undetectable by 2D-PAGE in agitated culture samples. This opposite regulatory effect on the expression of FliC and Ag43 was previously reported [Citation63]. Interestingly, in the absence of LAA, FliC-H21 was detected in similar quantities in extracts obtained from agitated and static cultures, suggesting the presence of a regulatory crosstalk between LAA and the flagellar genes that deserves future analysis. As expected, the OMP profiles of the ΔLAA mutant did not show spots corresponding to the NmpC and Ag43 proteins (both encoded in LAA). A single spot corresponded to the Tia and LAA-encoded Hes proteins. Both proteins belong to the Heat resistant agglutinin family (Hra), and share 65% identity in their amino acid sequence [Citation10], with nearly identical isoelectric points and molecular masses. The E045-00 strain contains two copies of the tia gene, localized in the LIC and LAC PAIs (Table S1). In the wt and ΔLAA strains, Tia was more abundant in the static culture samples; it remains to be determined if both tia genes are up-regulated under static growth. The OmpW protein which has been associated with protection against phagocytosis [Citation64], was more abundant in the agitated culture. Based on these results, the subsequent functional experiments were performed by growing bacteria in agitated LB.
Figure 4. Functional analyses of the LAA PAI. (a) 2D-PAGE OMP profiles of STEC O113:H21 E045-00SR strain and its isogenic mutant ΔLAASR. Strains were grown in LB broth with (right) or without agitation (left). 12% polyacrylamide gels (13 cm; pH range: 4–7) were stained with Coomassie blue G-250, and selected spots (proteins) were identified by MALDI-TOF/TOF mass spectrometry. The scale bars on the left indicate molecular weights in kDa. (b) Colonization of streptomycin-treated mice orally inoculated with 109 cfu of E045-00SR or E045-00ΔLAASR. Fecal pellets were collected daily, weighed, homogenized, and plated on MacConkey agar containing streptomycin. Data points are cfu/g of fecal sample collected from each mouse on the indicated day. Lines represent means. Differences in colonization levels for each day were analyzed using the Mann-Whitney U Test (*p < 0.05 **p < 0.005). (c) Survival rate of groups of ten streptomycin-treated mice orally inoculated with STEC O91:H21 V07-4-4SR strain or its isogenic mutant ΔLAASR. The difference in the survival rate between both groups was analyzed using the log-rank test. Statistical significance level was defined as p < 0.05.
Next, we evaluated whether the deletion of LAA affected the adhesion and biofilm formation of E045-00. In vitro assays indicated that E045-00 and its isogenic mutant ΔLAA have similar levels of adhesion to Caco-2 and HT-29 cells after 30 min or 1 h of incubation. Furthermore, the biofilm formation of E045-00 at 24, 48 and 72 h were low and unaffected by the deletion of LAA (not shown).
Then the role of LAA in intestinal colonization was evaluated in a streptomycin-treated mouse infection model. Colonization levels of E045-00 and the ΔLAA mutant were significantly different at 2, 3, 6, 8, and 9 days post-infection, suggesting the involvement of LAA in this phenotype; however, no significant difference were observed at days 10–12 ((b)). It is worth mentioning that E045-00 harbors the LAC PAI, where the vpe and deoK operons, which promote colonization of the murine intestine [Citation55,Citation56], are located. At this point, we can't rule out the possibility that genes contained within LAC or other PAIs may mask the lack of LAA.
To further evaluate the functionality of LAA in a different genetic background, we used the STEC O91:H21 V07-4-4 strain, from which a ΔLAA mutant was generated. As observed in E045-00, the deletion of LAA did not affect the adhesion to human epithelial cells and biofilm formation of V07-4-4 (not shown). The V07-4-4 produces Stx2d, the Stx subtype with the highest toxicity in the murine model [Citation65]. Therefore, groups of streptomycin-treated mice were infected with the V07-4-4 or its ΔLAA mutant and survival of the mice was recorded. Mice infected with either V07-4-4 or its ΔLAA mutant showed signs of disease (lethargy and reduced food and water consumption) from day 2–8 after challenge. Two out of 10 (20%) and four out of 10 (40%) mice challenged with V07-4-4 or the ΔLAA mutant, respectively, survived until the end of the experiment (day 13). Nevertheless, a non-significant difference between the experimental groups was observed (p = 0.1621) in the survival curves ((c)).
Phylogenetic and population structure analyses and molecular typing
We investigated the evolutionary history of the strains through phylogenetic analysis based on single nucleotide polymorphisms (SNPs) found in every genome (core SNPs). The maximum parsimony tree obtained is shown in . Next, the population structure was assessed by a Bayesian clustering method (see methods), which identified seven sequence clusters (SCs; primary clusters) that were further subdivided into 31 lineages (L1 to L31; BAPS level 2). Most of the lineages were monophyletic and included strains belonging to a specific serotype with some exceptions, as lineage 13, which included several serotypes and ancestors localized in different branches across the tree. This analysis also allowed the identification of several sub-lineages (BAPS level 3; see below). Phylogroups and Sequence Types (STs) were also determined. A total of one hundred and six different STs were identified, all of which have been previously described (Table S1). In general, the topology of the tree was consistent with the distribution of phylogroups, serotypes and STs, but not serogroups, which in some cases (e.g. O91, O113, O174) were separated into distant branches ( and ). A previous study has also shown the polyphyletic nature of STEC serogroups [Citation10].
Figure 5. Phylogenetic relationships and population structure of LEE-negative STEC strains analyzed in this study. The maximum parsimony phylogenetic tree (midpoint rooted) is based on 3,956 core SNPs identified in 367 complete or draft genomic sequences of LEE-negative STEC and E. coli K-12 MG1655. The tree was built using kSNP3.1 [Citation39] and further processed with the Interactive Tree of Life tool [Citation77]. Sequence clusters (SC; SC1 to SC7) are indicated in the outer colored ring, which are further divided into 31 lineages (inner ring). Clinically important serotypes are shown. In general, lineages contain strains belonging to a specific serotype. In the lineage 16, branches corresponding to O113:H21 serotype are delineate with a dotted line.
![Figure 5. Phylogenetic relationships and population structure of LEE-negative STEC strains analyzed in this study. The maximum parsimony phylogenetic tree (midpoint rooted) is based on 3,956 core SNPs identified in 367 complete or draft genomic sequences of LEE-negative STEC and E. coli K-12 MG1655. The tree was built using kSNP3.1 [Citation39] and further processed with the Interactive Tree of Life tool [Citation77]. Sequence clusters (SC; SC1 to SC7) are indicated in the outer colored ring, which are further divided into 31 lineages (inner ring). Clinically important serotypes are shown. In general, lineages contain strains belonging to a specific serotype. In the lineage 16, branches corresponding to O113:H21 serotype are delineate with a dotted line.](/cms/asset/cbb616c7-3caa-4305-b381-de5300c209f6/temi_a_1595985_f0005_oc.jpg)
It has been reported that among LEE-positive STEC strains from different lineages may differ in their virulence potential [Citation20,Citation66,Citation67]. Moreover, it has been suggested that hypervirulent lineages containing different arrays of virulence genes correlate with the incidence and severity of diseases associated with STEC [Citation68,Citation69]. Furthermore, the cumulative acquisition of PAIs in LEE-positive STEC strains has been correlated with an increased ability to cause severe disease in humans, suggesting an additive or synergistic effect [Citation17]. Therefore, we hypothesize that genome plasticity may also play an important role in the appearance of LEE-negative STEC lineages with an increased virulence potential. Thus, we attempted to determine whether there are lineages with greater virulence potential among LEE-negative STEC, and, if so, their geographical distribution. With this aim, we mapped the distribution of virulence determinants and epidemiological data onto the maximum parsimony tree. For better visualization and understanding, we focused this analysis on clinically relevant serotypes (O91:H14, O91:H21, O113:H21, O128:H8, O146:H21 and O174:H21) (). Notably, we found concordance between the phylogeny and the virulence repertories, and, in some cases, with the geographical distribution.
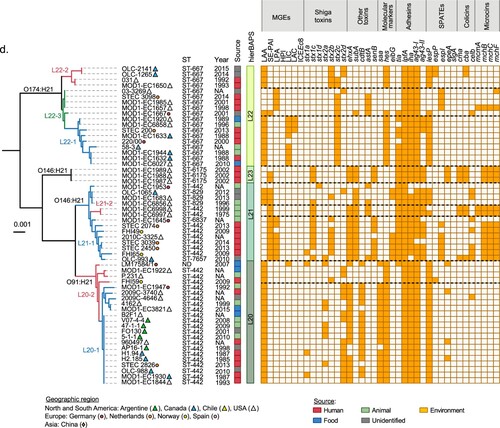
Figure 6. Phylogenetic relationships between LEE-negative STEC strains belonging to serotypes associated with human disease. Clusters corresponding to serotypes O48:H21, O116:H21, O113:H21 (a), O128:H8 (b), O91:H14 (c), O174:H21, O146:H21 and O91:H21 (d) were extracted from the maximum parsimony tree constructed with 3,956 core SNPs shown in . Lineages and sub-lineages were determined using RhierBAPs [Citation41]. Sub-lineages are indicated by colors in the branches of the tree. Distribution of virulence determinants are shown in the right panel. The presence or absence of each Mobile Genetic Element (MGE) or gene is indicated by orange or white squares, respectively. Epidemiologic data of each strain, including country, year and source of isolation is shown (see legend).
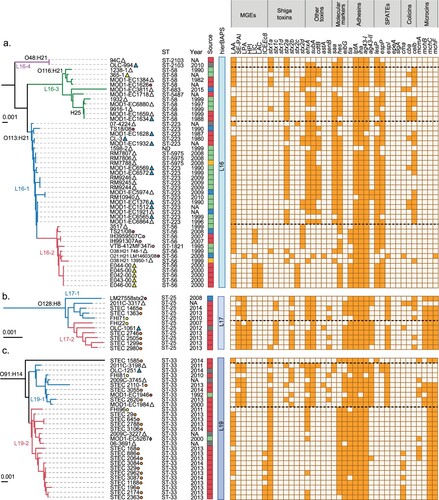
For example, O113:H21 serotype (lineage 16) was separated into two sub-lineages ((a)); sub-lineage 16–1 included twenty-one strains from North America, nineteen O113:H21 and two non-typeable strains. In addition, sub-lineage 16–2 include strains from North and South America (8/13) and Europe (5/13). Sub-lineage 16–2 also included two O38:H21 strains and one O21:H21 strain, suggesting that these strains emerged from an O113:H21 sub-lineage 16–2 ancestor (Table S1). Most of the O113:H21 strains harbor LAA. Several strains from sub-lineage 16–2 also harbor LIC (9/13) and LAC (5/13). Regarding toxin gene profiles, strains from sub-lineage 16–1 were positive for stx2a (17/21), stx2d (4/21), ehxA (19/21) and subAB (20/21), while those from sub-lineage 16–2 were positive for stx2c (5/13), stx2d (5/13), two strains for stx2a one of which harbors an additional stx1a and one strain harboring stx2b.
The lineage 17 was associated with eleven strains, all belonging to the O128:H8 serotype, and separated into two sub-lineages ((b)). In both sub-lineages, 17-1(5/11) and 17–2 (6/11), the majority of strains were from Europe with one North American strain present in each group. Strains from sub-lineage 17–1 harbor SE-PAI (3/5) and LPA (5/5); most of the strains from sub-lineage 17–2 harbor these PAIs, but they also include HPI (6/6). With the exception of one strain (in 10 of 11) the mhc cluster was present. Other virulence genes were differentially distributed, stx1c was present in all 17–2 strains and in two 17–1 sub-lineages. Moreover, stx2b was associated with 5/6 strains in 17–2 and 4/5 strains in 17-1(Table S1). Regarding ehxA and subA both were present in almost all strains of the lineage 17, with only one strain not harboring subA and two strains not harboring ehxA.
In 2013 and 2014, O91:H14 was the most prevalent STEC serotype in a prospective multicenter study conducted in the Netherlands [Citation11]. Most of the O91:H14 strains here analyzed were isolated as part of that study. Twenty-nine strains of this serotype were clustered into lineage 19, which was divided in three sub-lineages ((c)). Sub-lineage 19–1 grouped nine strains from North America and Europe while sub-lineage 19–2 contained nineteen strains predominantly from the Netherlands (15/19). Sub-lineage 19–3 includes a single strain. SE-PAI (7/9) and LPA (8/9) were present only in sub-lineage 19–1 and absent in 19–2 and 19-3. However, in sub-lineage 19-2, LAA and ICEEc8 were observed in 16/19 and 7/19 strains, respectively. In addition, the dominant toxin genotypes of the sub-lineage 19–1 were stx1a (7/9), stx2b (5/9) and stx2a (3/9) and stx2d (1/9) were less detected. Meanwhile, stx1a was present in all strains associated with sub-lineages 19-2-and 19-3. Other virulence genes like ehxA and subAB were detected in 7/9 and 9/9 strains, respectively, in sub-lineage 19-1, while ehxA was less prevalent in 19–2 (9/19) and absent in 19-3; the subAB gene was absent in both 19–2 and 19–3 sub-lineages. The mch cluster was detected in all strains associated with 19–2 and 19–3 (20/20) and in 4/9 in the 19–1 sub-lineage. These results showed that the mutual exclusivity between LAA and SE-PAI/LPA may occur regardless of the serotype with the exception of five strains, one serogroup O2, three O146:H21 and one O174:H21, belonging to the linages L8, L21 and L22, respectively.
Similarly, the O174:H21 serotype (eighteen strains belonging to Lineage 22) was divided into three sub-lineages ((d)). Sub-lineage 22–1 (9/18) grouped strains from North and South America and Europe while strains included in sub-lineages 22–2 (4/18) and 22–3 (5/18) were mainly from North America. Strains from sub-lineage 22–1 harbored LAA (9/9), LIC (8/9), LAC (3/9) and stx2c (9/9); those from sub-lineage 22–2 harbored LAA (4/4), stx2b (4/4), stx2c (2/4), and stx2d (2/4); finally, sub-lineage 22–3 harbored LPA (4/5), LAA and SE-PAI (1/5, both PAIs in the same strain), stx2c (4/5), stx2d (1/5) and astA (4/5).
The O146:H21 serotype was clustered into two lineages (L23 with three strains and L21 with fourteen strains; (d)). Lineage 23 grouped strains from the USA. Lineage 21 was divided into two sub-lineages, L21-1, which grouped most of the strains (12/14), from North America and Europe and L21-2 from the USA (2/14). The genes stx1c, ehxA, subA and senB were detected in all lineage 23 strains; SE-PAI (2/3) was detected in lineage 23; SE-PAI, LPA, stx1c, stx2b, ehxA, subA and senB were heterogeneously detected in sub-lineage 21-1; and SE-PAI, stx1c, ehxA, subAB and astA were detected in both strains from sub-lineage 21-2. Interestingly, as mentioned above, sub-lineage L21-1 included 3 of the 4 strains in which LAA and SE-PAI ((a)) were detected together. Furthermore, the mch cluster was frequently detected in this serotype.
The O91:H21 serotype (lineage 20) was separated into two sub-lineages ((d)) and both of which included strains from America and Europe. In contrast to the O174:H21 and O146:H21 serotypes, all but one O91:H21 strains (LM17584/1, an LIC-positive strain from Germany) were from Germany, the presence of multiple PAIs was not observed. All O91:H21 strains harbored LAA and frequently the stx2d (15/22), ehxA (17/22) and cdtB (14/22) toxin genes.
Genome size analysis
Bacteria show substantial variations in genome size, a feature that may be linked to their lifestyle. For instance, in some bacterial pathogens there is a tendency for a narrow host range and increased pathogenicity to be associated with a reduction in genome size (reductive genome evolution) [Citation70]. Therefore, to gain further insights into the evolution of LEE-negative STEC virulence, we examined variation in genome sizes among these strains and other E. coli pathotypes (Table S10). The average genome size of LEE-negative STEC strains (5.18, range 4.715.74 Mb) was significantly (p < 0.0001) smaller than the average of recognized human pathogens like LEE-positive STEC strains (5.37, range 4.53–5.94 Mb), but similar to typical enteropathogenic E. coli (tEPEC) (5.11, range 4.51–5.52 Mb) and enteroinvasive E. coli (EIEC) (5.06, range 4.8–5.39 Mb) strains (Figure S3a, File S4). Furthermore, an interesting finding was that genomes from human-associated LEE-negative STEC strains were significantly (p = 0.0052) larger (average 5.21 Mb, range 4.75–5.74 Mb) compared to those isolated from bovines (average 5.11 Mb, range 4.85–5.42 Mb), with genomes larger than 5.2 Mb almost exclusively corresponding to human isolates (Figure S3b, File S5). These observations might reflect a higher degree of adaptability in LEE-negative STEC strains that are both capable of infecting humans and colonizing their animal reservoir.
Discussion
Using a combination of in silico analyses, taking advantage of the increasing data provided by massive sequencing, and experimental assays, this study provides new information regarding the evolution of virulence of LEE-negative STEC strains.
Stx is the main virulence factor of STEC; specifically, Stx1a, Stx2a and Stx2d subtypes are associated with severe disease [Citation5]; nevertheless, none of these subtypes was prevalent in human strains compared to animal isolates (). Therefore, identification of the Stx subtype alone does not seem sufficient to predict the virulence potential of these strains. Previous studies agree with this finding [Citation17].
While the varying configurations of virulence genes and genome sizes among LEE-negative STEC strains make it difficult to assess the virulence potential of a given strain, we found that genes such as hes, one of the most prevalent in LEE-negative STEC [Citation10], may complement existing molecular risk evaluation schemes [Citation71].
Additionally, we report the identification of three new MGEs that are distributed in different LEE-negative STEC strains. Among these, LIC and LAC PAIs contain the tia gene (), an enterotoxigenic E. coli virulence factor [Citation72] that has been previously associated with the presence of SE-PAI [Citation9]. Thus, the report of two new PAIs also containing this gene is indicative that it has spread to and within STEC strains, rendering another example of a horizontal transfer event within E. coli pathotypes [Citation73]. Other genes located in these PAIs, such as those encoding CDI systems, could provide competitive advantages against other bacteria. During the review of the present manuscript, Saile et al. [Citation74] reported the identification of several genetic elements with characteristics of PAIs in a number of LEE-negative STEC strains. Among the genetic sequences reported in that study are LIC and partially LAC.
On the other hand, the identification of ICEEc8 containing sigA is an important finding (), as SigA participates in infant rabbit intestinal colonization by the STEC/EAEC O104:H4 strain that caused the 2011 HUS outbreak in Europe [Citation59]. It is noteworthy that a recent study reported the identification of the sigA gene in 36 STEC O117:H7 strains isolated in the United Kingdom [Citation75], suggesting that they harbor ICEEc8. Thus, it is important for future studies to address the functional characterization of this novel MGE.
This is the first large-scale study showing the accumulation and diverse distribution of GIs among LEE-negative STEC strains. Thus, together with plasmids and bacteriophages, PAIs and ICEs may play important roles in the evolution of the virulence of these pathogens. Including the results of this report, six PAIs and one ICE have been shown to be harbored by LEE-negative STEC; however, it is likely that there are more MGEs yet to be identified (Figure S4).
It is worth highlighting that LAA was the most prevalent PAI among the strains (). In addition, our results suggest that LAA contributes to the intestinal colonization in streptomycin-treated mice, but its participation in virulence could not be statistically demonstrated, although a mild attenuation of the strain could be observed ((c)). Thus, we consider that LAA's functionality deserves a more detailed investigation. Future studies, using reduced inoculums or determining the LD50, might complement these results and provide further information on the role of LAA in virulence in this model. In addition, the association of LAA with toxin genes that cause severe disease, such as stx1a, stx2a, stx2d and cdtB ((b)) could be useful in STEC surveillance.
Perhaps even more important is the epidemiologic and genomic evidence supporting the notion that there are LEE-negative STEC subpopulations that are globally distributed. Specifically, phylogenetic analyses revealed that serotypes O91:H14, O91:H21, O113:H21, O128:H8, O146:H21 and O174:H21 have sub-lineages with higher virulence potential, principally related to the Stx subtype and the number of PAIs they harbor ().
On the other hand, we identified that there is considerable variability in the genome size of LEE-negative STEC strains, as much as 1 Mb, and a tendency for larger genomes among human strains compared to those isolated from bovines. In other words, LEE-negative STEC strains harbor the repertoires of genes that allow them to live in the bovine reservoir while large genomes could reflect the gain of genes, PAIs, ICEs, plasmids and bacteriophages by which they are able to infect humans. This hypothesis could be examined in future studies with a more significant number of fully-sequenced (closed) genomes and epidemiological data.
In conclusion, the results described here support our hypothesis as to the role of PAIs play in the emergence of LEE-negative STEC strains. Therefore, this study further adds to our knowledge on the potential pathogenic mechanisms of LEE-negative STEC and lays down a base line for their epidemiological surveillance.
Supplemental Material
Download Zip (1.6 MB)Acknowledgments
We thank Dr. Carlos Smith and Anne Lagomarcino for their careful review and edition of the manuscript and helpful discussions.
Disclosure statement
No potential conflict of interest was reported by the authors.
Additional information
Funding
Related Research Data
References
- Nataro JP, Kaper JB. Diarrheagenic Escherichia coli. Clin Microbiol Rev. 1998;11:142–201. doi: 10.1128/CMR.11.1.142
- Karch H, Denamur E, Dobrindt U, et al. The enemy within us: lessons from the 2011 European Escherichia coli O104:H4 outbreak. EMBO Mol Med. 2012;4:841–848. doi: 10.1002/emmm.201201662
- Betzen C, Plotnicki K, Fathalizadeh F, et al. Shiga toxin 2a–induced endothelial injury in hemolytic uremic syndrome: A metabolomic analysis. J Infect Dis. 2016;213:1031–1040. doi: 10.1093/infdis/jiv540
- Scheutz F, Teel LD, Beutin L, et al. Multicenter evaluation of a sequence-based protocol for subtyping Shiga toxins and standardizing Stx nomenclature. J Clin Microbiol. 2012;50:2951–2963. doi: 10.1128/JCM.00860-12
- Food and Agriculture Organization of the United Nations (FAO) and World and Health Organization (WHO). Shiga toxin-producing Escherichia coli (STEC) and food: attribution, characterization, and monitoring. Roma, 2018.
- Farfan MJ, Torres AG, Andrews-Polymenis HL. Molecular mechanisms that mediate colonization of Shiga toxin-producing Escherichia coli strains. Infect Immun. 2012;80:903–913. doi: 10.1128/IAI.05907-11
- Steyert SR, Sahl JW, Fraser CM, et al. Comparative genomics and stx phage characterization of LEE-negative Shiga toxin-producing Escherichia coli. Front Cell Infect Microbiol. 2012;2:133. doi: 10.3389/fcimb.2012.00133
- Schmidt H, Zhang W-L, Hemmrich U, et al. Identification and characterization of a novel genomic island integrated at selC in Locus of Enterocyte Effacement-negative, Shiga toxin-producing Escherichia coli. Infect Immun. 2001;69:6863–6873. doi: 10.1128/IAI.69.11.6863-6873.2001
- Michelacci V, Tozzoli R, Caprioli A, et al. A new pathogenicity island carrying an allelic variant of the Subtilase cytotoxin is common among Shiga toxin producing Escherichia coli of human and ovine origin. Clin Microbiol Infect. 2013;19:E149–E156. doi: 10.1111/1469-0691.12122
- Montero DA, Velasco J, Del Canto F, et al. Locus of Adhesion and Autoaggregation (LAA), a pathogenicity island present in emerging Shiga toxin-producing Escherichia coli strains. Sci Rep. 2017;7:7011. doi: 10.1038/s41598-017-06999-y
- Ferdous M, Friedrich AW, Grundmann H, et al. Molecular characterization and phylogeny of Shiga toxin–producing Escherichia coli isolates obtained from two Dutch regions using whole genome sequencing. Clin Microbiol Infect. 2016;22:642.e1–642.e9. doi: 10.1016/j.cmi.2016.03.028
- Franz E, van Hoek AHAM, Wuite M, et al. Molecular hazard identification of non-O157 Shiga toxin-producing Escherichia coli (STEC). PLoS One. 2015;10:e0120353. doi: 10.1371/journal.pone.0120353
- Cundon C, Marey E, Roldan F, et al. Preliminary detection and characterization of Escherichia coli O174 Shiga toxin-producing. Senasa. 2015;8:52–63.
- Lee JB, Han D, Lee HT, et al. Pathogenic and phylogenetic characteristics of non-O157 Shiga toxin-producing Escherichia coli isolates from retail meats in South Korea. J Vet Sci. 2018;19:251. doi: 10.4142/jvs.2018.19.2.251
- Nüesch-Inderbinen M, Morach M, Cernela N, et al. Serotypes and virulence profiles of Shiga toxin-producing Escherichia coli strains isolated during 2017 from human infections in Switzerland. Int J Med Microbiol. 2018;308:933–939. doi: 10.1016/j.ijmm.2018.06.011
- Bettelheim KA. The non-O157 Shiga-toxigenic (verocytotoxigenic) Escherichia coli; under-rated pathogens. Crit Rev Microbiol. 2007;33:67–87. doi: 10.1080/10408410601172172
- Coombes BK, Wickham ME, Mascarenhas M, et al. Molecular analysis as an aid to assess the public health risk of non-O157 shiga toxin-producing Escherichia coli strains. Appl Environ Microbiol. 2008;74:2153–2160. doi: 10.1128/AEM.02566-07
- Hazen TH, Kaper JB, Nataro JP, et al. Comparative genomics provides insight into the diversity of the attaching and effacing Escherichia coli virulence plasmids. Infect Immun. 2015;83:4103–4117. doi: 10.1128/IAI.00769-15
- Pielaat A, Boer MP, Wijnands LM, et al. First step in using molecular data for microbial food safety risk assessment; hazard identification of Escherichia coli O157: H7 by coupling genomic data with in vitro adherence to human epithelial cells. Int J Food Microbiol. 2015;213:130–138. doi: 10.1016/j.ijfoodmicro.2015.04.009
- Manning SD, Motiwala AS, Springman AC, et al. Variation in virulence among clades of Escherichia coli O157:H7 associated with disease outbreaks. Proc Natl Acad Sci. 2008;105:4868–4873. doi: 10.1073/pnas.0710834105
- Etcheverría AI, Padola NL. Shiga toxin-producing Escherichia coli: factors involved in virulence and cattle colonization. Virulence. 2013;4:366–372. doi: 10.4161/viru.24642
- Montero D, Orellana P, Gutiérrez D, et al. Immunoproteomic analysis to identify Shiga toxin-producing Escherichia coli outer membrane proteins expressed during human infection. Infect Immun. 2014;82:4767–4777. doi: 10.1128/IAI.02030-14
- Bankevich A, Nurk S, Antipov D, et al. SPAdes: a new genome assembly algorithm and its applications to single-cell sequencing. J Comput Biol. 2012;19:455–477. doi: 10.1089/cmb.2012.0021
- Gurevich A, Saveliev V, Vyahhi N, et al. QUAST: quality assessment tool for genome assemblies. Bioinformatics. 2013;29:1072–1075. doi: 10.1093/bioinformatics/btt086
- Joensen KG, Tetzschner AMM, Iguchi A, et al. Rapid and easy In silico serotyping of Escherichia coli isolates by use of whole-genome sequencing data. J Clin Microbiol. 2015;53:2410–2426. doi: 10.1128/JCM.00008-15
- Joensen KG, Scheutz F, Lund O, et al. Real-time whole-genome sequencing for routine typing, surveillance, and outbreak detection of verotoxigenic Escherichia coli. J Clin Microbiol. 2014;52:1501–1510. doi: 10.1128/JCM.03617-13
- van der Woude MW, Henderson IR. Regulation and function of Ag43 (flu). Annu Rev Microbiol. 2008;62:153–169. doi: 10.1146/annurev.micro.62.081307.162938
- Kurtz S, Choudhuri JV, Ohlebusch E, et al. REPuter: the manifold applications of repeat analysis on a genomic scale. Nucleic Acids Res. 2001;29:4633–4642. doi: 10.1093/nar/29.22.4633
- Siguier P, Perochon J, Lestrade L, et al. ISfinder: the reference centre for bacterial insertion sequences. Nucleic Acids Res. 2006;34:D32–D36. doi: 10.1093/nar/gkj014
- Lowe TM, Eddy SR. TRNAscan-SE: A program for improved detection of transfer RNA genes in genomic sequence. Nucleic Acids Res. 1997;25:955–964. doi: 10.1093/nar/25.5.955
- Aziz RK, Bartels D, Best A, et al. The RAST Server: rapid annotations using subsystems technology. BMC Genomics. 2008;9:1–15. doi: 10.1186/1471-2164-9-75
- Hudson CM, Lau BY, Williams KP. Islander: a database of precisely mapped genomic islands in tRNA and tmRNA genes. Nucleic Acids Res. 2015;43:D48–D53. doi: 10.1093/nar/gku1072
- Yoon SH, Park YK, Kim JF. PAIDB v2.0: Exploration and analysis of pathogenicity and resistance islands. Nucleic Acids Res. 2015;43:D624–D630. doi: 10.1093/nar/gku985
- Csardi G. R Package ‘igraph’. 2015.
- R Core Team. R: A Language and Environment for Statistical Computing. R Foundation for Statistical Computing. Vienna, Austria, 2014.
- Darling AE, Mau B, Perna NT. Progressivemauve: multiple genome alignment with gene gain, loss and rearrangement. PLoS One. 2010;5:e11147. doi: 10.1371/journal.pone.0011147
- Datsenko KA, Wanner BL. One-step inactivation of chromosomal genes in Escherichia coli K-12 using PCR products. Proc Natl Acad Sci U S A. 2000;97:6640–6645. doi: 10.1073/pnas.120163297
- Lindgren SW, Melton AR, O’Brien AD. Virulence of enterohemorrhagic Escherichia coli O91:H21 clinical isolates in an orally infected mouse model. Infect Immun. 1993;61:3832–3842.
- Gardner SN, Slezak T, Hall BG. kSNP3.0: SNP detection and phylogenetic analysis of genomes without genome alignment or reference genome. Bioinformatics. 2015;31:2877–2878. doi: 10.1093/bioinformatics/btv271
- Letunic I, Bork P. Interactive tree of life (iTOL) v3: an online tool for the display and annotation of phylogenetic and other trees. Nucleic Acids Res. 2016;44:W242–W245. doi: 10.1093/nar/gkw290
- Tonkin-Hill G, Lees JA, Bentley SD, et al. RhierBAPS: An R implementation of the population clustering algorithm hierBAPS. Wellcome Open Res. 2018;3:93. doi: 10.12688/wellcomeopenres.14694.1
- Beghain J, Bridier-Nahmias A, Le Nagard H, et al. Clermontyping: an easy-to-use and accurate in silico method for Escherichia genus strain phylotyping. Microb Genom. 2018;4:1–8.
- Wirth T, Falush D, Lan R, et al. Sex and virulence in Escherichia coli: an evolutionary perspective. Mol Microbiol. 2006;60:1136–1151. doi: 10.1111/j.1365-2958.2006.05172.x
- Larsen MV, Cosentino S, Rasmussen S, et al. Multilocus sequence typing of total-genome-sequenced bacteria. J Clin Microbiol. 2012;50:1355–1361. doi: 10.1128/JCM.06094-11
- Galli L, Miliwebsky E, Irino K, et al. Virulence profile comparison between LEE-negative Shiga toxin-producing Escherichia coli (STEC) strains isolated from cattle and humans. Vet Microbiol. 2010;143:307–313. doi: 10.1016/j.vetmic.2009.11.028
- Johnson KE, Thorpe CM, Sears CL. The emerging clinical importance of non-O157 Shiga toxin-producing Escherichia coli. Clin Infect Dis. 2006;43:1587–1595. doi: 10.1086/509573
- Beutin L, Krause G, Zimmermann S, et al. Characterisation of Shiga toxin-producing Escherichia coli strains isolated from human patients in Germany over a 3-year period. J Clin Microbiol. 2004;42:1099–1108. doi: 10.1128/JCM.42.3.1099-1108.2004
- Budič M, Rijavec M, Petkovšek Ž, et al. Escherichia coli bacteriocins: antimicrobial efficacy and prevalence among isolates from patients with bacteraemia. PLoS One. 2011;6:e28769. doi: 10.1371/journal.pone.0028769
- Gal-Mor O, Finlay BB. Pathogenicity islands: a molecular toolbox for bacterial virulence. Cell Microbiol. 2006;8:1707–1719. doi: 10.1111/j.1462-5822.2006.00794.x
- Karch H, Schubert S, Zhang D, et al. A genomic island, termed high-pathogenicity island, is present in certain non-O157 Shiga toxin-producing Escherichia coli clonal lineages. Infect Immun. 1999;67:5994–6001.
- Bondì R, Chiani P, Michelacci V, et al. The gene tia, harbored by the subtilase-encoding Pathogenicity Island, is involved in the ability of locus of enterocyte effacement-negative Shiga toxin-producing Escherichia coli strains to invade monolayers of epithelial cells. Infect Immun. 2017;85:e00613-17. doi: 10.1128/IAI.00613-17
- Ruhe ZC, Low DA, Hayes CS. Bacterial contact-dependent growth inhibition. Trends Microbiol. 2013;21:230–237. doi: 10.1016/j.tim.2013.02.003
- Aoki SK, Pamma R, Hernday AD, et al. Contact-dependent inhibition of growth in Escherichia coli. Science. 2005;309:1245–1248. doi: 10.1126/science.1115109
- de Been M, Lanza VF, de Toro M, et al. Dissemination of cephalosporin resistance genes between Escherichia coli strains from farm animals and humans by specific plasmid lineages. PLoS Genet. 2014;10:e1004776. doi: 10.1371/journal.pgen.1004776
- Martinez-Jéhanne V, Pichon C, du Merle L, et al. Role of the vpe carbohydrate permease in Escherichia coli urovirulence and fitness in vivo. Infect Immun. 2012;80:2655–2666. doi: 10.1128/IAI.00457-12
- Martinez-Jéhanne V, du Merle L, Bernier-Fébreau C, et al. Role of deoxyribose catabolism in colonization of the murine intestine by pathogenic Escherichia coli strains. Infect Immun. 2009;77:1442–1450. doi: 10.1128/IAI.01039-08
- Perna NT, Glasner JD, Burland V, et al. The genomes of Escherichia coli K-12 and pathogenic E. coli. In: Donnenberg MS, editor. Escherichia coli. San Diego: Academic Press; 2002. p. 3–53.
- Al-Hasani K, Henderson IR, Sakellaris H, et al. The sigA gene which is borne on the she pathogenicity island of Shigella flexneri 2a encodes an exported cytopathic protease involved in intestinal fluid accumulation. Infect Immun. 2000;68:2457–2463. doi: 10.1128/IAI.68.5.2457-2463.2000
- Munera D, Ritchie JM, Hatzios SK, et al. Autotransporters but not pAA are critical for rabbit colonization by Shiga toxin-producing Escherichia coli O104:H4. Nat Commun. 2014;5:3080. doi: 10.1038/ncomms4080
- Johnson CM, Grossman AD. Integrative and Conjugative Elements (ICEs): what they do and how they work. Annu Rev Genet. 2015;49:577–601. doi: 10.1146/annurev-genet-112414-055018
- Bi D, Xu Z, Harrison EM, et al. ICEberg: a web-based resource for integrative and conjugative elements found in bacteria. Nucleic Acids Res. 2012;40:D621–D626. doi: 10.1093/nar/gkr846
- Burrus V, Pavlovic G, Decaris B, et al. Conjugative transposons: the tip of the iceberg. Mol Microbiol. 2002;46:601–610. doi: 10.1046/j.1365-2958.2002.03191.x
- Ulett GC, Webb RI, Schembri MA. Antigen-43-mediated autoaggregation impairs motility in Escherichia coli. Microbiology. 2006;152:2101–2110. doi: 10.1099/mic.0.28607-0
- Wu XB, Tian LH, Zou HJ, et al. Outer membrane protein OmpW of Escherichia coli is required for resistance to phagocytosis. Res Microbiol. 2013;164:848–855. doi: 10.1016/j.resmic.2013.06.008
- Melton-Celsa AR, Rogers JE, Schmitt CK, et al. Virulence of Shiga toxin-producing Escherichia coli (STEC) in orally-infected mice correlates with the type of toxin produced by the infecting strain. Jpn J Med Sci Biol. 1998;51(Suppl.):S108–S114. doi: 10.7883/yoken1952.51.Supplement1_S108
- Ogura Y, Gotoh Y, Itoh T, et al. Population structure of Escherichia coli O26: H11 with recent and repeated stx2 acquisition in multiple lineages. Microb Genom. 2017;3. doi:10.1099/mgen.0.000141.
- Ishijima N, Lee K-I, Kuwahara T, et al. Identification of a new virulent clade in enterohemorrhagic Escherichia coli O26:H11/H- sequence type 29. Sci Rep. 2017;7:43136. doi: 10.1038/srep43136
- Mellor GE, Sim EM, Barlow RS, et al. Phylogenetically related Argentinean and Australian Escherichia coli O157 isolates are distinguished by virulence clades and alternative Shiga toxin 1 and 2 prophages. Appl Environ Microbiol. 2012;78:4724–4731. doi: 10.1128/AEM.00365-12
- Zweifel C, Cernela N, Stephan R. Detection of the emerging Shiga toxin-producing Escherichia coli O26: H11/H- sequence type 29 (ST29) clone in human patients and healthy cattle in Switzerland. Appl Environ Microbiol. 2013;79:5411–5413. doi: 10.1128/AEM.01728-13
- Weinert LA, Welch JJ. Why might bacterial pathogens have small genomes? Trends Ecol Evol. 2017;32:936–947. doi: 10.1016/j.tree.2017.09.006
- Beutin L, Miko A, Krause G, et al. Identification of human-pathogenic strains of Shiga toxin-producing Escherichia coli from food by a combination of serotyping and molecular typing of Shiga toxin genes. Appl Environ Microbiol. 2007;73:4769–4775. doi: 10.1128/AEM.00873-07
- Fleckenstein JM, Kopecko DJ, Warren RL, et al. Molecular characterization of the tia invasion locus from enterotoxigenic Escherichia coli. Infect Immun. 1996;64:2256–2265.
- Hazen TH, Michalski J, Luo Q, et al. Comparative genomics and transcriptomics of Escherichia coli isolates carrying virulence factors of both enteropathogenic and enterotoxigenic E. coli. Sci Rep. 2017;7:3513. doi: 10.1038/s41598-017-03489-z
- Saile N, Schuh E, Semmler T, et al. Determination of virulence and fitness genes associated with the pheU, pheV and selC integration sites of LEE-negative food-borne Shiga toxin-producing Escherichia coli strains. Gut Pathog. 2018;10:43. doi: 10.1186/s13099-018-0271-8
- Baker KS, Dallman TJ, Thomson NR, et al. An outbreak of a rare Shiga-toxin-producing Escherichia coli serotype (O117:H7) among men who have sex with men. Microb Genom. 2018;4:1–9.
- Wei T, Simko V, Levy M, et al. Package ‘corrplot’. R Dev Core Team 2017;18.
- Letunic I, Bork P. Interactive tree of life v2: online annotation and display of phylogenetic trees made easy. Nucleic Acids Res. 2011;39:W475–W478. doi: 10.1093/nar/gkr201