
ABSTRACT
Echinocandin resistance in Candida glabrata poses a serious clinical challenge. The underlying resistance mechanism of a pan-echinocandin-resistant C. glabrata isolate (strain L74) was investigated in this study. FKS mutants carrying specific mutations found in L74 were reconstructed by the Alt-R CRISPR-Cas9 system (Fks1 WT/Fks2-E655K, strain CRISPR 31) and site-directed mutagenesis (strain fks1Δ/Fks2-E655K). Sequence analysis of strain L74 revealed a premature stop codon W508stop in FKS1 and an E655K mutation preceding the hotspot 1 region in FKS2. Introduction of the Fks2-E655K mutation in ATCC 2001 (strain CRISPR 31) conferred a modest reduction in susceptibility. However, the same FKS2 mutation in the fks1Δ background (strain fks1Δ/Fks2-E655K) resulted in high levels of resistance to echinocandins. Glucan synthase isolated from L74 was dramatically less sensitive to micafungin (MCF) relative to ATCC 2001. Both FKS1/FKS2 transcript ratios and Fks1/Fks2 protein ratios were significantly lower in L74 and fks1Δ/Fks2-E655K compared to ATCC 2001 and CRISPR 31 (P <0.05). Mice challenged with CRISPR 31 and fks1Δ/Fks2-E655K mutants failed to respond to MCF. In conclusion, the high-level of echinocandin resistance in the clinical isolate of C. glabrata L74 was concluded to result from the combination of null function of Fks1 and the point mutation E655K in Fks2.
Introduction
Invasive candidiasis is an important health-care-associated fungal infection caused by Candida spp. [Citation1–3]. While Candida albicans is the most frequently reported Candida species, non-albicans Candida have an increasing role, particularly in high-risk populations, with Candida glabrata being one of the most prominent species [Citation1,Citation3,Citation4]. C. glabrata is of particular concern due to its high rate of azole resistance [Citation5]. Moreover, echinocandin resistance in C. glabrata has increased and posed a serious clinical challenge [Citation6,Citation7]. Most epidemiological prevalence studies report echinocandin resistance of 2–4% in C. glabrata [Citation7]. However, some institutional studies have reported higher rates, close to or over 10% [Citation6]. In China, C. glabrata echinocandin resistance is <1% [Citation8], and we previously reported the first case of invasive candidiasis in China due to a pan-echinocandin-resistant C. glabrata isolate. This clinical isolate showed very high MICs (≥ 8 µg/ml) to all three echinocandins: anidulafungin (ANF), caspofungin (CSF) and micafungin (MCF) [Citation9].
Clinical echinocandin resistance in C. glabrata is generally associated with amino acid substitutions in specific hotspot (HS) regions of FKS1 and FKS2, which encode the drug target β-1, 3-D-glucan synthase (GS) [Citation10]. However, partial FKS sequence analysis found that the high-level echinocandin resistant C. glabrata isolate mentioned above had no FKS HS mutations, but carried a single nucleotide mutation leading to a predicted E655 K alteration (3 amino acids upstream of the start of FKS2 HS1). In this study, we performed comprehensive analyses, both in vitro and in vivo, to assess the role of this novel mutation in the high-level echinocandin resistance observed in this particular clinical isolate of C. glabrata.
Materials and methods
Ethics statement
The study was approved by the Human Research Ethics Committee of Peking Union Medical College Hospital (No. S-263). In this study, involving human subjects, informed consent has been waived and approved by the institutional review board. Animal experiments were performed at the Public Health Research Institute’s Animal Biosafety Level-2 Research Animal Facility (ICPH RAF), a centre of the New Jersey Medical School, Rutgers University (NJMS-Rutgers). Our animal facility follows the Public Health Service and National Institute of Health Policy of Humane Care and Use of Laboratory Animals. All experimental protocols were approved by the Rutgers Institutional Animal Care and Use Committee (IACUC).
Strains, media, and drugs
C. glabrata strain ATCC 2001 and ATCC 200989 (2001 HTU) [Citation11] were obtained from the American Type Culture Collection (Manassas, VA). The clinical isolate L74 was obtained as described in previous report [Citation9], and the fks1Δ disruptant was a gift from Dr. Santosh Katiyar (Drexel University College of Medicine) [Citation12]. The medium was 1% yeast extract, 2% peptone, and 2% dextrose (YPD). ANF was obtained from Pfizer (New York, NY), CSF was obtained from Merck (Rahway, NJ), MCF was obtained from Astellas Pharma (Deerfield, IL), and FK506 was obtained from Tecoland (Edison, NJ). PCR primers were purchased from Integrated DNA Technologies (Coralville, IA).
FKS genes sequencing
The entire DNA coding sequences of FKS1 (5592 bp) and FKS2 (5694 bp) were amplified and determined, using primers listed in Supplementary Table 1. Amplicons were purified by using a ZR DNA sequencing cleanup kit (Zymo Research, Irvine, CA, USA) and sequenced by Genewiz (South Plainfield, NJ, USA). Sequencing results were analyzed by SeqMan Pro (version 14) software (Lasergene, DNAStar). The nucleotide sequences of FKS1 and FKS2 were aligned and compared with the reference wild-type (WT) sequences of C. glabrata ATCC 90030 FKS1 (GenBank accession numbers: HM366440.1) and FKS2 (GenBank accession numbers: HM366442.1), respectively.
Antifungal susceptibility tests
Antifungal susceptibility testing was performed according to CLSI guidelines [Citation13] and in complete synthetically defined (SD) medium (Sunrise Science Products) to compensate for auxotrophies, as described previously [Citation12]. Serial two-fold dilutions of FK506 ranging from 0.25 to 64 µg/ml were added to cultures prior to aliquoting to the 96-well plates to test the susceptibility.
Construction of C. glabrata fks2 mutants
C. glabrata strain ATCC 2001 with a single mutation E655 K in Fks2 was constructed by the Alt-R CRISPR-Cas9 system (Integrated DNA Technologies, Inc.) [Citation14]. All oligonucleotides used are listed in Table S1. Transformations were performed by electroporation of competent cells prepared using lithium acetate (LiAc) [Citation15]. Electroporation was performed using an 0.2 cm electroporation cuvette and electroporated with a manual 1.8 pulse (Bio-Rad MicroPulser), as described previously [Citation14]. Another E655 K mutant in the fks1Δ background was constructed by transforming with a PCR-amplified FKS2 fragment harbouring Fks2-E655K point mutation. Transformants were selected on 0.5 µg/ml CSF YPD plate and validated by PCR for correct insertion. FKS1 and FKS2 were subsequently sequenced to ensure the absence of any off-target mutations.
Measurement of inhibition of glucan synthase by MCF
All isolates used in this work were grown with vigorous shaking at 37°C to early stationary phase in YPD broth, and cells were collected by centrifugation. Cell disruption, membrane protein extraction, and partial GS purification by-product entrapment were performed, as described previously [Citation16]. Sensitivity to MCF was measured in a polymerization assay, using a 96-well multiscreen high-throughput screen filtration system (Millipore corporation, Bedford, MA) with a final volume of 100 µl [Citation16]. Serial dilutions of MCF (0.01–10,000 ng/ml) were used to determine 50% inhibitory concentration (IC50) values. The reactions were initiated by addition of the purified GS. Inhibition profiles and IC50 values were determined using a sigmoidal response (variable-slope) curve-fitting algorithm with GraphPad Prism 6.05 software (Prism Software, Irvine, CA). Each assay was repeated three times.
RNA extraction and quantitative real-time reverse-transcription (RT)-PCR
C. glabrata cells were grown in YPD broth to log phase and total RNA was extracted using the RNeasy Mini kit (QIAGEN Science, Maryland, USA) following the manufacturer’s instructions. The RNA was then treated with RNase-free DNase (Thermo Fisher Scientific, USA) according to the manufacturer’s recommendations. RNA samples were stored at −80°C. The expression levels of FKS1 and FKS2 were measured by RT–PCR, using One Step SYBR PrimeScript RT–PCR Kit II (TaKaRa, Shiga, Japan). Reactions were run on Mx3005P qPCR System (Agilent Technologies, CA, USA) containing 10 ng RNA sample, 0.4 μM of each primer (Table S1), 12.5 μl 2 × One Step SYBR RT–PCR Buffer, and 1 μl PrimeScript 1 step Enzyme Mix 2 in a volume of 25 μl. Thermal cycling conditions were as follows: RT at 42°C for 5 min; PCR cycling with initial denaturation at 95°C for 10 s, followed by 40 cycles of denaturation at 95°C for 5 s and annealing and elongation at 60°C for 20 s; a post PCR melting curve analysis with 95°C for 5 s, 60°C for 1 min then increasing to 95°C with a ramp rate of 0.5°C/s. Each experiment was carried out in triplicate and negative controls were included in each run. The RDN5.8 gene was used as reference gene to normalize the data [Citation17]. Comparative quantitation analyses were performed using the 2−ΔΔCT method [Citation18]. The fold changes were determined from the mean normalized expression of isolates relative to the mean normalized expression of ATCC 2001 FKS1.
Statistical analysis of gene expression was carried out using the student’s t test by SPSS software (version 12.0, SPSS Inc., Chicago, USA), and P value of <0.05 was considered significant.
Western blot
The GS was prepared with reducing buffer and Tris-Glycine SDS sample buffer (Thermo Fisher Scientific, USA), separated by electrophoresis (8% Tris-Glycine gel) (Thermo Fisher Scientific) and transferred to PVDF membrane. Fks1 and Fks2 proteins were detected with New Zealand rabbit polyclonal antibodies (GenScript, NJ, USA), which were raised against a 15 amino acid epitope in the N-terminus of each target protein and purified by SDS-PAGE, diluted 1:5000 in blocking buffer overnight at 4°C. Horseradish peroxidase-coupled donkey anti-rabbit IgG (1:3000 dilution, Cell Signaling Technology, Boston, MA, USA) was incubated for 1 h at 37°C followed by washing. The protein was revealed with Novex® ECL Chemiluminescent substrates (Thermo Fisher Scientific) per the manufacturer’s instructions. The densitometry of the blot was analyzed by Image J. Statistical analysis of gene expression was carried out using the student’s t test by SPSS software, and P value of <0.05 was considered significant.
In vivo MCF response assessment in a murine model of invasive candidiasis
A well-established neutropenic mouse model of disseminated candidiasis was used for this study [Citation19]. A total of 60 female eight-week-old BALB/c mice (Charles River Laboratories) were randomized into 12 different infection/antifungal therapy arms. The sample size of this animal experiment was considered adequate on the basis of the resource equation method [Citation20]. Mice were rendered neutropenic by receiving cyclophosphamide at 150 mg/kg on day −4 and 100 mg/kg on day −1 prior to infection, and day + 2 after infection via intraperitoneal (i.p.) injection. C. glabrata WT ATCC 2001, CRISPR 31 and fks1Δ/Fks2-E655 K were used in the study. The organisms were subcultured in YPD broth at 37°C with shaking overnight. Cells were collected by centrifugation, washed twice with sterile phosphate-buffered saline (PBS), and counted with a hemocytometer. The inoculum was adjusted to 4 × 10⁷ CFU/ml, and 50 µl was used to infect each mouse. The actual infection dose was verified by determination of viable counts on YPD plates spread with proper dilutions of the inoculum and incubated at 37°C for 24 h. On day 0, mice were infected with 2 × 10⁶ CFU of the respective C. glabrata strain via retro-orbital injection. At 2 h post inoculation, groups of 10 mice were given single or multiple daily treatment of vehicle (PBS) or MCF at 5 mg/kg via i.p. injection. Single dosed mice were sacrificed at 24 h post inoculation, and all mice receiving multiple doses of treatment were sacrificed at day 3 post inoculation, via CO2 inhalation and kidneys were aseptically removed for enumeration of the fungal burdens. All graphical data were expressed as scattered data points with means and standard deviations (bars) and were statistically analyzed by analysis of variance (ANOVA) using Prism computer software. The differences in the burdens between the test and the control groups were assessed by post hoc analyses, using Dunnett’s or Dunn’s multiple-comparison test (when group values did not fit a Gaussian distribution). A P value of <0.05 was considered statistically significant.
Results
Characterization of the echinocandin-resistant clinical isolate
The MICs for the clinical strain L74 were 16 µg/ml for CSF, 16 µg/ml for MCF and 8 µg/ml for ANF. The DNA sequence analysis of the complete open reading frame (ORF) of FKS1 revealed a non-synonymous mutation (G1524A), resulting in a premature stop codon (TGA; W508stop) predicted to truncate the 1863 amino acid-long Fks1 protein after the first 507 amino acids. The FKS2 sequence analysis confirmed the pre-HS mutation G1963A (E655 K) [Citation9].
Antifungal susceptibilities of mutant strains
The parent strains ATCC 2001, ATCC 200989, and fks1Δ disruptant were susceptible to all echinocandins (). The introduction of the point mutation G1963A in FKS2 (Fks2p E655 K; strain CRISPR 31) in WT strain ATCC 2001 using Alt-R CRISPR-Cas9 system resulted in a slight reduction of susceptibility to echinocandins (0.25 µg/ml, ), 32-64-fold lower than that observed for the clinical isolate L74. However, when the same mutation was introduced in the fks1Δ background (strain fks1Δ/ Fks2-E655K), a strong resistant phenotype (MICs ≥ 8 µg/ml, ) was observed, recapitulating that of the clinical isolate L74. As previously reported [Citation12], FKS1 disruption alone did not alter echinocandin susceptibility (). The calcineurin inhibitor FK506, which suppresses FKS2 expression [Citation12], did not inhibit the growth of strains ATCC 2001, ATCC 200989, and CRISPR-31, but it was highly active against strains in the fks1Δ or nonfunctional Fks1 protein (L74) background. The high levels of echinocandin resistance in strains fks1Δ /Fks2-E655 K and L74 were reversed by FK506 in vitro ().
Table 1. Echinocandin susceptibilities of C. glabrata wild-type and mutant strains, and reversal of Fks2-mediated echinocandin resistance by FK506.
Inhibition of glucan synthase (GS) activity by MCF
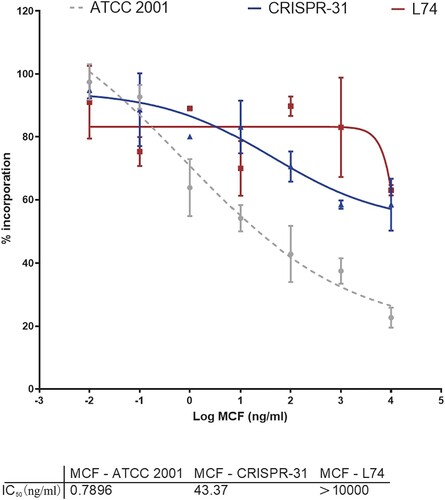
We assessed kinetic inhibition of GS activity by MCF by determining IC50 values for GS enzymes partially purified from strains ATCC 2001, CRISPR 31 and L74. GS extracted from the susceptible strain ATCC 2001 was sensitive to MCF (IC50 = 0.7896 ng/ml). The strain CRISPR 31 had increased IC50 (43.37 ng/ml) relative to the WT strain. The MCF IC50 (> 10,000 ng/ml) for the clinical resistant strain L74 harbouring FKS1 W508stop and FKS2 E655 K was dramatically higher than that for the WT or FKS2 E655 K strains (). Thus, the results of GS inhibition analysis were consistent with the high MICs.
Figure 1. Micafungin (MCF) inhibition profiles of trapped GS complexes from wild-type ATCC 2001 (grey circles), FKS2 E655 K mutant CRISPR 31 (blue triangles), and FKS1 W508stop and FKS2 E655 K clinical L74 (red squares) strains. The data are presented as the mean ± s.d.
Expression of FKS and abundance of GS
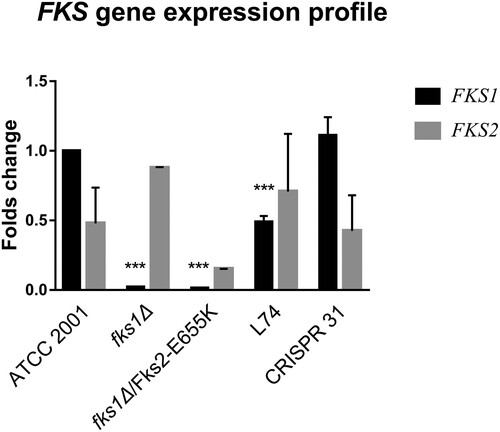
As shown in , at the transcript level FKS1 and FKS2 were expressed at a ∼ 2:1 ratio in strain ATCC 2001. Relative to ATCC 2001, FKS1 was barely expressed in fks1Δ strains, and its expression was significantly decreased (P < 0.01) in strain L74. FKS1 expression in CRISPR 31 was similar to that in ATCC 2001. FKS2 expression was not significantly different among the tested strains. As a result, the FKS1/FKS2 expression ratio was significantly lower in L74 and fks1Δ/ Fks2-E655 K than that in ATCC 2001 (P < 0.01). FKS1/FKS2 expression ratio similar to that of ATCC 2001 was detected in CRISPR 31.
Figure 2. Relative expression of FKS1 and FKS2 genes in C. glabrata mutants determined by RT–PCR. Statistical analysis was performed using Student’s t-test (*** P < 0.01). The data are presented as the mean ± s.d.
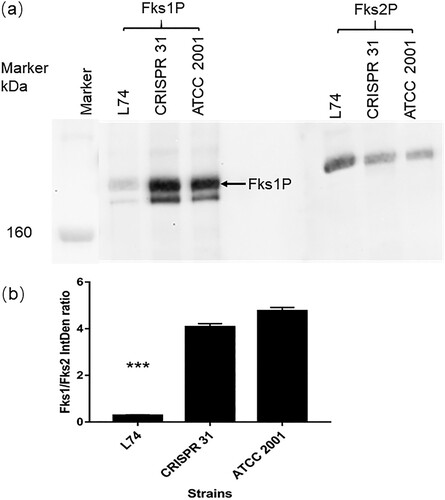
The relative protein abundance of Fks1 and Fks2 was determined for strains CRISPR 31, L74, and ATCC 2001 by Western blot analysis ((a)). The Fks2 antibody was highly specific with a single band detected at the target molecular weight site for all strains. In the Fks1 blot, an unspecific band with lower molecular weight than Fks1 was visualized for all strains, but it was not considered to have a directional bias on the Fks1/Fks2 ratio estimation, as the unspecific hybridization products appeared universally in all tested strains and proportional to the amount of Fks1. Of note, we did not observe any visible band at lower molecular weight deemed for the truncated Fks1 protein from the L74. The Fks1 blot of L74 had very faint “WT-like” protein bands (possibly due to non-specific binding with Fks2 protein), very similar to what we saw with the fks1Δ strain tested in another study (data not shown). Hence, protein expression ratio calculation was based on the band densities shown at WT Fks1 and Fks2 molecular weight for comparable convenience. The Fks1/Fks2 protein ratio was > 4 for ATCC 2001 and CRISPR 31, but it was completely reversed (< 0.3) in L74 (P < 0.01) ((b)).
Figure 3. Expression of Fks1 and Fks2 in ATCC 2001, CRISPR 31 and L74. (a) Immunoblot analysis of Fks1 and Fks2. (b) The densitometry of the blot was analyzed by Image J. Statistical analysis was performed using Student’s t-test (*** P < 0.01). The data are presented as the mean ± s.d.
In vivo response to MCF
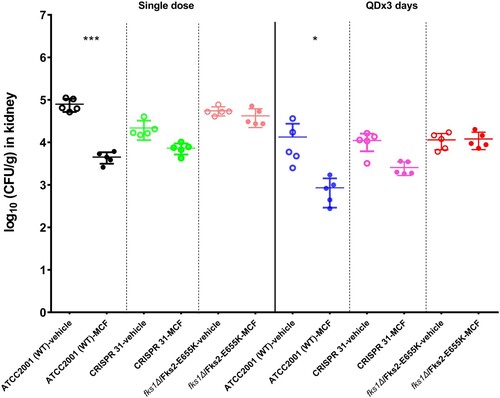
We compared kidney burdens of mice infected with E655 K mutants or WT strain and treated with MCF or vehicle control. After a single dose of MCF treatment, the WT strain infected mice had 1.3 log10 CFU/g kidney burden reduction relative to the control mice (P < 0.01). In comparison, the burden reduction was only 0.5 and 0.1 log10 CFU/g in mice infected with CRISPR 31 and fks1Δ/Fks2-E655 K, respectively, which was not significantly different from those infected with the same strain but treated with vehicle control (). Similar results were observed in mice which received 3 days treatment. An average of 1.2 log10 CFU/g kidney burden reduction was obtained in WT strain infected mice, as a result of three doses of MCF treatment compared to vehicle control. In contrast, MCF was not effective in treating mice infected with E655 K mutants, as kidney burdens relative to those treated with vehicle control were either slightly reduced (0.6 log10 CFU/g, P > 0.05) in CRISPR 31 infected mice or not decreased at all in fks1Δ/Fks2-E655 K infected mice.
Figure 4. Comparison of the kidney burdens among the different treatment groups of mice infected with C. glabrata FKS1 WT isolate (ATCC 2001), FKS2 E655 K CRISPR 31 and fks1Δ/Fks2-E655 K. Statistical analysis was performed using Dunnett’s or Dunn’s multiple-comparison test (*** P < 0.01 and * P < 0.05). The data are presented as the mean ± s.d.
Discussion
C. glabrata is the fourth most common Candida species detected in bloodstream isolates in China and the second or third in the United States, as well as in northern and eastern areas of Europe [Citation8,Citation21]. The propensity of C. glabrata to readily acquire resistance to major antifungal drug classes (azole and echinocandin) has been a concern [Citation22]. Despite the overall prevalence of echinocandin resistance is low in China (< 1%) [Citation8], monitoring of antifungal susceptibility trends in C. glabrata is warranted. In this study, we investigated the mechanism of resistance in a high-level echinocandin resistant clinical isolate of C. glabrata obtained from an intra-abdominal candidiasis (IAC) patient [Citation9].
Even though FKS1 and FKS2 HS mutations is the major mechanism of echinocandin resistance in C. glabrata [Citation10], no FKS mutation within the proposed HS1 was found in this particular clinical isolate. Nevertheless, an E655 K mutation just upstream of the HS1 region of FKS2 and a premature stop codon in FKS1 were revealed by sequence analysis of the entire ORF of both FKS genes. We then dissected the contribution of these two mutational events to echinocandin resistance. Introduction of the E655 K single mutation in the WT background conferred slight MIC increase, whereas the same mutation introduced into the fks1Δ background led to a strong echinocandin resistant phenotype very similar to that of L74. Moreover, this strong resistance could be reversed by suppression of FKS2 expression with the calcineurin inhibitor FK506, indicating that resistance was mediated by this novel FKS2 mutation E655 K but at the cost of functional Fks1. Our findings are in agreement with a previous study, which demonstrated that the Fks1-Fks2 redundancy attenuates the impact of resistance-conferring HS mutations [Citation12]. Interestingly, our study is a counterpart of a previous report, in which introduction of a HS mutation in FKS1 alone conferred an intermediate reduction in susceptibility, a premature stop codon in FKS2 alone had no effect on susceptibility, but the combination of both severely reduced susceptibility [Citation23].
In light of the previous finding that Fks1 and Fks2 are differentially regulated and their expression levels may impact echinocandin resistance level conferred by FKS mutations [Citation12], we examined both the RNA and protein expression pattern of Fks in the clinical isolate, constructed mutants, and WT strains. The fks1 null mutants had only minimal RNA expression of FKS1, as expected, and transcriptional levels of FKS1 for L74 was also significantly decreased, while the expression level of FKS2 increased.
Previous exposure to echinocandins has been clearly recognized as a risk factor for the development of resistance [Citation24]. In our case, L74 was isolated from an IAC patient without any known prior antifungal exposure within 30 days of isolation [Citation9], however, we cannot completely rule out this possibility in any time before this time window because of the unavailability of medical history. The infection was thought to be acquired after the patient’s abdominal operation, supporting the notion that the gastrointestinal tract is a prominent reservoir for Candida colonization [Citation25] and that IAC is an important source of resistant infections [Citation26]. This study underscores the need to be alert about potential echinocandin resistant C. glabrata infections even in the absence of typical risk factors [Citation27].
In summary, our results demonstrate that the high-level of echinocandin resistance in the clinical L74 isolate of C. glabrata was due to the combination of null function of Fks1 and the novel non-HS point mutation E655 K in Fks2.
Supplemental Material
Download MS Word (17.6 KB)Acknowledgements
We thank all the laboratories that participated in the CHIF-NET programme. The authors alone are responsible for the content and writing of the paper.
Disclosure statement
No potential conflict of interest was reported by the authors.
Additional information
Funding
Related Research Data
References
- Pappas PG, Lionakis MS, Arendrup MC, et al. Invasive candidiasis. Nat Rev Dis Primers. 2018;4:18026. doi: 10.1038/nrdp.2018.26
- Pappas PG, Kauffman CA, Andes DR, et al. Clinical practice guideline for the management of candidiasis: 2016 update by the infectious diseases society of America. Clin Infect Dis. 2016;62(4):e1–50. doi: 10.1093/cid/civ1194
- Kullberg BJ, Arendrup MC. Invasive candidiasis. N Engl J Med. 2015;373(15):1445–1456. doi: 10.1056/NEJMra1315399
- Pfaller MA, Diekema DJ. Epidemiology of invasive candidiasis: a persistent public health problem. Clin Microbiol Rev. 2007;20(1):133–163. doi: 10.1128/CMR.00029-06
- Whaley SG, Rogers PD. Azole resistance in Candida glabrata. Curr Infect Dis Rep. 2016;18(12):41. doi: 10.1007/s11908-016-0554-5
- Alexander BD, Johnson MD, Pfeiffer CD, et al. Increasing echinocandin resistance in Candida glabrata: clinical failure correlates with presence of FKS mutations and elevated minimum inhibitory concentrations. Clin Infect Dis. 2013;56(12):1724–1732. doi: 10.1093/cid/cit136
- Pham CD, Iqbal N, Bolden CB, et al. Role of FKS mutations in Candida glabrata: MIC values, echinocandin resistance, and multidrug resistance. Antimicrob Agents Chemother. 2014;58(8):4690–4696. doi: 10.1128/AAC.03255-14
- Hou X, Xiao M, Chen SC, et al. Molecular epidemiology and antifungal susceptibility of Candida glabrata in China (August 2009 to July 2014): a multi-center study. Front Microbiol. 2017;8(880):1–9.
- Xiao M, Fan X, Hou X, et al. Clinical characteristics of the first cases of invasive candidiasis in China due to pan-echinocandin-resistant Candida tropicalis and Candida glabrata isolates with delineation of their resistance mechanisms. Infect Drug Resist. 2018;11:155–161. doi: 10.2147/IDR.S152785
- Perlin DS. Mechanisms of echinocandin antifungal drug resistance. Ann N Y Acad Sci. 2015;1354(1):1–11. doi: 10.1111/nyas.12831
- Kitada K, Yamaguchi E, Arisawa M. Cloning of the Candida glabrata TRP1 and HIS3 genes, and construction of their disruptant strains by sequential integrative transformation. Gene. 1995;165(2):203–206. doi: 10.1016/0378-1119(95)00552-H
- Katiyar SK, Alastruey-Izquierdo A, Healey KR, et al. Fks1 and Fks2 are functionally redundant but differentially regulated in Candida glabrata: implications for echinocandin resistance. Antimicrob Agents Chemother. 2012;56(12):6304–6309. doi: 10.1128/AAC.00813-12
- Clinical and Laboratory Standards Institute. Reference method for broth dilution antifungal susceptibility testing of yeasts. CLSI, Wayne, PA, USA. 2017.
- Grahl N, Demers EG, Crocker AW, et al. Use of RNA-protein complexes for genome editing in non-albicans Candida species. mSphere. 2017;2(3):e00218-17. doi: 10.1128/mSphere.00218-17
- Istel F, Schwarzmuller T, Tscherner M, et al. Genetic transformation of Candida glabrata by electroporation. Bio Protoc. 2015;5(14):1–5.
- Park S, Kelly R, Kahn JN, et al. Specific substitutions in the echinocandin target Fks1p account for reduced susceptibility of rare laboratory and clinical Candida sp isolates. Antimicrob Agents Chemother. 2005;49(8):3264–3273. doi: 10.1128/AAC.49.8.3264-3273.2005
- Li QQ, Skinner J, Bennett JE. Evaluation of reference genes for real-time quantitative PCR studies in Candida glabrata following azole treatment. BMC Mol Biol. 2012;13(22):1–13.
- Livak KJ, Schmittgen TD. Analysis of relative gene expression data using real-time quantitative PCR and the 2(-Delta Delta C(T)) method. Methods. 2001;25(4):402–408. doi: 10.1006/meth.2001.1262
- Andes D. Use of an animal model of disseminated candidiasis in the evaluation of antifungal therapy. Methods Mol Med. 2005;118:111–128.
- Charan J, Kantharia ND. How to calculate sample size in animal studies? J Pharmacol Pharmacother. 2013;4(4):303–306. doi: 10.4103/0976-500X.119726
- Guinea J. Global trends in the distribution of Candida species causing candidemia. Clin Microbiol Infect. 2014;20(Suppl 6):5–10. doi: 10.1111/1469-0691.12539
- Perlin DS, Rautemaa-Richardson R, Alastruey-Izquierdo A. The global problem of antifungal resistance: prevalence, mechanisms, and management. Lancet Infect Dis. 2017;17(12):e383–e392. doi: 10.1016/S1473-3099(17)30316-X
- Niimi K, Woods MA, Maki K, et al. Reconstitution of high-level micafungin resistance detected in a clinical isolate of Candida glabrata identifies functional homozygosity in glucan synthase gene expression. J Antimicrob Chemother. 2012;67(7):1666–1676. doi: 10.1093/jac/dks112
- Bizerra FC, Jimenez-Ortigosa C, Souza ACR, et al. Breakthrough candidemia due to multidrug-resistant Candida glabrata during prophylaxis with a low dose of micafungin. Antimicrob Agents Chemother. 2014;58(4):2438–2440. doi: 10.1128/AAC.02189-13
- Magill SS, Swoboda SM, Shields CE, et al. The epidemiology of Candida colonization and invasive candidiasis in a surgical intensive care unit where fluconazole prophylaxis is utilized: follow-up to a randomized clinical trial. Ann Surg. 2009;249(4):657–665. doi: 10.1097/SLA.0b013e31819ed914
- Cheng SJ, Clancy CJ, Hartman DJ, et al. Candida glabrata intra-abdominal candidiasis is characterized by persistence within the peritoneal cavity and abscesses. Infect Immun. 2014;82(7):3015–3022. doi: 10.1128/IAI.00062-14
- Farmakiotis D, Tarrand JJ, Kontoyiannis DP. Drug-resistant Candida glabrata infection in cancer patients. Emerg Infect Dis. 2014;20(11):1833–1840. doi: 10.3201/eid2011.140685