
ABSTRACT
Analysis of large-scale gene expression post vaccination can provide an overview of immune responses. We used transcriptional approaches to comprehensively analyze the innate immune response signatures elicited by protein subunit (PS) vaccine ZF2001 and an mRNA vaccine named RRV. A fine-grained time-dependent dissection of large-scale gene expression post immunization revealed that ZF001 induced MHC class II-related genes, including cd74 and H2-Aa, more expeditiously than the RRV. Notably, the RRV induced MHC class I-related genes such as Tap1/2, B2m, and H2-D1/K1. At day 21 post immunization, the titres of binding and neutralization antibody (NAb) induced by both vaccines were comparable, which were accordant with the expression level of genes essential to BCR/TCR signalling transduction and B/T cells activation at day 7. However, compared to ZF2001, the early responses of RRV were more robust, including the activation of pattern recognition receptors (PRRs), expression of genes involved in RNA degradation, and transcription inhibition, which are directly related to anti-viral signals. This pattern also coincided with the induction of cytokines by the RRV. Generally, the transcriptomic patterns of two very different vaccines mapped here provide a framework for establishing correlates between the induction of genes and protection, which can be tailored for evoking specific and potent immune responses against SARS-CoV-2.
Introduction
The outbreak of coronavirus disease 2019 (COVID-19) caused by SARS-CoV-2 has resulted in significant impacts on the economy and medical and health systems, globally. Vaccination is one of the viable countermeasures to curb the spread of the virus. To date, 137 vaccines are in clinical development and 23 vaccines have been already authorized for either field applications or approved for emergency use [Citation1,Citation2]. More than 910 million vaccine doses have been administered to combat the pandemic [Citation3].
Among the 137 clinical candidates from 11 platforms, studies on the protein subunit (PS) vaccines and mRNA vaccines dominate. They account for about 52% of all the vaccines under clinical studies [Citation1]. Published clinical data show that the PS and mRNA vaccines have high protective efficacies against SARS-CoV2 infections. For instance, the PS vaccines, such as ZF2001, NVX-CoV2373, and SCB-2019 have exhibited efficacies of 81.76%, 89.3%, and 67.0%, respectively [Citation4,Citation5]. While the mRNA vaccines such as mRNA-1273 and BNT162b2 have shown efficacies of 94.1% and 95.0%, respectively [Citation5].
Although both the PS and mRNA vaccines have shown high protective efficacy, the nature of the immune responses evoked by them is significantly different [Citation5]. Our results from a parallel study of the PS and mRNA vaccines showed that despite eliciting similar levels of humoral response, the mRNA vaccine was more potent in evoking a T cell response, which was not induced by the PS vaccine [Citation6].
To reveal the specific innate immune signatures of the PS and mRNA vaccines, we performed transcriptome sequencing of samples collected in a time-dependent manner from mice inoculated with an Al(OH)3-adjuvanted PS vaccine ZF2001, and an mRNA vaccine RRV, in the pre-clinical stage. The transcriptomic patterns included commonly induced genes by both vaccines and genes that were specifically induced by the RRV. The implications for the differential expression of genes upon vaccination are discussed.
Materials and methods
Mice and vaccines
About 5-to-6 weeks old female BALB/c mice were purchased from The Laboratory Animal Resource Center, National Institute for Food and Drug Control, housed in a specific pathogen-free (SPF) animal facility.
ZF2001: 25 μg per dose and adjuvanted with 0.5 mg/ml Al(OH)3, jointly developed by the Institute of Microbiology, Chinese Academy of Sciences, and Anhui Zhifei Longcom Biopharmaceutical and produced by the later; RRV: 25 μg per dose, formulated with lipid nanoparticles (LNP). The vaccines were donated by their developers and manufacturers. Vaccines were administered at 1/5 of the human dosages, intramuscularly.
Lymphocyte isolation
Mice in each group were sacrificed by cervical dislocation at 0 hour (h), 3, 6, 12, 24, 72 h, and 7 days (d) after immunization to collect the bilateral inguinal draining lymph nodes (dLNs), which were gently squeezed to release the lymphocytes in phosphate buffer saline (PBS) (Gibco, cat#10010023). More than 1 × 10⁶ cells were collected. After centrifuging, the pellets were resuspended in the TRIzol reagent (Ambion, cat#15596-026).
RNA extraction and transcriptome sequencing
RNA was extracted and analyzed qualitatively and quantitatively by a fragment analyzer with a standard sensitivity RNA analysis kit (15 nt) (DNF-417) and used for RNA-sequencing (RNA-Seq), which was performed by BGI (Shenzhen, China) with the DNBSEQ platform (BGI-Shenzhen, China).
Transcriptomic analysis
Low-quality tags were removed before further data analysis. The clean tags were then mapped to the reference genome of mus_musculus (NCBI: GCF_000001635.26_GRCm38.p6). Principal component analysis (PCA) was performed to ensure the quality of data (Figure S1). Differential gene (1.5-fold up or down-regulation) analysis was conducted using DESeq2, with |log2 (fold change) | >0.585, Q value <0.05. For the heatmap figures, the expression level of fragments per kilobase of exon model per million mapped fragments (FPKM) was normalized with z-score [(x-μ)/σ]. A Venn diagram was plotted by https://www.bioinformatics.com.cn.
Serum neutralization assay
The serum neutralizing antibodies were measured with pseudovirus expressing the optimized full-length spike protein (Strain: Wuhan-Hu-1, GenBank: MN908947) as described in previous work [Citation7]. Results were displayed as 50% inhibitory dilution (EC50) of the serum.
ELISA
ELISA was conducted to determine the titres of serum SARS-CoV-2 spike-specific binding antibodies. The EIA/RIA plates were coated with SARS-CoV-2 spike protein at a concentration of 1 μg/ml and incubated at 4°C overnight. Plates were washed five times with 1 × PBST (PBS containing 0.05% Tween-20) to remove unbound proteins and subjected to block with 10% fetal bovine serum in 1 × PBST for 2 h at 37°C; 100 μl of 10-fold serially diluted samples were added to each well and incubated at 37°C for 1 h. Then, plates were washed as mentioned and incubated with 1:5000 diluted goat anti-mouse IgG antibody (ZSGB-BIO, cat#ZB2305) for 1 h, followed by absorbency detection after incubation with substrates (Wantai BioPharm, cat#N20200722) at the wavelengths of 450 and 630 nm.
The IFN-γ assay was conducted with a mouse IFN-γ precoated ELISA kit (DAKEWEI, cat#121002) based on the manufacturer’s instructions.
Quantitative real-time PCR
The same RNA used in RNA-Seq was subjected to a quantitative real-time PCR with the PrimeScript One-Step RT–PCR kit (Takara, cat#RR055A) following the manufacturer’s instructions. PCR primers were designed with PrimerBank and purchased from Sangon Biotech Company. Primers were listed:
Rig-i-Fw: 5′-AAGAGCCAGAGTGTCAGAATCT-3′, Rig-i-Reverse: 5′-AGCTCCAGTTGGTAATTTCTTGG-3′, Tlr3-Forward: 5′-GTGAGATACAACGTAGCTGACTG-3′, Tlr3- Reverse: 5′-TCCTGCATCCAAGATAGCAAGT-3′, Tlr9- Forward: 5′-ATGGTTCTCCGTCGAAGGACT-3′, Tlr9- Reverse: 5′-GAGGCTTCAGCTCACAGGG-3′, Tap1- Forward: 5′-GGACTTGCCTTGTTCCGAGAG-3′, Tap1- Reverse: 5′-GCTGCCACATAACTGATAGCGA-3′, H2-T22- Forward: 5′-GCCTTGGATTTGGATTGTTGC-3′, H2-T22- Reverse: 5′-AAGACTCGCCAACTGAAGTTC-3′, H2-Aa- Forward: 5′-TCACATGGCTCAGAAATAGCAAG-3′, H2-Aa- Reverse: 5′-CAGGGCACACACCACAGTTT-3′, H2-Ob- Forward: 5′-AGGCGGACTGTTACTTCACC-3′, H2-Ob- Reverse: 5′-ATCCAGGCGTTTGTTCCACTG-3′, Ifng- Forward: 5′-ACAGCAAGGCGAAAAAGGATG-3′, Ifng- Reverse: 5′-TGGTGGACCACTCGGATGA-3′, Isg20- Forward: 5′-TCTTGGGGGTTGGAGGATG-3′, Isg20- Reverse: 5′-CGGAGGTAGAAAGGGCGTC-3′, Gapdh- Forward: 5′-AGGTCGGTGTGAACGGATTTG-3′, Gapdh- Reverse: 5′-TGTAGACCATGTAGTTGAGGTCA-3′.
Real-time PCR was performed on ABI7500 (Applied Biosystems). All data were presented as a relative quantification with Gadph as the internal control.
Multi-array
Sera were collected 12 h after immunization. The assessment of cytokines including IL-1β, IL-2, IL-4, IL-5, IL-6, IL-10, IL-12p70, KC/GRO, interferon (IFN) γ, and TNF-α, was performed using the Meso Scale Discovery's (MSD) multi-array technology V-PLEX proinflammatory panel 1 (mouse) kit (MSD, cat#K15048D) by Univ.
Statistical analysis
The antibody titres were transformed into log10 titres for the calculation of geometric mean titres (GMTs) and the normal distribution test. The titres and IFNγ concentrations followed a normal distribution or an approximately normal distribution (Shapiro–Wilk test, P > 0.05) (https://www.spsspro.com/). Other statistical analyses were conducted with GraphPad Prism 7.0 (GraphPad Software, Inc). A two-tailed student’s t-test was performed for the two groups’ comparison.
Ethics statement
All procedures were approved by the National Institutes for Food and Drug Control. All animal research protocols were approved by the Institutional Animal Care and Use Committee at National Institutes for Food and Drug Control, China (No. 2020-B015). The investigators faithfully adhered to the National Science and Technology Commission No. 2 of 31 October 1988 and “guidance notes on the treatment of experimental animals” (Chinese version (2006) no. 398).
Results
mRNA vaccine RRV rather than PS vaccine ZF2001 elicited a robust innate immune response
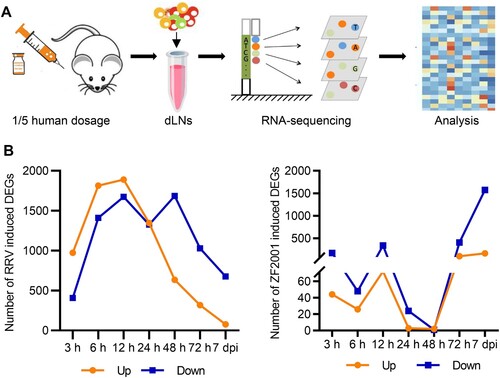
After the primary immunization of BALB/c mice with a 1/5 human dosage of ZF2001 or RRV, which dosage had been employed in the previous work [Citation5], bilateral inguinal dLNs were collected at 0, 3, 6, 12, 24, 48, 72 h, and 7 d, and subjected to transcriptome sequencing and subsequent analysis ((A), Figure S1). For each time point, three mice were included for ZF2001 or RRV inoculation. To assess the dynamic response of gene expression, we set differentially expressed genes (DEGs) as 1.5-fold up- or down-regulated (|log2 (fold change) | > 0.585, Q value < 0.05) in response to vaccination, based on the expression of fragments per kilobase of the exon model per million mapped fragments (FPKM). The number of DEGs induced by the RRV or ZF2001 inoculation were shown in (B). RRV induced the expression of more DEGs than ZF2001, when the number of up-regulated DEGs peaked at 12 h and decreased rapidly after that ((B)). Similarly, more up-regulated DEGs were also detected at 12 h in the ZF2001 group; albeit these were less than 1/3rd of the DEGs up-regulated by the RRV during the same period; 24 h or 48 h after the ZF2001 inoculation, there were only three DEGs, respectively. However, the gene expression level increased 72 h after inoculation, with the number of up-regulated DEGs increasing to a comparable level to that of the RRV group ((B)).
Figure 1. Transcriptional response to ZF2001 and the RRV vaccination. (A) Overview of transcriptional analysis. (B) DEG numbers of each immunization group are indicated (DEG versus baseline at 0 h; absolute |log2 (fold change)| >0.585; Q value <0.05, is presented.). Three mice are included in each group.
Next, we used Reactome to perform the gene enrichment analysis of the DEGs. Results of the analysis suggested that for the ZF2001 or RRV group (3, 6, 12, 24, 48, 72 h, and 7 d), several up-regulated DEGs could be clustered into the immune system (398/2650 for RRV and 56/279 for ZF2001) (; Figure S2). There were 45 common DEGs between the two groups belonging to the immune system. Interestingly, these included the majority (45 out of 56) of ZF2001-induced DEGs, hinting at their essential roles in the immune response (Supplementary Table 1).
Figure 2. Innate immune response signatures of ZF2001 and the RRV vaccination. (A) and (B) Enrichment of the immune-annotated DEGs (up-regulated) from the RRV (A) or ZF2001 (B) vaccination group, ranked by correlation with each function annotation. Top ten annotations are listed. Q value <0.05. (C) Heatmap analysis indicated the responses of genes involved in the innate immune response signalling pathway. Average FPKM values are displayed after the z-score normalization. The arrow indicates the direction of the z-score.
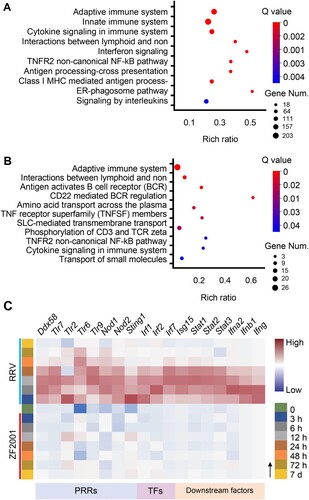
All DEGs (3, 6, 12, 24, 48, 72 h, and 7 d) involved in the immune system were divided into more specific sub-clusters ((A)). Both the ZF2001 and RRV stimulated DEGs were enriched in pathways such as the B cell receptor-mediated signalling and cytokine signalling ((A,B)). Notably, the DEGs from the RRV group were characterized by significant enrichment in innate immunity, Q value = 2.1e-10 ((A)).
The expression levels of genes belonging to innate immunity were further analyzed. We found that the expression of genes encoding the pattern recognition receptors (PRRs) such as toll-like receptor 3 (TLR3), TLR7, and retinoic acid-inducible gene I (RIG-I), their downstream transcription factors such as IRF1, IRF2, IRF7, signal transducers, and activators of transcription (STATs), as well as IFNs were induced to higher levels – suggesting a more robust innate immune response – after RRV immunization ((C); Figure S3). The induction of genes involved in antiviral signalling by the mRNA vaccine RRV was consistent with the mRNA vaccine BNT162b2, whose stimulated genes also significantly enriched the innate immune system, including the IFN-mediated antiviral signalling pathway [Citation8].
PS vaccine ZF2001 and mRNA vaccine RRV possessed similar humoral response level
We then examined the humoral immune responses elicited by two vaccines. First, we estimated the titres of binding antibody and neutralization antibody (NAb) from sera collected three weeks post-immunization of the mice. The results showed that both the binding antibody and NAb titre levels were similar (P > 0.05) after the vaccination of mice with the two vaccines ((B,C)). Then, the expression of genes involved in the antigen presentation and B/T cell activation were examined to further analyze the patterns of the immune responses elicited by the vaccines. Remarkably, the two vaccines induced different molecules involved in antigen processing and presentation, depending on the route of processing-intracellular or extracellular antigenic proteins mainly. This is in agreement with the previously published studies and underscores the key difference between the two types of vaccines [Citation9,Citation10]. ZF2001 induced the genes encoding the components of the MHC class II (MHCII) protein complex including cd74 and H2-Aa as early as 3 h post vaccination ((A)). The aluminum-containing adjuvant probably enhanced the presentation of antigens to CD4+ T cells as observed previously [Citation11]. Thus, ZF2001 promoted the presentation of antigens to CD4+ T cells via MHCII molecules. By contrast, RRV induced expression of the genes related to MHCI-restricted CD8+ responses such as Tap1/2, B2 m, and H2-D1/K1 as well as MHCII-restricted CD4+ responses including cd74 and H2-Aa ((A); Figure S3), with the expression of MHCI-related genes dominated. Thus, the RRV promotes the presentation of antigens to both CD8+ and CD4+ T cells. Furthermore, our data revealed a dynamic regulation of the MHCI and II molecules. Specifically, after RRV inoculation, the MHCI-related genes were induced at 0–48 h and genes encoding MHCII complex components were expressed mainly after 48 h in the dLNs ((A)). The importance of activation of the MHCII-restricted CD4+ T cell responses in potentiating humoral response and CD8+ T cell response [Citation10] was clearly corroborated in the expression levels of the MHCII-related genes after 48 h, in which expression levels coincided with the antibody levels elicited by the two vaccines.
Figure 3. Adaptive immune signatures of ZF2001 or the RRV vaccination. (A) Heatmap analysis indicates the expression levels of genes involved in adaptive immunity. Average FPKM values are displayed after the z-score normalization. The arrow indicates the direction of the z-score. (B) The SARS-CoV-2 S protein-specific IgG antibody titre is determined using an enzyme-linked immunosorbent assay (ELISA). (C) NAb levels are measured with pseudovirus. (B) and (C) 5-to-6-week-old female Balb/c mice are immunized with 1/5th of the human dosage of ZF2001 or RRV. The serum is collected after priming for three weeks. Each symbol represents an individual mouse. n = 10 mice per group. ns, nonsignificant, by a two-tailed student’s t-test. (D) Venn diagram of up-regulated DEGs, which enriched the immune system after the ZF2001 or RRV immunization, along with those induced at day 7. The Venn diagram is plotted by https://www.bioinformatics.com.cn.
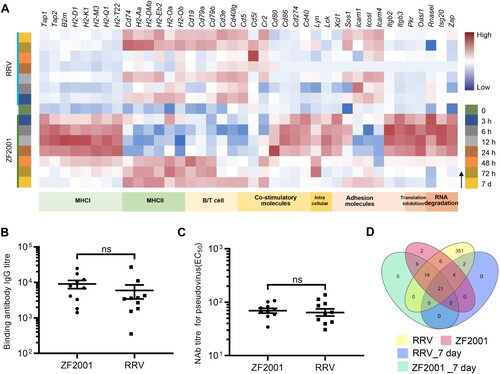
As expected, the inherent response patterns involved in the activation of B/T cells were different. Although the genes encoding the MHCII coreceptor CD40L as well as the B-cell receptor components CD79a and CD79b were induced by both the vaccines, the expression was earlier in the ZF2001 immunization groups ((A)). Essential to the BCR/TCR-mediated B/T cell activation, the gene inductions were a pre-requisite to subsequent adaptive responses.
It is noteworthy to mention that the number of immune-related DEGs profiled 7 days after vaccination converged to a similar level (27 for RRV and 44 for ZF2001) and consisted of a subset of common genes such as cd19, cd79a, cd79b, and cd40lg ((A and D), Supplementary Table 2). Since the number and expression level of DEGs were similar between the ZF2001 and RRV groups 7 days after primary vaccination, together with the fact that both vaccines had elicited similar antibody titres at day 21, it suggested a consistent pattern between the expression of these genes and development of humoral immune response emerges ((B–D)). However, the time-dependent induction of the type and pattern of the costimulatory molecules by ZF2001 and RRV were distinctly different ((A)), implying the difference in their immune response patterns.
The self-adjuvating effects of the mRNA vaccine RRV were detrimental to the antigenic protein production
Despite there being no adjuvant supplied in the RRV, the mRNA molecule self was the potential to activate RIG-I and TLRs. Meanwhile, the lipid nanoparticle (LNP), formulated for RNA delivery, was considered to activate TLR2 and TLR4. Both the mRNA molecule and LNP activated PRR-mediated innate immunity, which was described as the self-adjuvant effect [Citation12–14]. We next sought to examine whether the inherent self-adjuvating effect affected the humoral response of RRV, concerning the controversial roles of mRNA vaccine-mediated activation of the PRR signalling pathways and the enhancement of antiviral signal via IFNs [Citation12–14]. Genes involved in translation inhibition and RNases encoding genes such as Pkr, Ifit1, Isg20, and Rnasel, were found to be significantly induced in RRV immunized mice ((A); Figure S3). The induction of translation inhibition and RNases would inhibit the translation of foreign mRNA, degrade it, or do both, which were detrimental to the antigenic protein production [Citation15,Citation16].
Cytokine levels of the mRNA vaccine RRV and PS vaccine ZF2001
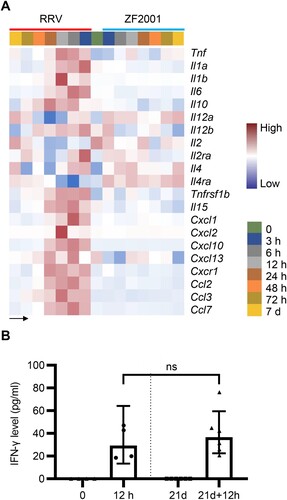
Cytokines play pivotal roles in the signal transduction and recruitment of immune cells, a prerequisite for antibody production and cellular immune response [Citation17]. In our data, an increased gene expression of cytokines, such as IFNs, interleukin (IL)-1, and IL-6, were detected in the RRV group ((A); Supplementary Table 3). However, limited variety and quantity of cytokines were induced after the ZF2001 vaccination ((A); Supplementary Table 3). As the correlation between IFN-γ concentration and spike-specific binding antibodies level of the BNT162b2 vaccination was reported [Citation18], we collected sera on the day of and 12 h after the prime and boost vaccination of RRV, which were subjected to estimate the IFN-γ concentration. IFN-γ levels detected by ELISA were commensurated with the gene expression data (Figures 4A and 2C).
Figure 4. Cytokines levels after ZF2001 or the RRV vaccination. (A) Heatmap analysis indicates the expression levels of cytokine-encoding genes. Average FPKM values are displayed after the z-score normalization. The arrow indicates the direction of the z-score. (B) The quantitative ELISA assay is performed to measure the concentration of IFN-γ level in the serum of 5-to-6 weeks old female Balb/c mice after the RRV vaccination for an indicated time. n ≥ 4 mice per group. ns, nonsignificant, by the two-tailed student’s t-test.
Discussion
We compared the innate immune signatures of the protein subunit vaccine ZF2001 and the mRNA vaccine RRV in a time-dependent manner. Our studies emphasized the importance of sampling time as many genes expressed only during a short period after vaccination, which would not be detected and lead to totally different conclusions. For instance, genes involved in the IFN signalling pathway were not detected after the BNT162b2 vaccination when peripheral blood mononuclear cells (PBMCs) of 27 individuals were collected at a 7-day interval [Citation19]. On the contrary, the PBMCs collected on the 1st and 2nd days after immunization with the same vaccine showed a significant enrichment of the IFN response transcriptional modules [Citation8]. Hence, our results with the samples collected intensively provided detailed information on the development and progression of the innate immune response post vaccination.
The divergent innate immune response patterns elicited by ZF2001 and RRV were revealed for the first time in this study. The RRV, relying on the PRR-mediated signalling, induced a stronger innate immune response than ZF2001 (). However, the transcriptional signatures of a single cell cluster were lacking here. And it is also interesting to figure out whether the residual templet DNA contributed to the activation of TLR9.
In addition, both vaccines induced similar humoral responses ((B,C)). The results also indicated that a restrained innate immune response induced by ZF2001 could elicit proportionate humoral immune responses. The elicitation of a similar antibody level but distinct innate immune responses by the two vaccines warranted further exploration of the appropriate level of innate immunity and relevant key factors involved in potent adaptive immune responses initiation. Since the NAb levels were correlated with the protective efficacy of vaccines [Citation20,Citation21], it is reasonable to infer that ZF2001 and RRV were supposed to have identical protective efficacy. Although clinical data had shown high protective efficacy and less adverse reactions of ZF2001 [Citation22], it remained to be determined whether enhanced innate immune responses by adjuvant formulation optimization would promote its humoral and cellular responses.
The two vaccines induced different groups of molecules that changed over time. This was largely driven by differences in antigen processing and presentation. Since antigens presented by MHC II mediated the activation of CD4+ T cells, which correlated with the B cell activation level and antibody production [Citation9,Citation10], strategies to ensure sufficient CD4+ T cell activation would be of great importance. However, the complex interactions between the class and unconventional processing of antigens were not fully understood, as well as the dissection of PRR-mediated unfolded protein response (UPR) which regulated the translation and secretion of antigenic proteins and MHC molecules [Citation23–25], deciphering the optimal condition for establishing a reactive and potent CD4+ T cell response would be needed.
The relative higher innate immune response of RRV may be detrimental since the IFN induced the expression of downstream RNase-encoding genes like Isg20 and Rnasel, as well as translation inhibition genes which could impact antigen synthesis ((A)). Despite the fact that the mRNA design utilized a 5′ cap structure and substitution of Ψ to mimic the endogenous mRNAs, the substitution or modification of motifs recognized by RNases would have had a more profound impact and revealed new information. However, given the central role of IFNs in signal transduction, cytokine induction, and stimulation of the immune cell maturation, as well as the latent detriment of translation inhibition and RNA degradation [Citation26], the double-edged blades of innate immune responses should be finely balanced.
Elevation of the immunogenetic profiles of the PS and mRNA vaccines is urgently needed to cope with the ever-changing epidemic situation confronted with an increasing appearance of the SARS-CoV-2 variants of concern and declining durability of the NAb levels. The innate and adaptive immune responses of the aluminum-adjuvant PS vaccines can be potentially further enhanced by the application of new adjuvants such as CpG. As for the mRNA vaccines, an optimization of formulation, in vitro-transcribed mRNA production and purification could further fine-tune the innate and adaptive immune responses, leading to an improvement of the protective efficacy and safety. The results of our fine-grained analysis of transcriptomic patterns of the subunit and mRNA vaccines provide new information on the differential activation of immune responses that could be applied to improve vaccine formulations for eliciting tailored immune responses.
Author contributions
ZL and MX are corresponding authors who conceptualized the study. ZL, QW, QH, and QM designed, supervised the experiments, and interpreted data. QW, ZS, and JY are the co-first authors who performed the experiments. QW is listed the first as she analyzed the transcriptome data and drafted the manuscript with ZL. CA, XY, BC, LS, and DL helped to perform the experiments. QM, YB, and JL provided critical editing of the manuscript.
Supplemental Material
Download MS Word (584.4 KB)Acknowledgements
We thank the vaccine developers for providing COVID-19 vaccines. We thank Dr. Youchun Wang and Dr. Weijin Huang of the National Institute for Food and Drug Control for providing pseudo-virus used in the NAb measurement assays and relative instructions. We thank all these institutes and developers for their support in this study.
Disclosure statement
No potential conflict of interest was reported by the author(s).
References
- World Heathy Origination. COVID-19 vaccine tracker and landscape. Available from: https://www.who.int/publications/m/item/draft-landscape-of-covid-19-candidate-vaccines, 2021.
- Science. Novavax’s long-awaited COVID-19 vaccine authorizations offer an alternative to mRNA. Available from: https://www.science.org/content/article/novavax-s-long-awaited-covid-19-vaccine-authorizations-offer-alternative-mrna, 2021.
- World Heathy Origination. WHO coronavirus (COVID-19) dashboard. Available from: https://covid19.who.int, 2021.
- Clover Biopharmaceuticals. Clover’s COVID-19 vaccine candidate demonstrates 79% efficacy against delta in global phase 2/3 SPECTRA trial dominated by variants of concern and interest. Available from: https://www.cloverbiopharma.com/news/83.html, 2021.
- He Q, Mao Q, Zhang J, et al. COVID-19 vaccines: current understanding on immunogenicity, safety, and further considerations. Front Immunol. 2021;12:669339.
- Zhang J, He Q, An C, et al. Boosting with heterologous vaccines effectively improves protective immune responses of the inactivated SARS-CoV-2 vaccine. Emerg Microbes Infect. 2021 Dec;10(1):1598–1608.
- Nie J, Li Q, Wu J, et al. Establishment and validation of a pseudovirus neutralization assay for SARS-CoV-2. Emerg Microbes Infec. 2020 Dec;9(1):680–686.
- Arunachalam PS, Scott MKD, Hagan T, et al. Systems vaccinology of the BNT162b2 mRNA vaccine in humans. Nature. 2021 Aug;596(7872):410–416.
- Burgdorf S, Kautz A, Bohnert V, et al. Distinct pathways of antigen uptake and intracellular routing in CD4 and CD8T cell activation. Science. 2007 Apr 27;316(5824):612–616.
- Xu S, Yang K, Li R, et al. mRNA Vaccine Era-Mechanisms, Drug Platform and Clinical Prospection. Int J Mol Sci. 2020 Sep 9;21(18):6582.
- Sokolovska A, Hem SL, HogenEsch H. Activation of dendritic cells and induction of CD4+ T cell differentiation by aluminum-containing adjuvants. Vaccine. 2007 Jun 6;25(23):4575–4585.
- Pizzuto M, Gangloff M, Scherman D, et al. Toll-like receptor 2 promiscuity is responsible for the immunostimulatory activity of nucleic acid nanocarriers. J Control Release. 2017 Feb 10;247:182–193.
- Zhang H, You X, Wang X, et al. Delivery of mRNA vaccine with a lipid-like material potentiates antitumor efficacy through Toll-like receptor 4 signaling. Proc Natl Acad Sci U S A. 2021 Feb 9;118(6):e2005191118.
- Linares-Fernandez S, Lacroix C, Exposito JY, et al. Tailoring mRNA vaccine to balance innate/adaptive immune response. Trends Mol Med. 2020 Mar;26(3):311–323.
- Jensen S, Thomsen AR. Sensing of RNA viruses: a review of innate immune receptors involved in recognizing RNA virus invasion. J Virol. 2012 Mar;86(6):2900–2910.
- Burke JM, Moon SL, Matheny T, et al. RNase l reprograms translation by widespread mRNA turnover escaped by antiviral mRNAs. Mol Cell. 2019 Sep;75(6):1203–1217.e5.
- Kowalczyk A, Doener F, Zanzinger K, et al. Self-adjuvanted mRNA vaccines induce local innate immune responses that lead to a potent and boostable adaptive immunity. Vaccine. 2016 Jul 19;34(33):3882–3893.
- Bergamaschi C, Terpos E, Rosati M, et al. Systemic IL-15, IFN-γ, and IP-10/CXCL10 signature associated with effective immune response to SARS-CoV-2 in BNT162b2 mRNA vaccine recipients. Cell Rep. 2021 Aug 10;36(6):109504.
- Ivanova EN, Devlin JC, Buus TB, et al. SARS-CoV-2 mRNA vaccine elicits a potent adaptive immune response in the absence of IFN-mediated inflammation observed in COVID-19. Preprint. medRxiv. 2021;2021.04.20.21255677.
- Feng S, Phillips DJ, White T, et al. Correlates of protection against symptomatic and asymptomatic SARS-CoV-2 infection. Nat Med. 2021 Nov;27(11):2032–2040.
- Gilbert PB, Montefiori DC, McDermott AB, et al. Immune correlates analysis of the mRNA-1273 COVID-19 vaccine efficacy clinical trial. Science. 2021. Available from: https://www.science.org/doi/epdf/10 .1126/science.abm3425.
- Yang S, Li Y, Dai L, et al. Safety and immunogenicity of a recombinant tandem-repeat dimeric RBD-based protein subunit vaccine (ZF2001) against COVID-19 in adults: two randomised, double-blind, placebo-controlled, phase 1 and 2 trials. Lancet Infect Dis. 2021;21(8):1107–1119.
- Miller MA, Ganesan AP, Luckashenak N, et al. Endogenous antigen processing drives the primary CD4+ T cell response to influenza. Nat Med. 2015 Oct;21(10):1216–1222.
- Osorio F, Lambrecht BN, Janssens S. Antigen presentation unfolded: identifying convergence points between the UPR and antigen presentation pathways. Curr Opin Immunol. 2018 Jun;52:100–107.
- Ranjan K, Hedl M, Sinha S, et al. Ubiquitination of ATF6 by disease-associated RNF186 promotes the innate receptor-induced unfolded protein response. J Clin Invest. 2021 Sep 1;131(17).
- Iavarone C, O'Hagan DT, Yu D, et al. Mechanism of action of mRNA-based vaccines. Expert Rev Vaccines. 2017 Sep;16(9):871–881.