
 ?Mathematical formulae have been encoded as MathML and are displayed in this HTML version using MathJax in order to improve their display. Uncheck the box to turn MathJax off. This feature requires Javascript. Click on a formula to zoom.
ABSTRACT
Following the global emergence of the SARS-CoV-2 Alpha variant of concern (VOC) in 2020, the Delta variant triggered another wave in 2021. The AY.69 lineage, a Delta VOC, was particularly prevalent in Republic of Korea (South Korea) from May 2021 to January 2022, despite the synchronized implementation of vaccination programmes and non-pharmaceutical interventions (NPIs) such as social distancing. In this study, we used phylogeographic analysis combined with a generalized linear model (GLM) to examine the impact of human movement and vaccination on viral transmission. Our findings indicated that transmission primarily originated in South Korea’s metropolitan areas, and a positive correlation was observed between total human mobility (tracked by GPS on mobile phones and estimated through credit card consumption) and viral spread. The phylodynamic analysis further revealed that non-vaccinated individuals were the primary transmitters of the virus during the study period, even though vaccination programmes had commenced three months prior to the AY.69 outbreak. Our study emphasizes the need to focus on controlling SARS-CoV-2 transmission in metropolitan regions and among unvaccinated populations. Furthermore, the positive correlation between mobility data and viral dissemination could contribute to the development of more accurate predictive models for local spread of pandemics.
GRAPHICAL ABSTRACT

Introduction
The coronavirus disease (COVID-19) pandemic, caused by severe acute respiratory syndrome coronavirus 2 (SARS-CoV-2), has been marked by an overwhelming number of deaths worldwide. The virus was first identified in Wuhan City on 29 December 2019, experiencing intensive human-to-human transmission [Citation1]. Due to the high transmissibility of SARS-CoV-2, with an effective reproductive number (R) of 2.35, the global case count surged exponentially, leading the World Health Organization (WHO) to declare a pandemic [Citation2,Citation3]. The SARS-CoV-2 Interagency Group (SIG) has been evaluating the risk of variants and classifying them into categories such as Variant Being Monitored (VBM), Variant of Interest (VOI), Variant of Concern (VOC), and Variant of High Consequence (VOHC) based on variant proportions at the national levels and potential health impact [Citation4]. The rapid mutation and spread of SARS-CoV-2 have hindered traditional epidemiological contact tracking surveys [Citation5], making real-time tracing and genomic epidemiology important complementary tools [Citation6]. Recent advances in phylodynamics and spatiotemporal analysis have made phylogenetic analysis a critical tool for epidemiological studies of SARS-CoV-2 infection [Citation7].
The outbreak in the Republic of Korea (South Korea) from May 2021 to January 2022 was driven by the sub-lineage of the SARS-CoV-2 Delta VOC, AY.69, with the incidence gradually increasing over time. The outbreak intensified in the later period from August 2021, resulting in a larger outbreak. The number of complete sequences of AY.69 worldwide is 11,296, among which 11,234 are from South Korea [Citation8]. South Korea adopted various policies, including vaccination programmes, social distancing measures and mandatory quarantine periods, to control the pandemic [Citation9]. Infected individuals and close contacts were subject to a 7–10-day mandatory quarantine, while inbound travelers had to undergo a 10–14-day mandatory quarantine. The national immunization programme, with mRNA vaccines (BNT162b2, Pfizer-BioNTech; mRNA-1273, Moderna) and adenovirus vector vaccines (ChAdOx1, AstraZeneca; Ad26.COV2.S, Janssen), aimed to vaccinate 70% of the population by November 2021, prioritizing high-risk groups from 26 February 2021, before expanding to younger age groups [Citation10]. This age-based prioritization strategy, coupled with high distribution and compliance rates, led to a rapid increase in the immunized population [Citation11]. The proportion of fully vaccinated individuals exceeded 70% by 23 October 2021, and exceeded 80% on 29 October 2021 [Citation12].
Vaccination programmes have helped reduce fatalities [Citation13], and South Korea saw a decline in its fatality rate (confirmed deaths / confirmed cases), ultimately reaching a mean fatality rate of 0.8% [Citation14,Citation15]. However, the infection rate increased despite high vaccination coverage, with non-vaccinated individuals predominantly contributing to infections in 2021, although the incidence of breakthrough infections gradually increased until the end of 2021 [Citation16]. Understanding transmission dynamics among groups with different immune statuses requires contact histories to be analyzed alongside ongoing epidemiologic surveillance [Citation17].
Human mobility plays a significant role in viral dissemination. Phylogeographic studies have demonstrated the importance of human factors in pandemics, such as the impact of air traffic density on the spread of the human immunodeficiency virus [Citation18] and freight transportation on the avian influenza virus [Citation19]. These studies suggest that human mobility, measured by public transportation scales, can partially explain the spatial spread of a virus. Although viruses have distinct characteristics, examining the influence of human movement on COVID-19 is warranted [Citation20]. High-resolution human mobility data, including mobile phone data, may serve as a valuable predictor of local spread [Citation21–23].
Phylogeography and phylodynamic analyzes have been employed to trace virus sources, transmission routes, and assess epidemiological patterns [Citation21,Citation22]. Moreover, the impact of various factors on phylogeographic results can be evaluated using a generalized linear model (GLM) [Citation16,Citation17]. These advanced genomic epidemiology tools have proven useful in assessing the effectiveness of control strategies [Citation23,Citation24].
The objective of this study was to infer viral transmission in South Korea and examine the influence of various factors on viral spread using a phylogeographic analysis supported by a GLM. Furthermore, we explored the role of vaccinated and non-vaccinated populations in viral transmission by incorporating vaccination history into our phylogenetic analysis. We believe these findings contribute to evaluating prevention policies during the period when Delta VOCs dominated the pandemic.
Materials and methods
Virus whole-genome sequencing
SARS-CoV-2 samples were collected during national COVID-19 surveillance and analyzed at the Korea Disease Control and Prevention Agency. During the study period, between May 2021 and January 2022, 598,762 incidence cases were reported in South Korea. All samples from positive cases have been preserved as resources, with the isolated viruses deposited in the National Culture Collection for Pathogens (NCCP). To enable efficient and cost-effective genetic mutation monitoring, we sequenced approximately 4% of the total cases, selected based on outbreak data and epidemiological links. Additionally, we selected samples from sporadic cases and a few random representative samples from epidemiologically linked large outbreaks. We excluded multiple samples from a single individual to avoid duplication.
The whole genome of the selected samples was analyzed using a Next-generation sequencing system. cDNA was amplified from total RNA using the QIAseq SARS-CoV-2 Primer Panel and QIAseq FX DNA Library UDI Kit (Qiagen). Libraries were prepared using the Nextera DNA Flex Library Prep Kit (Illumina, San Diego, CA, USA), and sequencing was performed on a MiSeq instrument using a MiSeq reagent kit V2 (Illumina, San Diego, CA, USA) achieving an average genome coverage of >1000× for all samples. Reads were trimmed and mapped to the reference genome Wuhan-Hu-1 (GenBank: MN908947.3) using CLC Genomics Workbench version 20.0.3 (CLC Bio, Aarhus, Denmark). In total, we obtained 21,663 sequences during the study period.
All procedures involving human participants were conducted in accordance with the ethical standards of the institutional and/or national research committee, as well as the 1964 Declaration of Helsinki and its subsequent amendments or comparable ethical standards. The study was approved by the Institutional Review Board of the Korea Disease Control and Prevention Agency (approval number: 2020-03-01-P-A) and designated as a service to public health during the pandemic. As a result, the Institutional Review Board waived the requirement for written informed consent, in accordance with the Title Laboratory Response to COVID-19.
Sequence data and subsampling
We analyzed a total of 21,663 sequences obtained during this period and determined their lineages using the Pango lineage nomenclature system (Pangolin v. 1.11) [Citation25]. Consequently, 52.3% of the sequences were designated as the AY.69 variant (n = 10,232). All sequences were deposited to the Global Initiative for Sharing All Influenza Data (GISAID; https://gisaid.org/) (Supplementary Table 1) [Citation26]. To prevent the inclusion of sequences mistakenly identified as AY.69, we retained only those containing AY.69-associated mutations (A4838G, G9431A, G16864A, and C27559 T) as designated by the Pango network [Citation25]. The quality of the filtered AY.69 sequences was assessed using Nextclade Quality Control, retaining only those of good quality (8806 sequences) [Citation27].
We aligned each sequence to the reference (Wuhan-Hu-1) and manually trimmed them to a length of 29,409 bp from the ORF1ab starting codon to the ORF10 stop codon using Geneious Prime software v. 2021.2.2 [Citation28]. Frame-shifting insertions or deletions shared by <1% of the sequences were considered sequencing errors and manually removed.
To reduce the number of sequences to 680, we employed TARDiS for subsampling sequence data, considering both the collection date () and genetic relatedness (
). We used balanced weights set (
= 0.5:0.5) to preserve essential cladistic structures and continental distributions [Citation29]. Subsampling was conducted for each region separately to prevent additional sampling bias during the process.
We constructed a maximum-likelihood phylogenetic tree with FastTree v. 2.1.11 using sequences from other countries to identify Korean transmission lineages. We selected 1348 Delta-representative sequences outside of Korea (123, 168, 342, 340, 185, and 190 from Africa, Asia, Europe, North America, Oceania, and South America, respectively) from Nextstrain v.11 [Citation30], which were downloaded from GISAID as reference sequences in the tree. The approximately-maximum-likelihood phylogenetic trees were generated using FastTree v. 2.1.11 under the generalized time-reversible nucleotide substitution with CAT model [GTR + CAT] [Citation31]. We selected a clade in which Korean sequences were most tightly grouped and shared the same ancestor with support values > 0.7 in the final dataset (Supplementary Figure 1). Outlier sequences with > 8.0 × 10⁻⁴ variances in the tree were examined in TempEst v. 1.5.3 with a root-to-tip regression [Citation32], resulting in the removal of an additional 38 sequences. We ultimately used 642 sequences as the final dataset.
Bayesian phylogeographic analysis
For the subsampled dataset, we classified the data into 17 geographical groups: Busan (BS), Chungbuk (CB), Chungnam (CN), Daegu (DG), Daejeon (DJ), Gyeongbuk (GB), Gyeonggi (GG), Gwangju (GJ), Gyeongnam (GN), Gangwon (GW), Incheon (IC), Jeonbuk (JB), Jeju (JJ), Jeonnam (JN), Sejong (SJ), Seoul (SU), and Ulsan (US). Additionally, we classified the data into three immune status groups: fully vaccinated (FV), indicating individuals who were at least 2 weeks past their second vaccination; partially vaccinated (PV), indicating individuals who were at least 2 weeks past their first vaccination; and non-vaccinated (NV). In the geographical groups of the 642-subsampled dataset, SU had the highest number of sequences (n = 196), followed by GG (n = 128), CB, and CN (n = 56) ((a, c)). In the immune groups, NV had the highest number of sequences (n = 416), followed by FV (n = 158), and PV (n = 68) ((e)).
We constructed phylogenetic trees on timescales using BEAST v.1.10.4 [Citation33]. The GTR nucleotide substitution models were selected by the Bayesian average of the site-based phylogenetic models using bModelTest [Citation34]. We applied an uncorrelated log-normal relaxation-driven (UCLD) clock model for flexible estimation of substitution rates. Additionally, we assessed changes in virus population sizes using a flexible approach with Bayesian SkyGrid tree priors. Markov chain Monte Carlo algorithms were applied over 100 million steps, with parameters and trees sampled at 10,000-step intervals. The parameters were analyzed using TRACER v.1.7.1 with 10–20% burn-in [Citation35]. We first constructed a tree without the GLM model and used it as an initial tree for GLM. Most parameters had effective sampling sizes of > 200. The resultant log files and trees were combined using LogCombiner v.1.10.4 [Citation36], resulting in 32,804 parameter states and posterior trees. Time-scaled max-clade-credibility trees were generated using the TreeAnnotator [Citation36] function in BEAST and were visualized with FigTree v.1.4.3 [Citation37].
Bayesian stochastic search variable selection (BSSVS) procedures were applied to determine the most supported transmission events among discrete states using Bayes factor tests, and transmissions were played along the timeline using SPREAD3 v.0.9.6 [Citation38]. A transmission was considered significant at a Bayes factor of > 6 and a posterior probability of > 0.5.
Investigation of potential predictors
We investigated various potential predictors for viral transmission, including public transportation (intercity bus, express bus, and railway), movement data tracked using KT mobile phones, population density, vaccination rates, age, credit card consumption data, and inter-regional distances. Bank and Credit (BC) credit card payments were aggregated by the total number and amounts of people's daily payments for entertainment in each region. Movement data tracked by KT mobile phones was freely provided by the Korean Tourism Organization to suggest better data-driven tourism policies. Both datasets were collected from May 2021 to January 2022 and were provided anonymously [Citation39].
We explored associations between candidate covariates using the web-based application Phylogeographic Covariate Analysis (PhyCovA) prior to GLM analysis in BEAST [Citation40]. We excluded population density and inter-regional distances as predictors, as they did not appear to be correlated with the inter-regional viral spread in PhyCovA. Additionally, we excluded public transportation data (intercity bus, express bus, and railway) because it did not reflect movement between Jeju Island and other regions, and it showed strong correlations with mobile phone mobility data. We included vaccination coverage between May 2021 and January 2022 as an additional predictor, which has been utilized in studies examining the spread of rubella [Citation41]. The sample size (number of sequences) from each region was used as a predictor to evaluate the effect of sampling bias.
The age distribution of people in South Korea's regions is relatively consistent. The average age across all regions was 43.5, and no significant difference was observed between regions (p-value = 0.144) (Supplementary Table 2). Therefore, we did not consider age distribution for GLM analysis.
Generalized linear model of discrete trait diffusion
We applied the selected predictors to Bayesian phylogeography in discrete space and the GLM-diffusion model using BEAST v.1.10.4, including mobile phone-based mobility data, credit card consumption data, vaccination rates of each region, and the number of sequences as parameters. The log-transformed number of transmissions among 17 discrete regions were considered the dependent variable of the GLM according to the continuous-time Markov chain. The independent variables comprised log-transformed mobility data, vaccination rates, and the number of sequences. The Bayesian model was used to simultaneously estimate phylogenetic history, ancestral movement, and covariate contributions [Citation24].
We also estimated coefficients that quantified the contributions or effect sizes of predictors (in log space) and a binary indicator variable, which allows the inclusion or exclusion of predictors from the model.
Validation of the phylogeography and GLM analysis
To test the robustness of our findings, we built several validation datasets. Firstly, we subsampled 220 sequences from our 642-sequence dataset using TARDiS software. The number of new subsampled datasets, 220, was assigned to maintain the distribution of the number of sequences for each region. Secondly, we conducted the same analysis with different partitions of sampling regions. Following the Ministry of Interior and Safety categories for provinces, we merged BS, DG, GB, GN, and US into GS (Gyeongsang province), CB, DN, DJ, and SJ into CC (Chungcheong province), GG, IC, and SU into MP (Metropolitan regions), and JB, JN, and GJ into JL (Jeolla province). GW and JJ are provinces themselves. Lastly, we subsampled 220 sequences from the whole AY.69 sequences (n = 8806), excluding the 642 sequences used in our main analysis. We repeated the same procedures of analysis for ten distinct subsampled datasets. These validation datasets allowed us to assess the consistency and robustness of our results. The number of sequences for each dataset is shown in Supplementary Table 3.
Results
Predominance of AY.69 variant in South Korea during the second half of 2021
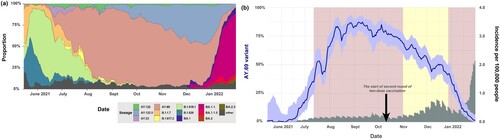
Genetic surveillance revealed that the AY.69 variant was initially detected in South Korea on 14 May 2021, with approximately 50% of cases found in Seoul and Gyeonggi ((b)). The AY.69 variant accounted for over 70% of sequenced cases in August and became the dominant lineage in South Korea from mid-July to December 2021. The incidence in South Korea reached its peak in September, which aligned with the spread of the AY.69 variant. During this time, the South Korean government imposed the highest level of social distancing, and the total incidence gradually decreased. The AY.69 variant was partly replaced by the AY.122.5 Delta variant since October 2021 ().
Figure 1. Prevalence of SARS-CoV-2 variants in South Korea (a) SARS-CoV-2 lineage proportion in South Korea during the study period. (b) Delta VOC prevalence over the study period. Grey shaded bars indicate variant incidences per 100,000 people. The red boxes denote periods of increased social distancing (17 July–31 October 2021 and 21 December 2021–18 February 2022, respectively). The yellow box represents the period of eased social distancing (1 November 2021–20 December 2021). The black arrow indicated the start of second round of two-dose vaccination (14 October 2021).
The correlation between regional incidence rates and the number of sequences
As 74.77% of infections took place in the South Korean metropolises of Seoul, Gyeonggi, and Incheon during the study period between May 2021 and January 2022, we focused the sampling frequency in these regions (52.49%) during that time. The geographical distribution of the sequence data corresponded with the outbreak sizes for each region, showing high correlation coefficient of 0.86 ((a–c)).
Figure 2. Distribution of samples and sequences for each region and immune status. (a) Distribution of cumulative incidence of SARS-CoV-2 among regions and the number of sequences for each region from 14 May 2021 to 22 January 2022. (b) Correlation between the proportion of the number of AY.69 sequences in the 642 dataset and the proportion of incidence of various regions of South Korea. The sizes of circles represent the number of sequences. (c) The number of sequences for each region per month in our 642 AY.69 dataset (d) Proportions of immune groups in our 642 AY.69 dataset (bar graph) with cumulative vaccination rates in South Korea (line graph). The cumulative rate for the partially vaccinated group also accounts for those who have proceeded to become fully vaccinated. (e) The number of sequences for each immune status per month in our 642 AY.69 dataset. FV, fully vaccinated; NV, non-vaccinated; PV, partially vaccinated. BS, Busan; CB, Chungbuk; CN, Chungnam; DG, Daegu; DJ, Daejeon; GB, Gyeongbuk; GN, Gyeongnam; GG, Gyeonggi; GW, Gangwon; IC, Incheon; JJ, Jeju; JN, Jeonnam; SJ, Sejong; SU, Seoul; US, Ulsan. R2, the correlation coefficient; and p-values indicating the level of statistical significance, where *** P < 0.01, ** P < 0.05, and * P < 0.1.
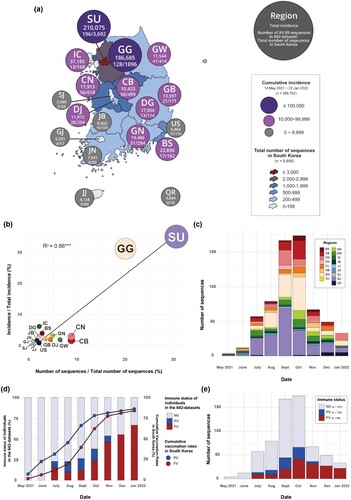
The vaccination programme in South Korea commenced on 26 February, with more than 70% of the population being fully vaccinated by 23 October [Citation42]. The first breakthrough infection in South Korea occurred on 21 May 2021, and the initial sequencing of samples from partially or fully vaccinated individuals started in July 2021. In July, approximately 77% of infected individuals were non-vaccinated, and around 7% were partially vaccinated, while the remainder were fully vaccinated. However, since November, over 70% of the population has been fully vaccinated, and the sequence data predominantly consists of breakthrough infections ((d)).
Spread of AY.69 variant from Seoul and Gyeonggi
The most recent common ancestor of the Korean AY.69 variant is estimated to have emerged on 22 April 2021 (95% highest posterior density [HPD]: 1 April to 10 May), suggesting that the AY.69 variant likely emerged several weeks before detection. The estimated effective virus population size (Ne), which represents the genetic diversity within the viral population, increased until mid-July, reached a plateau, and then declined from December 2021. The effective population size of viruses peaked on 25 July, just before an increase in social distancing on 27 July 2021 ((a)).
Figure 3. Effective population size of AY.69 from May 2021 to January 2022 and phylogeography analysis in South Korea. (a) Bayesian skyline plot of effective population size of AY.69. X-axis, time in months; y-axis, logarithmic effective population size. Red line, median; blue shaded area, 95% highest posterior density. (b) Phylogenetic tree of AY.69 depicting maximum clade credibility summary of Bayesian inference. (c) Chord diagram of between-region transmission events. Chords distant from the edge represent influxes. Chord width indicates the number of flows. (d) Several captured animations of viral-spread routes and magnitudes in SpreaD3 of Supplementary Video 1. Colours indicate regions. BS, Busan; CB, Chungbuk; CN, Chungnam; DG, Daegu; DJ, Daejeon; GB, Gyeongbuk; GN, Gyeongnam; GG, Gyeonggi; GW, Gangwon; IC, Incheon; JJ, Jeju; JN, Jeonnam; SJ, Sejong; SU, Seoul; US, Ulsan. Ne, effective population size.
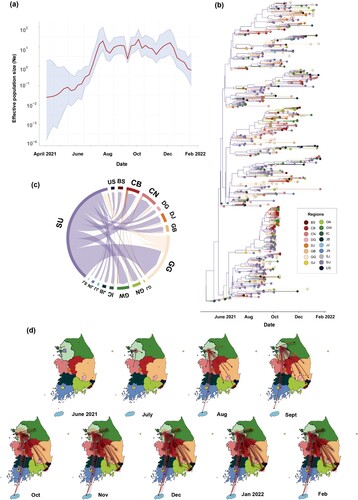
Using ancestral reconstruction with Bayesian phylogenetic analyzes, we identified spatiotemporal diffusion patterns between regions in South Korea. Between-region transmissions were measured using Markov jump counts. Based on the posterior average ratios of introduction in each region, dispersal between metropolises facilitated the spatial transmission of the AY.69 variant on 8 May 2021, with the virus spreading primarily from Seoul, accounting for 276 (95% HPD: 222–322) of the 331 (95% HPD: 235–438) outfluxes. The largest dissemination was from Seoul to Gyeonggi (82; 95% HPD: 72–92), followed by Seoul to Chungnam (31; 95% HPD: 25–37) ((b–d), Supplementary Video 1).
Non-vaccinated persons predominantly spread AY.69
Based on the ancestral reconstruction for vaccine history, non-vaccinated individuals were the primary drivers of the AY.69 variant’s spatial expansion from 23 April 2021, accounting for 154 (95% HPD: 140–168) of the total 171 outfluxes (95% HPD: 149–195). After July 2021, the most frequent viral transmission was observed from NV individuals to FV individuals, with an estimated 99 transmissions (95% HPD: 90-109). This was followed by transmissions from NV individuals to partially vaccinated (PV) individuals, with 55 estimated transmissions (95% HPD: 50–59; (a–b)).
Figure 4. Phylodynamic analysis of AY.69 lineage of SARS-CoV-2 between immune groups in South Korea. (a) Chord diagram of introduction events between immune groups. Chords distant from the edge represent influxes. Chord width indicates the number of flows. (b) Monthly numbers of transmissions among immune groups. (c) Maximum clade credibility summary tree of Bayesian inference.
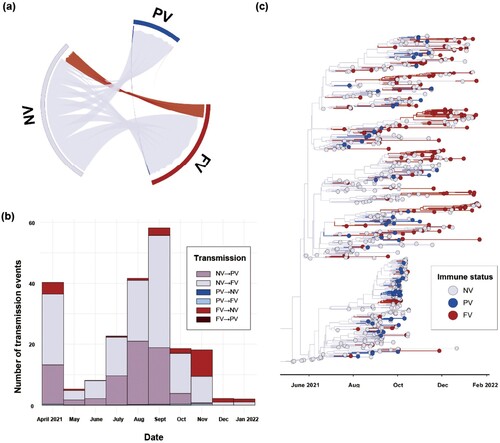
From 27 April 2021 to 11 January 2022, the primary source of viral dissemination was the NV population ((a)). As the vaccination schedule in South Korea peaked during summer (July to August 2021), and FV individuals exceeded 70% from 23 October 2021 [Citation43], large viral influxes shifted from NV to FV and PV on 6 June 2021, and 9 July 2021, respectively. The NV influx and outflow decreased after 4 September 2021 due to the absolute decline in the non-vaccinated population; the trend of the PV population was similar after 8 October 2021 ((b–c)).
Generalized linear model analysis of mobility data and phylogeography
We explored various potential predictors for viral transmission, including different mobility data, credit card consumption data, population density, vaccination rates, and inter-regional distances. Due to the high computational demand and time-consuming requirements of probabilistic inference, we explored several potential predictors using PhyCovA before integrating them into the phylodynamic analysis (Supplementary Figures 3 and 4) [Citation40]. Based on the associations between each factor and the number of transmissions between regions in PhyCovA, we selected the three most probable predictors: mobile phone mobility data, credit card data in the origin region, and vaccination rates in the destination region, in addition to the number of sequences (Supplementary Figures 2 and 3). To evaluate the potential impact of sampling bias, we considered the number of sequences for the origin and destination regions.
A GLM, without the number of sequences, suggested that total mobility between regions measured using mobile phones and credit card spending on entertainment positively affected viral spatial transmission in the dataset. The Bayes factors of credit card data and mobile phone mobility were >200. The mobile phone and card mobility coefficients were 0.97 and 1.13, respectively ((a), Supplementary Table 5).
Figure 5. The result of Generalized Linear Model (GLM) for without or with the number of sequences as a predictor. (a) GLM analysis of inter-region viral transmission and its predictors. (b) GLM analysis of inter-region viral transmission and its predictors including the number of sequences. Support for each factor is represented by an inclusion probability (right) and its contribution by the mean GLM coefficient on a log scale conditional on the predictor included in the model (left).
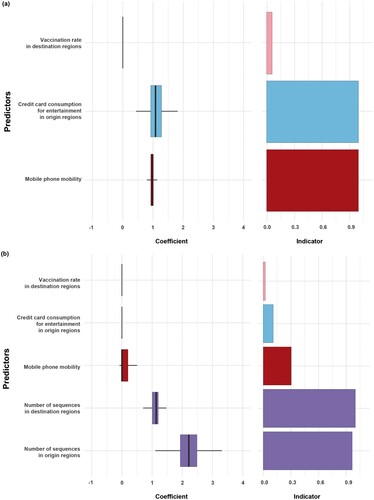
When we considered the number of sequences in the model, the Bayes factors for the number of sequences in the origin and destination regions were > 200 with positive coefficients of 2.17 and 1.1, respectively. Mobile phone mobility had a weak association (BF = 2.88) with a low positive coefficient (0.1). Other factors, such as credit card consumption and vaccination, had Bayes factors of < 1 ((b), Supplementary Table 6).
Validation of the phylogeography and GLM analysis
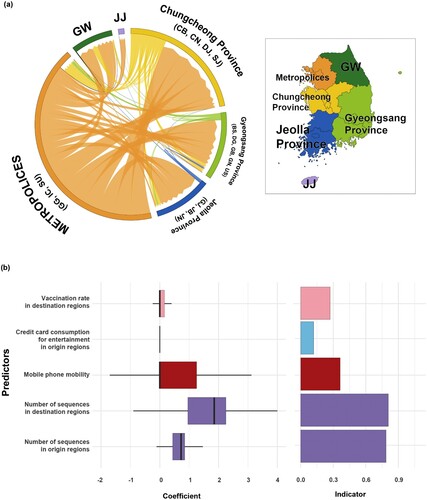
The tendency of the virus to spread predominantly from metropolitan areas was consistent across all validation analyzes, including (i) using 220 subsampled sequences from the original 642 sequences, (ii) using different partitions of sampling regions (combining 17 regions into 6 provinces) (), and (iii) using 10 different sets of 220 sequences excluding the 642 sequences used in our main analysis (Supplementary Figures 7–8).
Figure 6. Phylogeographic transmission analysis and GLM analysis for six provinces. (a) Chord diagram of between-province transmission events. Chords distant from the edge represent influxes. Chord width indicates the number of flows. Colours indicate regions. (b) GLM analysis of inter-provincial viral transmission. Support for each factor is represented by inclusion probability (right) and its contribution using the GLM coefficient on the log scale conditional on the predictor being included in the model (left). GW, Gangwon; JJ, Jeju.
The 220-subsampled sequences showed similar trends in the overall pattern of spread between regions (Supplementary Figure 5, Supplementary Video 2) and immune status (Supplementary Figure 6). Additionally, the phylogeographic analysis of 10 other datasets showed a similar pattern of viral spread, with the capital region remaining as the center of the epidemic (Supplementary Figures 7–8).
The GLM analysis using the subsampled dataset of 220 sequences also revealed that mobile phone mobility and credit card consumption data were positively correlated with the viral spread in South Korea (Supplementary Figure 9). When we excluded the number of sequences in the GLM analysis, the Bayes factors of mobile phone mobility and card consumption data were >200, and the coefficients were 0.90 and 1.75, respectively (Supplementary Figure 9(a), Supplementary Table 5). When we included the number of sequences in our GLM analysis, credit card consumption data had a small association (BF = 3.95) with a positive coefficient (0.8). Other factors, such as mobile phone mobility and vaccination, had Bayes factors of < 1 (Supplementary Figure 9(b), Supplementary Table 6). The number of sequences showed high Bayes factors (origin = >200, destination = 17.3).
The six provinces partitioned model, using the same 642 sequences as our main analysis, showed similar patterns. While the number of sequences still showed high Bayes factors (origin = 35.4, destination = 40.3), mobile phone mobility showed a Bayes factor of 5.49 with a positive coefficient of 0.55 ().
Discussion
We investigated the transmission of the COVID-19 Delta variant AY.69 in South Korea between regions and immune groups. Our data suggested that viral transmission began in late May from metropolitan regions, and these regions dominated viral spread throughout the study period (May 2021 to January 2022). Moreover, despite the rate of partial or complete vaccination exceeding 76% by 30 September [Citation44], non-vaccinated individuals significantly contributed to the virus dissemination across all immune groups. This trend became particularly evident during a spike in transmission among different immune status groups, further highlighting the role of non-vaccinated individuals as a primary source of viral transmission.
According to the GLM analysis, human mobility significantly influenced the spatiotemporal transmission of the SARS-CoV-2 AY.69 variant. Consistent with previous findings, human movement estimated based on mobile phone data correlated significantly with virus spread [Citation45], and substantial movement in metropolitan areas explained the spread from Seoul and Gyeonggi. Human mobility has been estimated based on various data sources, including bus, rail, and air travel [Citation46]. In South Korea, however, public transportation, such as buses and trains in Jeju Island, cannot be used to measure inflow and outflow. Thus, mobility data measured using mobile phones regardless of transportation mode could represent all human movement in South Korea, and the data showed high relevance with phylogeography results. We also measured credit card spending, which was related to phylodynamic movement. Other factors, such as population density and distances between regions, have been considered previously [Citation20,Citation47]. However, we predicted that these factors would have low relevance (Supplementary Figure 3).
Although an asymmetrical mobility matrix detected by mobile phones and credit card data has moderate Bayes factors when GLM includes the number of sequences as a predictor, they have significantly high Bayes factors when excluding the number of sequences. The result indicated the high impact of the number of sequences in our analysis. However, due to the imbalanced human population and incidence case distribution in South Korea, the effect of the number of sequences cannot be avoided. In fact, the high consistency between incidence cases and the number of sequences indicates that our dataset could represent the overall outbreak in South Korea ((b)).
Our findings should be interpreted with caution because the sequencing frequency over the study period was about 4% of the total infections in South Korea [Citation47], and we down-sampled from selected genetic sequence data for effective computation. Thus, the role of un-sampled or less-sampled infections might have been missed in this study. In addition, the GLM result showed that our data have an imbalanced number of sequences that can affect the phylogeographic result. However, as metropolitan regions are densely populated, these regions had high incidence rates throughout the pandemic; thus, regionally imbalanced numbers of sequences are inevitable. The pandemic was characterized by a concentration of infections in metropolitan areas such as Seoul and Gyeonggi (74.77% during the study period), which accounted for 52.49% of AY.69 sequences in our data. Our sequence data have a similar distribution to the COVID-19 cases in the country ((a–b)), which suggests that the data accurately represent the actual outbreak data in South Korea, and the results show the most reliable transmission pattern of COVID-19 within the nation. However, we cannot entirely exclude the possibility of sampling bias, and the result may not reflect all cases. Advances in sequencing technology and analysis tools for large-scale genomic data will help overcome this limitation of current genomic epidemiology.
We conducted validation analyzes using multiple different datasets to confirm the results of our phylodynamic study and consistently found similar results indicating that metropolitan regions were the primary site of viral spread and that mobile phone mobility and credit card consumption data were positively correlated with viral spread. These findings validate the robustness of our dataset and the models used in this study.
Our results suggested that transmission surged significantly when the new viral lineage emerged in metropolitan regions of South Korea or among non-immunized populations. As a result, detecting the initial presence of the virus in metropolitan regions and non-immunized populations would be essential for anticipating subsequent large outbreaks in the Korean peninsula. Moreover, the strong correlation between human mobility and inter-regional viral transmissions suggests that mobility data could be utilized to create predictive models for viral spread. Ongoing epidemiological analyzes are necessary for the effective control of SARS-CoV-2 and future pandemics.
Supplemental Material
Download JPEG Image (1.3 MB)
Supplemental Material
Download MS Word (2.4 MB)Acknowledgements
The authors thank all those who assisted in the collection and transport of patient samples.
Disclosure statement
No potential conflict of interest was reported by the author(s).
Data availability statement
All the sequences used in the study were deposited to the GISAID (https://gisaid.org/), and the accession numbers (EPI numbers) were annotated in the Supplementary Table S1.
Additional information
Funding
References
- Li Q, Guan X, Wu P, et al. Early transmission dynamics in Wuhan, China, of novel coronavirus–infected pneumonia. N Engl J Med. 2020;382:1199–1207. doi:10.1056/NEJMoa2001316
- WHO Director-General’s opening remarks at the media briefing on COVID19. Published online Mar 11, 2020 [cited 2023 Jan 18]. Available at https://www.who.int/director-general/speeches/detail/who-director-general-s-opening-remarks-at-the-media-briefing-on-covid-19-11-march-2020.
- Kucharski AJ, Russell TW, Diamond C, et al. Early dynamics of transmission and control of COVID-19: a mathematical modelling study. Lancet Infect Dis. 2020;20:553–558. doi:10.1016/S1473-3099(20)30144-4
- SARS-CoV-2 Variant Classifications and Definitions. Published online April 26, 2022 [cited 2023 Jan 18]. Available at https://www.cdc.gov/coronavirus/2019-ncov/variants/variant-classifications.html.
- Sachs JD, Karim SSA, Aknin L, et al. The lancet commission on lessons for the future from the COVID-19 pandemic. Lancet. 2022;400:1224–1280. doi:10.1016/S0140-6736(22)01585-9
- Aggarwal D, Myers R, Hamilton WL, et al. The role of viral genomics in understanding COVID-19 outbreaks in long-term care facilities. Lancet Microbe. 2022;3:e151–e158. doi:10.1016/S2666-5247(21)00208-1
- Lemey P, Rambaut A, Drummond AJ, et al. Bayesian phylogeography finds its roots. PLoS Comput Biol. 2009;5:1000520. doi:10.1371/journal.pcbi.1000520
- Gangavarapu K, Latif AA, Mullen JL, et al. Outbreak.info genomic reports: scalable and dynamic surveillance of SARS-CoV-2 variants and mutations. Nat Methods. 2023;20:512–522. doi:10.1038/s41592-023-01769-3
- Lim S, Sohn M. How to cope with emerging viral diseases: lessons from South Korea’s strategy for COVID-19, and collateral damage to cardiometabolic health. Lancet Reg Health West Pac. 2023;30:100581. doi: 10.1016/j.lanwpc.2022.100581
- Lee H, Choi EH, Park YJ, et al. Short term impact of coronavirus disease 2019 vaccination in children in Korea. J Korean Med Sci. 2022;37:1–6. doi:10.3904/kjim.2021.277
- How Asia, Once a Vaccination Laggard, Is Revving Up Inoculations. The New York Times. Published online Sep 9, 2021 [cited 2022 Sep 22]. Available at https://www.nytimes.com/2021/09/30/business/economy/asia-covid-vaccinations.html.
- With the high participation and interest of the people, the first vaccination rate for COVID-19 has been achieved by 80% - the Korea Centers for Disease Control and Prevention (in Korean). Published online 29 Oct 2021. [cited 2022 Sep 22]. Available at https://www.kdca.go.kr/gallery.es?mid=a20503010000&bid=0003&b_list=9&act=view&list_no=145369&nPage=1&vlist_no_npage=1&keyField=&keyWord=&orderby=.
- Norheim OF. Protecting the population with immune individuals. Nature Med. 2020;26:823–824. doi:10.1038/s41591-020-0896-2
- Mortality Risk of COVID - Our World in Data [cited 2023 April 15]. Available at https://ourworldindata.org/mortality-risk-covid
- Republic of Korea Policy Briefing. (24 January 2022). Analysis of Omicron variant characteristics and preparedness for its spread (Regular briefing). Available at https://www.korea.kr/news/pressReleaseView.do?newsId=156492895
- Coronavirus Pandemic (COVID-19) - Our World in Data [cited 2022 Sep 22]. Available at https://ourworldindata.org/coronavirus.
- Prem K, Cook AR, Jit M. Projecting social contact matrices in 152 countries using contact surveys and demographic data. PLoS Comput Biol. 2017;13:e1005697. doi:10.1371/journal.pcbi.1005697
- Vrancken B, Zhao B, Li X, et al. Comparative circulation dynamics of the five main HIV types in China. J Virol. 2020;94(23):e00683–20. doi:10.1128/JVI.00683-20
- Lu L, Leigh Brown AJ, Lycett SJ. Quantifying predictors for the spatial diffusion of avian influenza virus in China. BMC Evol Biol. 2017;17(1):1–14. doi:10.1186/s12862-016-0845-3
- Wang P, Liu L, Nair MS, et al. SARS-CoV-2 neutralizing antibody responses are more robust in patients with severe disease. Emerg Microbes Infect. 2020;9:2091–2093. doi:10.1080/22221751.2020.1823890
- Snoeijer BT, Burger M, Sun S, et al. Measuring the effect of non-pharmaceutical interventions (NPIs) on mobility during the COVID-19 pandemic using global mobility data. NPJ Digit Med. 2021;4(1):81. doi:10.1038/s41746-021-00451-2
- Gibbs H, Liu Y, Abbott S, et al. Association between mobility, non-pharmaceutical interventions, and COVID-19 transmission in Ghana: A modelling study using mobile phone data. PLoS Global Public Health. 2022;2:e0000502. doi:10.1371/journal.pgph.0000502
- Bollen N, Artesi M, Durkin K, et al. Exploiting genomic surveillance to map the spatiotemporal dispersal of SARS-CoV-2 spike mutations in Belgium across 2020. Sci Rep. 2021;11:18580–18580. doi:10.1038/s41598-021-97667-9
- du Plessis L, McCrone JT, Zarebski AE, et al. Establishment and lineage dynamics of the SARS-CoV-2 epidemic in the UK. Science. 2021;371:708–712. doi:10.1126/science.abf2946
- Rambaut A, Holmes EC, O’Toole Á, et al. A dynamic nomenclature proposal for SARS-CoV-2 lineages to assist genomic epidemiology. Nature Microbiol. 2020;5:1403–1407. doi:10.1038/s41564-020-0770-5
- Khare S, Gurry C, Freitas L, et al. GISAID’s role in pandemic response. China CDC Weekly. 2021;3:1049–1051. doi:10.46234/ccdcw2021.255
- Aksamentov I, Roemer C, Hodcroft EB, et al. Nextclade: clade assignment, mutation calling and quality control for viral genomes. J Open Source Softw. 2021;6:3773. doi:10.21105/joss.03773
- Kearse M, Moir R, Wilson A, et al. Geneious basic: An integrated and extendable desktop software platform for the organization and analysis of sequence data. Bioinformatics. 2012;28:1647–1649. doi:10.1093/bioinformatics/bts199
- Marini S, Mavian C, Riva A, et al. Optimizing viral genome subsampling by genetic diversity and temporal distribution (TARDiS) for phylogenetics. Bioinformatics. 2022;38:856–860. doi:10.1093/bioinformatics/btab725
- Hadfield J, Megill C, Bell SM, et al. Nextstrain: real-time tracking of pathogen evolution. Bioinformatics. 2018;34:4121–4123. doi:10.1093/bioinformatics/bty407
- Price MN, Dehal PS, Arkin AP. Fasttree: computing large minimum evolution trees with profiles instead of a distance matrix. Mol Biol Evol. 2009;26:1641–1650. doi:10.1093/molbev/msp077
- Rambaut A, Lam TT, Carvalho LM, et al. Exploring the temporal structure of heterochronous sequences using TempEst (formerly path-O-Gen). Virus Evol. 2016;2(1): vew007. doi: 10.1093/ve/vew007
- Suchard MA, Lemey P, Baele G, et al. Bayesian phylogenetic and phylodynamic data integration using BEAST 1.10. Virus Evol. 2018;4(1):vey016. doi:10.1093/ve/vey016
- Bouckaert RR, Drummond AJ. Bmodeltest: Bayesian phylogenetic site model averaging and model comparison. BMC Evol Biol. 2017;17:1–11. doi:10.1186/s12862-017-0890-6
- Rambaut A, Drummond AJ, Xie D, et al. Posterior summarization in Bayesian phylogenetics using tracer 1.7. Syst Biol. 2018;67:901–904. doi:10.1093/sysbio/syy032
- Drummond AJ, Rambaut A. BEAST: Bayesian evolutionary analysis by sampling trees. BMC Evol Biol. 2007;7:1–8. doi:10.1186/1471-2148-7-214
- FigTree [cited 2022 Sep 23]. Available at http://tree.bio.ed.ac.uk/software/figtree/.
- Bielejec F, Baele G, Vrancken B, et al. Spread3: interactive visualization of spatiotemporal history and trait evolutionary processes. Mol Biol Evol. 2016;33:2167–2169. doi:10.1093/molbev/msw082
- Tourism in Korea Datalab (in Korean) [cited 2022 Sep 22]. Available at https://datalab.visitkorea.or.kr/datalab/portal/main/getMainForm.do.
- Blokker T, Baele G, Lemey P, et al. Phycova—a tool for exploring covariates of pathogen spread. Virus Evol. 2022;8(1):veac015. doi: 10.1093/ve/veac015
- Bozick BA, Worby CJ, Metcalf CJE. Phylogeography of rubella virus in Asia: vaccination and demography shape synchronous outbreaks. Epidemics. 2019 Sep;28:100346. doi:10.1016/j.epidem.2019.100346
- The nation. 70% of the nation has been vaccinated, setting the stage for a step-by-step daily recovery (in Korean). [cited 2022 Sep 22; accessed 2022 Sep 22]. Available at http://ncov.mohw.go.kr/tcmBoardView.do?brdId=3&brdGubun=31&dataGubun=&ncvContSeq=6033&contSeq=6033&board_id=312&gubun=ALL.
- He WT, Bollen N, Xu Y, et al. Phylogeography reveals association between swine trade and the spread of porcine epidemic diarrhea virus in China and across the world. Mol Biol Evol. 2022;39(2):msab364. doi:10.1093/molbev/msab364
- Korea Centers for Disease Control and Prevention COVID-19 vaccination: National Center for Mental Health (in Korean) [cited 2022 Sep 23]. Available at https://ncv.kdca.go.kr/.
- Lemey P, Ruktanonchai N, Hong SL, et al. Untangling introductions and persistence in COVID-19 resurgence in Europe. Nature. 2021;595:713. doi:10.1038/s41586-021-03754-2
- Bui CM, Adam DC, Njoto E, et al. Characterising routes of H5N1 and H7N9 spread in China using Bayesian phylogeographical analysis. Emerg Microbes Infect. 2018;7(1):1–8. doi:10.1038/s41426-018-0185-z
- Chen C, Nadeau S, Yared M, et al. CoV-Spectrum: analysis of globally shared SARS-CoV-2 data to identify and characterize new variants. Bioinformatics. 2022;38:1735–1737. doi:10.1093/bioinformatics/btab856