
 ?Mathematical formulae have been encoded as MathML and are displayed in this HTML version using MathJax in order to improve their display. Uncheck the box to turn MathJax off. This feature requires Javascript. Click on a formula to zoom.
ABSTRACT
Wastewater-based surveillance is a valuable approach for monitoring COVID-19 at community level. Monitoring SARS-CoV-2 variants of concern (VOC) in wastewater has become increasingly relevant when clinical testing capacity and case-based surveillance are limited. In this study, we ascertained the turnover of six VOC in Alberta wastewater from May 2020 to May 2022. Wastewater samples from nine wastewater treatment plants across Alberta were analysed using VOC-specific RT-qPCR assays. The performance of the RT-qPCR assays in identifying VOC in wastewater was evaluated against next generation sequencing. The relative abundance of each VOC in wastewater was compared to positivity rate in COVID-19 testing. VOC-specific RT-qPCR assays performed comparatively well against next generation sequencing; concordance rates ranged from 89% to 98% for detection of Alpha, Beta, Gamma, Omicron BA.1 and Omicron BA.2, with a slightly lower rate of 85% for Delta (p < 0.01). Elevated relative abundance of Alpha, Delta, Omicron BA.1 and BA.2 were each associated with increased COVID-19 positivity rate. Alpha, Delta and Omicron BA.2 reached 90% relative abundance in wastewater within 80, 111 and 62 days after their initial detection, respectively. Omicron BA.1 increased more rapidly, reaching a 90% relative abundance in wastewater after 35 days. Our results from VOC surveillance in wastewater correspond with clinical observations that Omicron is the VOC with highest disease burden over the shortest period in Alberta to date. The findings suggest that changes in relative abundance of a VOC in wastewater can be used as a supplementary indicator to track and perhaps predict COVID-19 burden in a population.
Introduction
In response to the high mutation rate of SARS-CoV-2, significant efforts have been directed towards monitoring the emergence of new variants since the beginning of the COVID-19 pandemic [Citation1]. So far, greater than 2110 SARS-CoV-2 lineages have been identified by the PANGO lineage system [Citation2], with a small sub-set of these identified by the WHO as variants of concern (VOC) for enhanced surveillance and containment because of the increased public health risk posed by these VOC. VOC may include one or more of the following features: increased transmissibility, severe clinical symptoms or course of illness, failure to be detected by diagnostic assays, escape from natural or vaccine-derived immunity and decreased susceptibility to therapeutics [Citation1]. As of October 2022, a total of five VOC has been identified by the WHO based on the global impact of these factors: Alpha (B.1.1.7), Beta (B.1.351), Gamma (P.1), Delta (B.1.617.2) and Omicron (B.1.1.529), including Omicron lineages BA.1 to BA.5 and further sub-lineages (e.g. BQ.1.1, XBB, recombinants). VOC monitoring with Wastewater-based surveillance (WBS) has provided unique perspectives about the nature of pandemic waves of VOC for a variety of communities.
In Alberta, Canada, the first case of SARS-CoV-2 was reported on 24 February 2020 [Citation3]. While an unprecedented level of personnel and public healthcare resources for testing a single pathogen were originally allocated by the province, testing capacity was overwhelmed during pandemic waves associated with different VOC, requiring periodic changes in testing strategy to maximize the effective use of health resources [Citation4]. The level of SARS-CoV-2 RNA in wastewater has mirrored daily new cases and the clinical testing positivity rate in Alberta. Thus, SARS-CoV-2 WBS has been used as a complementary line of evidence for health authorities, offering a more complete epidemiological picture of COVID-19 prevalence in community, [Citation5–10]. As Ciupeanu et al. [Citation11] reported that public health measures targeting the newly emerging VOC in the early phase of its spread can limit the size of the subsequent epidemic wave, early detection of VOC trends in wastewater may be extremely useful for supporting public health interventions.
SARS-CoV-2 WBS provides a valuable community-wide indication of COVID-19 infections that captures symptomatic, asymptomatic, and unreported COVID-19 infections. With adequate sample frequency and rapid sample analysis, WBS has the potential to identify changes in the SARS-CoV-2 wastewater load in almost real-time and indicate incidence of disease in a community ahead of some key clinical indicators [Citation12,Citation13]. WBS can also provide a comprehensive, objective, and reliable depiction of the relative proportion and genetic diversity of circulating SARS-CoV-2 independent of clinical testing, informing health officials on the time of emergence and the scale of spread of novel variants over time [Citation10,Citation12,Citation14,Citation15]. Both Next Generation Sequencing (NGS) as well as real-time reverse transcription quantitative PCR (RT-qPCR) based methods have been successfully implemented in several studies around the world to track SARS-CoV-2 and its VOC in wastewater [Citation10,Citation12,Citation14–16].
In Alberta, Canada, SARS-CoV-2 WBS was implemented in early May of 2020 during the first wave of the COVID-19 pandemic characterized by ancestral A and B lineages. This surveillance included 12 wastewater treatment plants (WWTPs) serving 10 major communities throughout the province with various sizes of catchment [Citation17]. SARS-CoV-2 RNA in wastewaters at these sites and indeed at other sites across Canada correlated well with clinically detected COVID-19 cases during the rise and fall of COVID-19 waves and demonstrated changes of COVID-19 disease burden in different communities [Citation17,Citation18]. As an extension of the Alberta study, we have used different RT-qPCR assays to detect the A/B ancestral and six different VOC lineages of SARS-CoV-2, enabling monitoring of their levels and temporal variations in wastewater. Samples were collected during Waves 1–6 of COVID-19 pandemic (24 months) from nine WWTPs in Alberta. The purposes of this study were (1) to assess and validate the performance of the specific RT-qPCR for their detection of VOC relative to NGS genomic assessments on the same run of selected batches of wastewater samples; and (2) to exploit the relationship between change of relative abundance of each VOC in wastewater and COVID-19 clinical test positivity rate to further our understanding of how different VOC influenced community transmission during the pandemic progression.
Materials and methods
Alberta COVID-19 pandemic information and wastewater surveillance on SARS-CoV-2
The surveillance on SARS-CoV-2 VOC in wastewater has included nine WWTPs serving eight municipalities across Alberta, Canada. Participating municipalities are: the City of Edmonton and its regional communities (two WWTPs representing Gold Bar and Alberta Capital Region Wastewater Commission), the City of Calgary (the largest one of three WWTPs), the cities of Red Deer, Lethbridge, Grande Prairie, Medicine Hat, and the towns of Banff and High River each served by a WWTP. The combined population served by these WWTPs is 3,043,864, which represents 69% of Alberta’s population (4,371,000).
Aggregate time series of reported clinical laboratory tests and test positivity rates by day, downloaded from the COVID-19 surveillance database of the Government of Alberta, was stratified by sewershed of corresponding WWTP based on local geographic areas’ mapping. The COVID-19 waves in Alberta were defined by Alberta Health and Alberta Health Services public health surveillance teams based on COVID-19 case numbers as follows: 1st wave (8 March−10 July 2020), 2nd wave (10 July 2020−25 February 2021), 3rd wave (25 February−1 July 2021), fourth (1 July−12 December 2021), fifth (12 December 2021–6 March 2022), and sixth (6 March 6–29 June 2022). Timeline of COVID-19 milestones and public health measures in Alberta is listed in Table S1 and the footnote.
Wastewater sample collection
Approximately 400 mL of post-grit, influent wastewater samples were collected from each WWTP as a 24-hour composite sample at a frequency of two to three times per week, from 10th May 2020 to 9th May 2022. Initially, samples were stored at −20°C in 500 mL bottles after collection until shipment to testing laboratory. After studies reported that storage at −20°C decreased viral RNA level in wastewater [Citation19], samples collected from February 2021 onwards were stored at 4°C and shipped twice weekly. Prior to 1 October 2021, samples were processed within 3 days of collection; after this time, samples were processed within 2 days of collection for nucleic acid extraction and PCR testing.
Sample concentration and RNA extraction
Wastewater concentration and RNA extraction were performed as previously described [Citation19]. Briefly, 100 mL sub-samples of wastewater were spiked with 104 infectious units of human coronavirus 229E for monitoring virus recovery. Samples were adjusted to pH 9.6–10 using 5N NaOH, mixed vigorously for 30 s, and then centrifuged at 4500 × g for 10 min to pellet solids. The liquid fraction was adjusted to pH 7–7.5 using 1.2N HCl and concentrated using a Centricon Plus-70™ filter with a pore size of 30 KDa (Merck Millipore, Carrigtwohill, Ireland). The concentrated sample was adjusted to a final volume of 1 mL by adding phosphate-buffered saline and stored at −70°C until RNA extraction. Viral RNA was extracted from ultrafiltration wastewater concentrates using the MagMAX™−96 Viral RNA isolation kit (Thermo Fisher Scientific Baltics UAB, Vilnius, Lithuania) and the King Fisher™ Flex Purification System (Thermo Fisher Scientific, Vantaa, Finland), using 400 µl of wastewater concentrate as input and 100 µl of elution buffer in the final elution step.
Detection of total SARS-CoV-2 by RT-qPCR assay
SARS-CoV-2 RNA detection and quantification in wastewater was performed by RT-qPCR with primers and probes targeting the N1 and N2 gene regions as previously described [Citation19]. Samples were tested in duplicate for each RT-qPCR target. A sample was considered to be positive when at least two out of the four RT-qPCR reactions were positive. SARS-CoV-2 levels were calculated and reported as the average of N1 and N2 levels. The limit of detection was 80 genomic copies per 100 ml described in detail in previous publication [Citation19].
VOC-specific RT-qPCR assays for detection and quantification of VOCs
Wastewater samples testing positive for SARS-CoV-2 (e.g. N1, N2) were subjected to further testing of VOC according to the timeline of emerging dates declared officially by WHO. From December 2020 to November 2021, depending on availability of RNA extract, samples were tested for Alpha (B.1.1.7), Beta (B.1.351), Gamma (P.1), Delta (B.1.617.2). From November 2021 to February 2022, samples were tested for Delta and Omicron and between February 2022 and May 2022 for Omicron BA.1 and BA.2. Each VOC-specific RT-qPCR reaction was prepared using 5 µl of template RNA and TaqManTM Fast Virus 1-Step RT–PCR Master Mix (Thermo Fisher Scientific Baltics UAB, Vilnius, Lithuania) in a final reaction volume of 10 µl. We have summarized oligonucleotide sequences and concentrations of primers and probes used for each VOC RT-qPCR assay published previously and/or based on personal communications in Table S2. The specific RT-qPCR for Omicron was initially set up using the N200 assay [Citation20,Citation21], and was later replaced with a 69/70 del and H69/V70 assays to detect BA.1 and BA.2 [Citation16]. Thermocycling conditions for Alpha, Beta, Gamma, and Omicron were as follows: reverse transcription at 50°C for 5 min, RT inactivation and initial denaturation at 95°C for 20 s, followed by 45 cycles of denaturation at 95°C for 3 s and annealing/extension at 60°C for 30 s. Thermocycling settings for Delta were similar as those used for the other VOC except that the temperature of the annealing/extension step was 55°C. All reactions were run in the ABI fast 7500. All runs included a non-template negative control of molecular grade RNAse-free water and a positive RNA control of the corresponding VOC. Positive RNA control of each VOC was prepared from total nucleic acid extracts of virus cultures with isolates of patient samples tested positive each for Alpha, Beta, Gamma and Delta variants kindly provided by M. Joyce, University of Alberta. Nucleic acid extract from clinical samples with Omicron infection confirmed by sequencing were used as positive controls for the testing of Omicron BA.1 and BA.2. The average concentration of SARS-CoV-2 RNA of each positive control was determined by performing 10 independent PCR runs using the N1 RT-qPCR assay [Citation19].
To quantify the concentration of each VOC in wastewater, an external standard curve prepared using six 10-fold dilutions of the positive RNA control of each variant was used for respective test run. Samples were considered positive when Ct values were below the y-intercept (Table S3). All assays presented good allele specificity during validation stages; nonspecific amplification caused by a cross-reactivity between VOC was observed only at concentrations above 2 × 10⁴ genome copies/100 mL wastewater, leading to 5–9 unit increases of Ct values, which did not impact the specificity of allele detection because of presence of low levels of SARS-CoV-2 RNA signal in wastewater in general. Mean PCR amplification efficiencies ranged from 98.30 to 107.90 (%). The Limit of detection (LOD) of the assay was 4, 10, 3, 8, 4 and 3 genomic copies per PCR for Alpha, Beta, Gamma, Delta, Omicron BA. 1 and Omicron BA.2, respectively (Table S3).
Next generation sequencing (NGS) was used to verify the results of VOC-specific RT-qPCR in a subset of 226 samples (approximately 8% of all positive samples). NGS was performed and analysed by the Genomics Core Facility at the National Microbiology Laboratory, Public Health Agency of Canada, Winnipeg, MB, Canada as previously summarized [Citation22]. The method of NGS, NGS platform, the data sharing and interpretation in details will be subjected to the Genomic Core Facility for future publications.
Data analysis and statistical analysis
Data calculation
Relative abundance was used to examine the emergence and spread of VOC over time. The universal detections and quantifications for N1 and N2 were not used as a denominator to calculate the relative abundance because of different sensitivity between N1 and N2 assays and the six VOC-specific assays. The relative abundance of a VOC was calculated as a percentage of its quantification level (genome copies/100 mL) over the total quantification level of all six VOC (A/B ancestral, Alpha, Gamma, Delta, Omicron BA.1 and Omicron BA.2 upon the time of emergence of each VOC):
(1)
(1) where Ri denotes the relative abundance of VOCi, and Ci denotes the quantification level for a specific VOCi. For the analysis of each sewershed, Ci is the quantification level of VOCi calculated using midpoint 7-day rolling average of genomic copies/100 mL of VOCi detected in that sewershed’s wastewater samples. When the data analysis is for the whole province, Ci is calculated as the population weighted quantification level of VOCi over all nine sewersheds.
(2)
(2) where Ci,Alberta is the estimated Alberta result of VOCi for a specific day, Cik is the corresponding VOCi level in wastewater of WWTPk (7-day rolling average), and Pk is the served population by WWTPk.
Statistics
Statistical analyses were performed using R software (version 4.1.0) for the results’ comparison of RT-qPCR assays with NGS. Significant differences in detection rate between RT-qPCR assays and NGS were estimated using McNemar’s mid-point p test as previously described [Citation23] to avoid exceeding the nominal type I error rate as our sample sizes were small to moderate and the number of discordant cases were fewer than 25 for most of the comparisons. NGS results were semi-quantitative with variants being reported either as consensus, confirmed subconsensus or probable subconsensus. Two different approaches were used to compare the results of NGS versus RT-qPCR assays: (1) was the VOC detected as consensus by NGS also detected by the VOC-specific RT-qPCR assay? and (2) were VOC detected by VOC-specific RT-qPCR also detected by NGS regardless of being identified as consensus, confirmed subconsensus or probable subconsensus? Samples that were tested by VOC-specific RT-qPCR but were not successfully generating NGS data due to poor sequence quality or low genome coverage (<20%) were still considered as VOC positive in the comparison due to expected limitations of NGS when working with wastewater with low virus concentrations. The percentage of agreement was calculated using this by the formula:
Spearman’s correlation coefficient (ρ) was used to explore the ranked correlation between the relative abundances of VOC in wastewater (9 WWTPs combined) and clinical COVID-19 test positivity rate in the population of corresponding sewersheds (population-weighted). Statistical significance level was set at p-value <0.05. A common way to describe the strength of correlation was adopted: 0.00–0.09 negligible, 0.10–0.39 low, 0.40–0.69 moderate, 0.70–0.89 strong, and 0.9–1.0 very strong was used to describe the findings of this study [Citation24].
Results
During this study’s 24-month period (10th May 2020–10th May 2022), a total of 2667 wastewater samples were collected and tested for SARS-CoV-2, of which 1911 (71.65%) tested positive for the N1 and N2 gene using SARS-CoV-2 RT-qPCR assay. Overall low positivity of detection on SARS-CoV-2 N1 and N2 in wastewater was due to negative results of a majority of samples tested in Waves 1 and 2 of COVID-19 in Alberta [Citation17]. Among those SARS-CoV-2 positive samples, 1711 (89.53%) were tested for at least 1 of 6 VOC by RT-qPCR: Alpha, Beta, Gamma, Delta, Omicron BA.1 and Omicron BA.2.
Performance of VOC-specific RT-qPCR assays versus NGS for VOC identification
The performance of the VOC-specific RT-qPCR assays was compared to the NGS analysis on the same 226 samples. VOC identified in NGS libraries was in good agreement in terms of % concordance with the relative abundance determined by VOC-specific RT-qPCR assays. VOC were detected in 200 samples (concordant positive results) whereas none of VOC were detected in 9 samples by both methods (concordant negative results), resulting in an overall agreement rate of 92.5% (). Among 17 samples with discordant results, the RT-qPCR-based methods did not detect Alpha (n = 2) and Delta (n = 9) while NGS did not detect Delta (n = 2), Omicron BA.1 (n = 3) and Omicron BA.2 (n = 1). A high agreement rate was achieved for both positive and negative concordance, showing the agreement rates: 97.4% for Alpha, 98.2% for Beta, 89.4% for Gamma, 84.7% for Delta, 89% for Omicron BA.1 and 92% for Omicron BA.2. The Alpha, Beta, Gamma, Omicron BA.1 and Omicron BA.2 RT-qPCR assays performed comparably to NGS; however, Delta had a significantly lower detection by the Delta-specific RT-qPCR assay compared to NGS (p < 0.01, p-mid McNemar’s test).
Table 1. Comparison between VOC-specific RT-qPCR assays and next generation sequencing for identification of VOC in wastewater.
Identification and quantification of Alpha, Beta, Gamma, Delta, Omicron BA.1 and Omicron BA.2 in wastewater using VOC-specific RT-qPCR assay
Alpha (B.1.1.7)
A total of 1063 wastewater samples collected were tested for Alpha by allele-specific RT-qPCR. The first positive detection appeared on 26 January 2021, whereas the first clinical case with Alpha was reported on 15 December 2020 from a recent traveller in Alberta [Citation25], approximately 30 days of delay by WBS (). The highest levels of Alpha, corresponding to the 75percentile and maximum, were 1.4 × 10³ and 6.7 × 10³ genomic copies/100 mL of wastewater, respectively, and were observed between 22 March and 24 May 2021, within the 3rd wave of COVID-19 in Alberta (February 25−1 July 2021). 85% of wastewater samples (334/401) collected during the 3rd wave were tested Alpha positive. Alpha began to decline in the beginning of July 2021 and disappeared from Alberta wastewater in November 2021 ().
Figure 1. Time trend of relative abundance of A/B ancestral, Alpha, Gamma, Delta, Omicron BA.1 and BA.2 and the levels of SARS-CoV-2 RNA (average of N1 and N2 gene) detected in wastewater, and COVID-19 test positivity rates. A percentage of relative abundance of A/B ancestral (dark-red line), Alpha (purple line), Gamma (green line), Delta (orange line), Omicron BA.1 (red line) and Omicron BA.2 (blue line) in wastewater estimated by VOC specific RT-qPCR (based on population weighted 7-day rolling data); the positivity rate (%) in clinical tests (black line) (population weighted 7-day rolling average); and population-weighted 7-day rolling average of SARS-CoV-2 N1/N2 levels (genomic copies/100 mL) in wastewater (grey area) of nine WWTPs in Alberta during Waves 1–6 of COVID-19 (indicated on top of the Figure by segmental dash line).
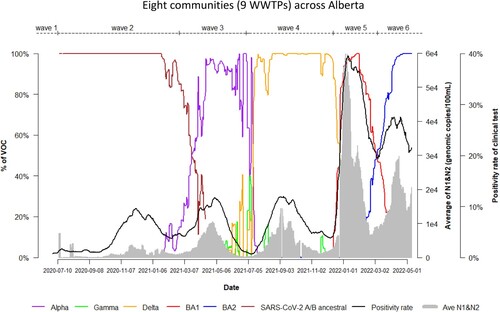
Table 2. Total wastewater samples tested by VOC-specific RT-qPCR, VOC positivity and levels in correspondence with Waves 3–6, and the dates of first identification of SARS-CoV-2 VOC in wastewater and clinical COVID-19 case with the VOC.
Beta (B.1.352)
A total of 897 wastewater samples collected were tested using the Beta-specific RT-qPCR assay but none of the samples tested positive for this VOC. Beta was undetectable by RT-qPCR in wastewater despite confirmed clinical cases of Beta being reported between January 2021 and July 2021 [Citation26,Citation27], corresponding from the end of 2nd to the beginning of 4th wave. The non-detection of Beta in wastewater was most likely because of a scant number of Beta cases in the province that reached a transient maximum detection rate of 5% until the end of July 2021 [Citation26].
Gamma (P.1)
A total of 1013 samples were tested using the Gamma RT-qPCR assay. Gamma was first detected in wastewater on 1 February 2021, 35 days earlier than the first COVID-19 case with Gamma (). The 75percentile and maximum levels of Gamma were 1.1 × 10² and 5.1 × 10² genomic copies/100 mL of wastewater, respectively, with the highest levels between 9 April and 26 May 2021. Gamma was detected in at least one wastewater sample collected every sampling day across the province during the second half of 3rd wave and first half of 4th wave (). 25% of wastewater samples (89/363) collected from 7 out of the 9 WWTPs during the 3rd wave tested positive for Gamma while Gamma was not detected in wastewater samples collected from the two WWTPs serving Lethbridge and High River over this period of time. Gamma was not detected in wastewater after November 2021. Gamma was first diagnosed among COVID-19 cases in early March in Alberta and reached a maximum of 11% on 3 July 2021; and then declined to approximately 1% by the beginning of August 2021. The last COVID-19 case with Gamma was reported on 4 September 2021 in the province [Citation26].
Delta (B.1.617.2)
Overall, 1562 wastewater samples were tested by the Delta-specific RT-qPCR. Delta was first detected in wastewater 2 April 2021. 73% of wastewater samples collected (290/399) during the 4th wave were tested Delta positive. The highest levels of Delta in wastewater corresponding to 75percentile and the maximum were 8.4 × 10² and 2.9 × 10³ genomic copies/100 mL of wastewater, respectively, observed between July 22 and 12 December 2021 during the 4th wave of COVID-19 in Alberta (July−December 2021). Delta began to decline in the mid of December 2021 and disappeared from Alberta wastewater in February 2022 (). In agreement with this, the first clinical case of Delta in Alberta was reported on 8 April 2021 and increased to 90% by early August 2021 [Citation26,Citation27].
Omicron (BA.1 and BA.2)
A total of 534 wastewater samples were tested for Omicron BA.1. and 358 for Omicron BA.2 up to May 2022. Omicron BA.1 was first detected in Alberta wastewater on 27 November 2021 and Omicron BA.2 on 31 January 2022, respectively. Since the S 69/70 del assay was implemented to detect BA.1, the samples with positive of the N200 assay before 31 January 2022 were re-run retrospectively and the results were confirmed as Omicron BA.1. The first clinical cases of BA.1 in Alberta was reported on 18 October 2021 and the first BA.2 case in 2 December 2021 [Citation26]. The level of BA.1 at the 75percentile and maximum were 3.5 × 10³ and 1.4 × 10⁴ genomic copies/100 mL of wastewater, respectively, between 26 December 2021 and 2 April 2022 (mostly within the 5th wave) while the level of BA.2 at the 75percentile and maximum were 1.1 × 10⁴ and 1.9 × 10⁴ genomic copies/100 mL of wastewater, respectively, between 26 March and 1 May 2022 (the 6th wave). 96% of wastewater samples collected (298/309) during the 5th wave were tested BA.1 positive and 100% of wastewater samples collected (243) during the 6th wave tested BA.2 positive. Predominant SARS-CoV-2 VOC were Omicron BA.1 and BA.2 during the 5th and 6th COVID-19 pandemic waves in Alberta.
Mixture of VOC
Mixed presence of VOC in the same wastewater sample was frequently detected in this study, including Alpha, Gamma, and Delta (n = 4), Alpha and Gamma (n = 93), Alpha and Delta (n = 28), Delta and Gamma (n = 15), Delta and Omicron BA.1 (n = 113), and Omicron BA.1 and Omicron BA.2 (n = 122).
Dynamics of the relative abundance of SARS-CoV-2 VOC in wastewater quantified by VOC-specific RT-qPCR assay
The number of days required for each SARS-CoV-2 VOC to reach the relative abundance of 20%, 50%, 90% and the highest in wastewater represent the speed of VOC transmission and the magnitude of infections in communities. Temporal changes of the relative abundance for each VOC in wastewater was summarized in . Omicron BA.1 took only 21, 28 and 35 days to reach a relative abundance of 20%, 50% and 90% in wastewater, respectively, after its first detection in wastewater whereas Omicron BA.2 took 13, 32 and 62 days to reach the same relative abundance in wastewater, respectively. Omicron BA.1 took approximately a half of the time to reach the abundant levels of 90% in wastewater compared to Omicron BA.2, indicating that Omicron BA.1 spread fast and infected a large proportion of the population in communities. Based on the very early detection of Delta at low levels, this VOC took the longest times to reach each corresponding levels of relative abundance followed by Alpha and Omicron BA.2. Gamma had reached 20% relative abundance in wastewater by 153 days, with the highest relative abundance of 29% only after its emergence.
Table 3. Days required for SARS-CoV-2 VOC to reach the defined levels of relative abundances (%) in wastewater after its first detection.
An association between relative abundance of each VOC in wastewater and clinical COVID-19 testing positivity rates was observed ( and ). Spearman’s correlation analysis showed that clinical COVID-19 test positivity rate had a very strong correlation with Omicron BA.1 (ρ = 0.95) during Wave 5, and a moderate correlation with Delta (ρ = 0.61) during Wave 4 and Omicron BA.2 (ρ = 0.53) during Wave 6, respectively. The correlations of A/B ancestral and Alpha in wastewater with clinical positivity testing rates were relatively low (ρ = 0.39 and ρ = 0.30) during the wave 2 and 3.
Table 4. Correlation of the relative abundance of predominant VOC in wastewater with COVID-19 testing positivity rate of population in sewersheds served by nine WWTPs in total using Spearman’s correlation analysis.
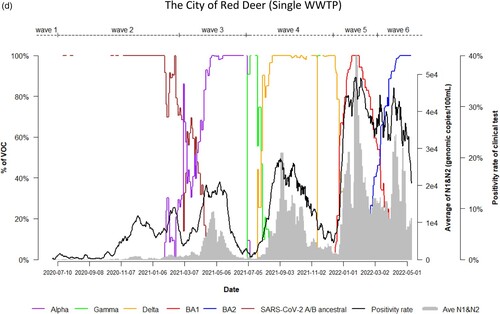
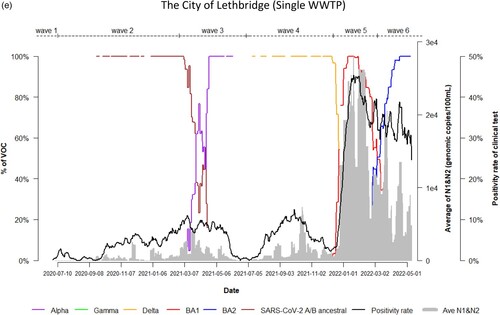
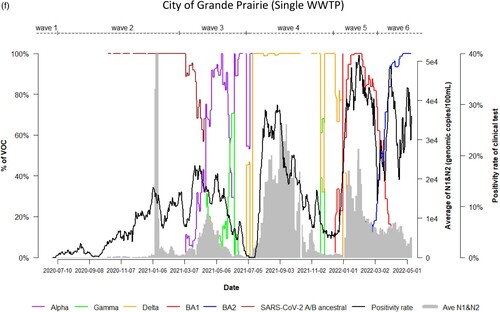
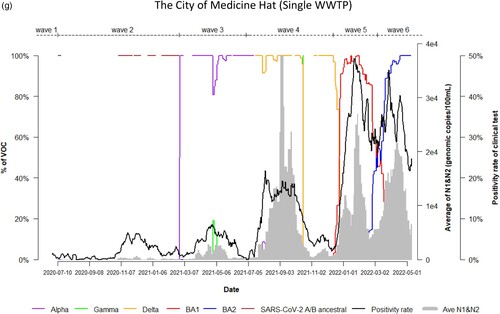
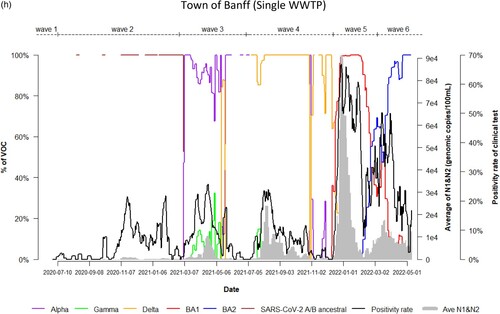
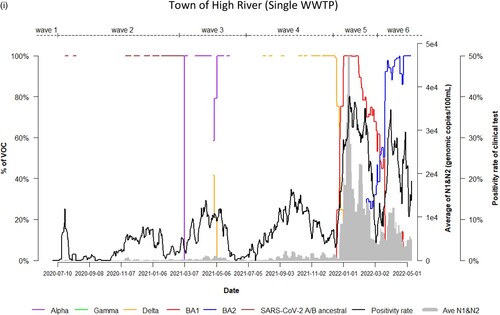
Dynamic changes of SARS-CoV-2 VOC in wastewater from 9 WWTPs represents the temporal trend of COVID-19 pandemic waves in Alberta. Variations in the emergence and temporal patterns of each SARS-CoV-2 VOC in different sewersheds in Alberta were also observed ((a–i)). For instance, Gamma was not detected by VOC-specific RT-qPCR assay in wastewater collected from Lethbridge and High River ((e,i)). However, it was particularly prevalent in wastewater from Red Deer and Grande Prairie, where the highest relative abundances were 100% and 70%, respectively ((d,f)). During the 3rd wave of COVID-19 in Alberta, SARS-CoV-2 A/B ancestral was still detected in the relative abundances (20%–80%) in wastewater in most sewersheds while the relative abundance of Alpha had increased rapidly in wastewater (from 5% to 100%), predominating the 3rd wave in Lethbridge and Grande Prairie communities. Furthermore, COVID-19 positivity rates and SARS-CoV-2 RNA levels in wastewater were not clearly resolved between the 5th and 6th waves although shift of the relative abundance of SARS-CoV-2 VOC from BA.1 to BA.2 was obviously observed in both communities of Lethbridge and Grande Prairie ((e,f)).
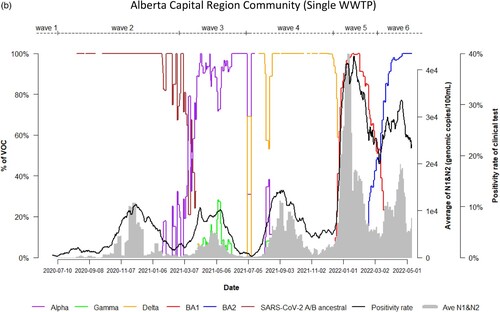
Figure 2. (a) Time trend of relative abundance of A/B ancestral, Alpha, Gamma, Delta, Omicron BA.1 and BA.2 and the levels of SARS-CoV-2 RNA (average of N1 and N2 gene) detected in wastewater, and COVID-19 test positivity rates. A percentage of relative abundance of A/B ancestral (dark-red line), Alpha (purple line), Gamma (green line), Delta (orange line), Omicron BA.1 (red line) and Omicron BA.2 (blue line) in wastewater estimated by VOC specific RT-qPCR (based on 7-day rolling data); the positivity rate (%) in clinical tests (black line) (based on 7-day rolling data); and average SARS-CoV-2 N1/N2 levels (genomic copies/100 mL) in wastewater (grey area) in the WWTP of the City of Edmonton during Waves 1–6 of COVID-19 (indicated on top of the Figure by segmental dash line). (b) Time trend of relative abundance of A/B ancestral, Alpha, Gamma, Delta, Omicron BA.1 and BA.2 and the levels of SARS-CoV-2 RNA (average of N1 and N2 gene) detected in wastewater, and COVID-19 test positivity rates. A percentage of relative abundance of A/B ancestral (dark-red line), Alpha (purple line), Gamma (green line), Delta (orange line), Omicron BA.1 (red line) and Omicron BA.2 (blue line) in wastewater estimated by VOC specific RT-qPCR (based on 7-day rolling data); the positivity rate (%) in clinical tests (black line) (based on 7-day rolling data); and average SARS-CoV-2 N1/N2 levels (genomic copies/100 mL) in wastewater (grey area) in the WWTP of Alberta Capital Region included in the metropolis of Edmonton during Waves 1–6 of COVID-19 (indicated on top of the Figure by segmental dash line). (c) Time trend of relative abundance of A/B ancestral, Alpha, Gamma, Delta, Omicron BA.1 and BA.2 and the levels of SARS-CoV-2 RNA (average of N1 and N2 gene) detected in wastewater, and COVID-19 test positivity rates. A percentage of relative abundance of A/B ancestral (dark-red line), Alpha (purple line), Gamma (green line), Delta (orange line), Omicron BA.1 (red line) and Omicron BA.2 (blue line) in wastewater estimated by VOC specific RT-qPCR (based on 7-day rolling data); the positivity rate (%) in clinical tests (black line) (based on 7-day rolling data); and average SARS-CoV-2 N1/N2 levels (genomic copies/100 mL) in wastewater (grey area) in the WWTP of the City of Calgary during Waves 1–6 of COVID-19 (indicated on top of the Figure by segmental dash line). (d) Time trend of relative abundance of A/B ancestral, Alpha, Gamma, Delta, Omicron BA.1 and BA.2 and the levels of SARS-CoV-2 RNA (average of N1 and N2 gene) detected in wastewater, and COVID-19 test positivity rates. A percentage of relative abundance of A/B ancestral (dark-red line), Alpha (purple line), Gamma (green line), Delta (orange line), Omicron BA.1 (red line) and Omicron BA.2 (blue line) in wastewater estimated by VOC specific RT-qPCR (based on 7-day rolling data); the positivity rate (%) in clinical tests (black line) (based on 7-day rolling data); and average SARS-CoV-2 N1/N2 levels (genomic copies/100 mL) in wastewater (grey area) in the WWTP of the City of Red Deer during Waves 1–6 of COVID-19 (indicated on top of the Figure by segmental dash line). (e) Time trend of relative abundance of A/B ancestral, Alpha, Gamma, Delta, Omicron BA.1 and BA.2 and the levels of SARS-CoV-2 RNA (average of N1 and N2 gene) detected in wastewater, and COVID-19 test positivity rates. A percentage of relative abundance of A/B ancestral (dark-red line), Alpha (purple line), Gamma (green line), Delta (orange line), Omicron BA.1 (red line) and Omicron BA.2 (blue line) in wastewater estimated by VOC specific RT-qPCR (based on 7-day rolling data); the positivity rate (%) in clinical tests (black line) (based on 7-day rolling data); and average SARS-CoV-2 N1/N2 levels (genomic copies/100 mL) in wastewater (grey area) in the WWTP of the City of Lethbridge during Waves 1–6 of COVID-19 (indicated on top of the Figure by segmental dash line). (f) Time trend of relative abundance of A/B ancestral, Alpha, Gamma, Delta, Omicron BA.1 and BA.2 and the levels of SARS-CoV-2 RNA (average of N1 and N2 gene) detected in wastewater, and COVID-19 test positivity rates. A percentage of relative abundance of A/B ancestral (dark-red line), Alpha (purple line), Gamma (green line), Delta (orange line), Omicron BA.1 (red line) and Omicron BA.2 (blue line) in wastewater estimated by VOC specific RT-qPCR (based on 7-day rolling data); the positivity rate (%) in clinical tests (black line) (based on 7-day rolling data); and average SARS-CoV-2 N1/N2 levels (genomic copies/100 mL) in wastewater (grey area) in the WWTP of the City of Grande Prairie during Waves 1–6 of COVID-19 (indicated on top of the Figure by segmental dash line). (g) Time trend of relative abundance of A/B ancestral, Alpha, Gamma, Delta, Omicron BA.1 and BA.2 and the levels of SARS-CoV-2 RNA (average of N1 and N2 gene) detected in wastewater, and COVID-19 test positivity rates. A percentage of relative abundance of A/B ancestral (dark-red line), Alpha (purple line), Gamma (green line), Delta (orange line), Omicron BA.1 (red line) and Omicron BA.2 (blue line) in wastewater estimated by VOC specific RT-qPCR (based on 7-day rolling data); the positivity rate (%) in clinical tests (black line) (based on 7-day rolling data); and average SARS-CoV-2 N1/N2 levels (genomic copies/100 mL) in wastewater (grey area) in the WWTP of the City of Medicine Hat during Waves 1–6 of COVID-19 (indicated on top of the Figure by segmental dash line). (h) Time trend of relative abundance of A/B ancestral, Alpha, Gamma, Delta, Omicron BA.1 and BA.2 and the levels of SARS-CoV-2 RNA (average of N1 and N2 gene) detected in wastewater, and COVID-19 test positivity rates. A percentage of relative abundance of A/B ancestral (dark-red line), Alpha (purple line), Gamma (green line), Delta (orange line), Omicron BA.1 (red line) and Omicron BA.2 (blue line) in wastewater estimated by VOC specific RT-qPCR (based on 7-day rolling data); the positivity rate (%) in clinical tests (black line) (based on 7-day rolling data); and average SARS-CoV-2 N1/N2 levels (genomic copies/100 mL) in wastewater (grey area) in the WWTP of Town of Banff during Waves 1–6 of COVID-19 (indicated on top of the Figure by segmental dash line). (i) Time trend of relative abundance of A/B ancestral, Alpha, Gamma, Delta, Omicron BA.1 and BA.2 and the levels of SARS-CoV-2 RNA (average of N1 and N2 gene) detected in wastewater, and COVID-19 test positivity rates. A percentage of relative abundance of A/B ancestral (dark-red line), Alpha (purple line), Gamma (green line), Delta (orange line), Omicron BA.1 (red line) and Omicron BA.2 (blue line) in wastewater estimated by VOC specific RT-qPCR (based on 7-day rolling data); the positivity rate (%) in clinical tests (black line) (based on 7-day rolling data); and average SARS-CoV-2 N1/N2 levels (genomic copies/100 mL) in wastewater (grey area) in the WWTP of Town of High River during Waves 1–6 of COVID-19 (indicated on top of the Figure by segmental dash line).


Discussion
The VOC-specific RT-qPCR assays were validated and implemented to survey and continuously monitor SARS-CoV-2 VOC in wastewater spanning six COVID-19 endemic waves in Alberta. VOC-specific qPCR assays, each targeting different clade-defining mutations [Citation28] of Alpha, Beta, Gamma, Delta, Omicron BA.1 and Omicron BA.2 allowed us to identify specific VOC, quantify their RNA levels and compare their relative abundance in wastewater. Our data and analyses showed a clear temporal trend of SARS-CoV-2 VOC-matched rise and fall of COVID-19 waves in Alberta [Citation26,Citation27], representing the COVID-19 prevalence and disease burden in the respective communities. The moderate to strong correlations were observed between the relative abundant levels of Delta, Omicron BA.1 and BA.2 in wastewater and COVID-19 positive testing rates in Waves 4–6 in Alberta. The fluctuations of SARS-CoV-2 VOC levels in wastewater were associated well with the levels of SARS-CoV-2 in wastewater detected by the RT-qPCR assays targeting to N1 and N2 gene in the previous WBS study [Citation17]. This study gives further evidence that WBS is a reliable and practical monitoring tool and can provide an unbiased and non-discriminating estimate of the prevalence of COVID-19 at the community level compared with clinical testing that was subject to test−seeking behaviours and testing policy changes. Interestingly, we observed that when the wastewater level of previously predominant VOC declined, a newly emerging VOC started to climb up for most of VOC except Gamma (Beta was not detected in wastewater in Alberta). The newly emerging VOC became another predominant strain and resulted in the next COVID-19 wave. The switch point between an existing and a newly emerging VOC can be used as an early indicator for a prospective COVID-19 wave [Citation29]. Continuing WBS with VOC-specific RT-qPCR assay and timely data analysis may be valuable for pandemic preparedness and public health responses. The information is also very informative for the public via an online dashboard (https://covid-tracker.chi-csm.ca).
The specificity of the VOC-specific RT-qPCR assays targeting six SARS-CoV-2 VOC are important to detect emerging VOC accurately and in a timely fashion. High PCR efficiencies and specificities were initially confirmed using specific positive control RNAs before we applied the assays for VOC detection in wastewater. Next generation sequencing was used to further examine the specificity of VOC-specific RT-qPCR assays. Very good agreement rates (85–97%) between NGS and VOC-specific RT-qPCRs were observed. Five of the six VOC RT-qPCR assays had the detectability comparable to that of NGS, with the Delta RT-qPCR assay showing slightly lower concordance. However, the performance of the Delta RT-qPCR was similar to other VOC-specific RT-qPCR assays when the positive control RNAs of cultured VOC were used for the assay validation. Thus, we assumed that efficiency of the Delta specific RT-qPCR assay was likely compromised by inhibitory substances in wastewater matrix as previously reported by others for similar PCR assays for VOC [Citation16]. The Delta RT-qPCR assay was particularly affected by inhibitory substances probably due to the design of its forward primer and probe sequences, which include an intentional nucleotide mismatch from the target template (the mismatch was introduced to make the primer more specific, and the probe less prone to secondary structures). The Beta RT-qPCR had all negative detection of the VOC in wastewater during Waves 3–6. NGS detected Beta in two samples with a “probable” sub-consensus VOC (e.g. not with 100% certainty) in the 3rd wave. Beta had a very low prevalence with a transient maximum detection rate of 1% during the week of 4 July 2021 in Alberta [Citation26]. That explained the negative results for Beta detection in wastewater.
One of attractive features of VOC-specific RT-qPCR assays in the context of WBS is its low cost and fast turnaround time compared to current NGS methods or their clinical counterpart. One wastewater sample provides population-based surveillance of VOC for a community. This allows for high-frequency testing in near real-time, thus providing greater precision and temporal analysis of SARS-CoV-2 phylodynamics. The time required for each VOC to reach various levels of relative abundance was compared in this study (). Omicron BA.1 took the shortest times to reach higher level of relative abundances in wastewater compared to Omicron BA.2, Alpha and Delta, implying clearly that speed of transmission and magnitude of infection by Omicron BA.1 in the community were unprecedented. This observation was supported by the largest numbers of clinical COVID-19 outbreaks and the highest positivity testing rates among patients with moderate and severe illness that occurred in the 5th wave in Alberta [Citation27]. The time required for the relative abundance of VOC in wastewater to reach an early 20% of threshold appears to provide a practical approach to measure the scale of VOC infection in a population, possibly allowing estimate of type of prospective wave and course of COVID-19 relevant to emerging VOC. This information is extremely valuable for local public health authorities to make decisions on planning healthcare resources, anticipating demand for hospital capacities, and designing and evaluating public health measures for COVID-19 control and preventions [Citation30,Citation31].
There was a clear trend that the 4 out of 6 COVID-19 pandemic waves in Alberta were each associated with the rise of newly emerging VOC, except for both waves 1 and 2 predominated by SARS-CoV-2 A/B ancestral. Important differences among the waves corresponding to different predominant variants were also observed. When Wave 3 (February–July 2021) was primarily caused by Alpha, others including Beta, Gamma and A/B ancestral continued to circulate in relatively low levels in wastewater. The relative abundance of Gamma in wastewater only started to increase after COVID-19 test positivity rates and numbers of active cases decreased (). Gamma was still sporadically detected during Wave 4 (July–December 2021) when the predominant variant was Delta. Differences of VOC in wastewater between communities were also seen. When either Alpha, Delta, Omicron BA.1 or BA.2 was the predominant VOC during Waves 3–6, respectively, in wastewater collected from most participating WWTPs, Gamma was detected at particularly high levels in Red Deer and Grande Prairie. However, Gamma was not detected in wastewater from Lethbridge and High River. This observation implies that community transmission and infection of Gamma were varied geographically [Citation29]. We reported previously that Omicron spread faster in the sewersheds with a larger population size than that in less populated communities [Citation21]. This may explain that high density of population in Red Deer (∼180,000) also facilitated Gamma’s transmission, causing increased levels of Gamma in wastewater in comparison to small community such as High River (∼17,000). Co-existence and dynamics of competition between Gamma, Alpha and Delta plus initiation of COVID-19 vaccination campaign during Wave 3 may also contribute to spatial discrepancy of Gamma in different communities [Citation32].
Timely and accurate identification of predominant SARS-CoV-2 VOC that might increase local disease burden is imperative for an effective public health response. Wastewater genomic surveillance was reported for monitoring SARS-CoV-2 lineage prevalence in other places [Citation29]. A novel sequence-based genomic surveillance of SARS-CoV-2 VOC could identify VOC and their related sublineages from wastewater samples and detect emerging VOC up to 14 days earlier than clinically reported cases caused by those VOC. However, we did not always observe early detection of VOC consistently in wastewater either by NGS or VOC-specific RT-qPCR prior to the first reported clinical cases with the VOCs, with the exception of Gamma and Delta (). We have previously reported that the given numbers of new COVID-19 cases were required in the sewershed before SARS-CoV-2 RNA signal could be detected in wastewater samples collected from the WWTP [Citation33]. On the other hand, wastewater genomic sequencing surveillance still has technical issues regarding optimization of sample concentration and haplotype recovery from a complex matrix. There are also challenges with intense labour requirement, typically longer turnaround times, expensive equipment, and specialized expertise. Furthermore, it is particularly difficult for NGS to achieve sufficient sequencing depth at clade defining genomic positions in wastewater samples which contain complex virus mixtures and fragmented viral genomes. In contrast, VOC-specific RT-qPCR represents a rapid turnaround and cost-effective method for monitoring VOC in wastewater. Quantitative PCR results support calculation of the relative abundance of VOC in wastewater and monitoring the change of relative abundances in a timely manner, providing useful information about the speed of transmission of VOC as well as the scale and burden of COVID-19 related to the VOC at a community level.
VOC-specific RT-qPCR assays are being used successfully for VOC identification globally, yet there are some limitations. The specific RT-qPCR assays need to be tailored to target specific signature mutations; as such, sequence information including the frequency of mutations is a prerequisite before specific primer-probe sets can be designed. Some mutations, such as the SN501Y mutation, are good targets for primer-probe design from a technical perspective but this mutation was also found in several VOC including Alpha, Beta and Gamma [Citation16]. Target selection during early stage of assay development is critical, as it determines the specificity and sensitivity of the assay. As SARS-CoV-2 evolves rapidly, the most notable challenge of using VOC-specific RT-qPCR assay for wastewater surveillance is to have primers and probes designed and available at minimal delay when a new SARS-CoV-2 VOC emerges. A possible interference on VOC-specific RT-qPCR assay by nonspecific amplification caused by a cross-reactivity of another VOC with an extreme high viral concentration in the sample should be kept in mind while this occurs rarely in the nature of wastewater-based surveillance on viral pathogens.
Conclusion
Using a set of VOC-specific RT-qPCR assays, we monitored dynamic changes of SARS-CoV-2 VOC in wastewater from eight communities during Wave 1–6 of COVID-19 pandemic in Alberta. As a practical and reliable method, VOC-specific RT-qPCR can be applied to track the emergence and subsequent spread of VOC, the relative abundance of VOC in wastewater, and the transitions of COVID-19 waves associated with different VOC. Analysis of the time required for each VOC to reach defined relative abundance provides insights on speed of transmission and the proportion of population infection by VOC in the community. This information is critical to assist decision-making by public health authorities for pandemic control and prevention. We anticipate that VOC surveillance in wastewater by specific designed RT-qPCR assays will become increasingly relevant during the current phase of the pandemic and post-pandemic era to monitor variants and predict its spread. Future studies should be focused on developing multiplex assays that can allow simultaneous detection of different VOC to improve the cost-effectiveness and turnaround times of the assay.
Supplemental Material
Download MS Word (45.9 KB)Acknowledgements
We thank the Alberta Precision Laboratory – Public Health Laboratory for their assistance with samples transportation and nucleic acid extraction. Our technical team including Melissa Wilson, Cassandra Ganje, Melissa Misutka, Parker Vanderz, Jenny Guo, Kyle Blacher for their technical support. Dr. M. Joyce at Li Ka-shing Institute of Virology, University of Alberta was acknowledged for providing us with the positive control RNAs of VOC. We thank the National Microbiology Laboratory (NML) Wastewater Genomic Surveillance team and the NML Genomics Core Sequencing Facility for the performance of NGS and sequence data analysis. We also thank Amy Colquhoun and Sydney Rudko in the COVID-19 surveillance team, Alberta Health for reviewing and providing valuable comments for this manuscript. This work would not have been possible without collaboration from provincial and municipal partners and WWTP operators in Calgary, Edmonton EPCOR, Alberta Capital Region Wastewater Commission, Grande Prairie, Red Deer, Banff, High River, Medicine Hat, and Lethbridge.
Disclosure statement
No potential conflict of interest was reported by the author(s).
Additional information
Funding
References
- World Health Organization (WHO). Guidance for surveillance of SARS-CoV-2 variants: Interim guidance. Geneva: WHO Headquarters; 2021. WHO reference number: WHO/2019-nCoV/surveillance/variants/2021.1
- Rambaut A, Holmes EC, O’Toole Á, et al. A dynamic nomenclature proposal for SARS-CoV-2 lineages to assist genomic epidemiology. Nat Microbiol. 2020;5:1403–1407. doi:10.1038/s41564-020-0770-5
- Kanji JN, Diggle M, Bulman DE, et al. Retrospective testing of respiratory specimens for COVID-19 to assess for earlier SARS-CoV-2 infections in Alberta, Canada. Off J Assoc Med Microbiol Infect Dis Canada. 2021;6:10–15.
- Pabbaraju K, Wong AA, Douesnard M, et al. A public health laboratory response to the pandemic. J Clin Microbiol. 2020;58:e01110–20. doi:10.1128/JCM.01110-20
- Ahmed W, Tscharke B, Bertsch PM, et al. SARS-CoV-2 RNA monitoring in wastewater as a potential early warning system for COVID-19 transmission in the community: a temporal case study. Sci Total Environ. 2021;761:144216. doi:10.1016/j.scitotenv.2020.144216
- Vo V, Tillett RL, Chang C-L, et al. SARS-CoV-2 variant detection at a university dormitory using wastewater genomic tools. Sci Total Environ. 2022;805:149930. doi:10.1016/j.scitotenv.2021.149930
- Daigle J, Racher K, Hazenberg J, et al. A sensitive and rapid wastewater test for SARS-COV-2 and its use for the early detection of a cluster of cases in a remote community. Appl Environ Microbiol. 2022;88:e01740-21. doi:10.1128/aem.01740-21
- Crits-Christoph A, Kantor RS, Olm MR, et al. Genome sequencing of sewage detects regionally prevalent SARS-CoV-2 variants. mBio. 2021;12:e02703-20. doi:10.1128/mBio.02703-20
- Graber TE, Mercier É, Bhatnagar K, et al. Near real-time determination of B.1.1.7 in proportion to total SARS-CoV-2 viral load in wastewater using an allele-specific primer extension PCR strategy. Water Res. 2021;205:117681. doi:10.1016/j.watres.2021.117681
- Lee WL, Armas F, Guarneri F, et al. Rapid displacement of SARS-CoV-2 variant Delta by Omicron revealed by allele-specific PCR in wastewater. Water Res. 2022;221:118809. doi:10.1016/j.watres.2022.118809
- Ciupeanu A-S, Varughese M, Roda WC, et al. Mathematical modeling of the dynamics of COVID-19 variants of concern: asymptotic and finite-time perspectives. Infect Dis Model. 2022;7:581–596.
- Agrawal S, Orschler L, Schubert S, et al. A pan-European study of SARS-CoV-2 variants in wastewater under the EU Sewage Sentinel System. medRxiv. 2021:25 [cited 2022 Oct 24]; doi:10.1101/2021.06.11.21258756
- Peccia J, Zulli A, Brackney DE, et al. Measurement of SARS-CoV-2 RNA in wastewater tracks community infection dynamics. Nat Biotechnol. 2020;38:1164–1167. doi:10.1038/s41587-020-0684-z
- Carcereny A, Martínez-Velázquez A, Bosch A, et al. Monitoring emergence of the SARS-CoV-2 B.1.1.7 variant through the Spanish national SARS-CoV-2 wastewater surveillance system (VATar COVID-19). Environ Sci Technol. 2021;55:11756–11766. doi:10.1021/acs.est.1c03589
- Lee WL, Gu X, Armas F, et al. Quantitative SARS-CoV-2 tracking of variants Delta, Delta plus, Kappa and Beta in wastewater by allele-specific RT-qPCR. medRxiv. 2021:27 [cited 2022 Oct 24]. doi:10.1101/2021.08.03.21261298
- Peterson SW, Lidder R, Daigle J, et al. RT-qPCR detection of SARS-CoV-2 mutations S 69–70 del, S N501Y and N D3L associated with variants of concern in Canadian wastewater samples. Sci Total Environ. 2022;810:151283. doi:10.1016/j.scitotenv.2021.151283
- Pang X, Gao T, Ellehoj E, et al. Wastewater-based surveillance is an effective tool for trending COVID-19 prevalence in communities: a study of 10 major communities for 17 months in Alberta. ACS ES&T Water. 2022;2:2243–2254. doi:10.1021/acsestwater.2c00143
- D’Aoust PM, Graber TE, Mercier E, et al. Catching a resurgence: Increase in SARS-CoV-2 viral RNA identified in wastewater 48 h before COVID-19 clinical tests and 96 h before hospitalizations. Sci Total Environ. 2021;770:145319. doi:10.1016/j.scitotenv.2021.145319
- Qiu Y, Yu J, Pabbaraju K, et al. Validating and optimizing the method for molecular detection and quantification of SARS-CoV-2 in wastewater. Sci Total Environ. 2022;812:151434. doi:10.1016/j.scitotenv.2021.151434
- Fuzzen M, Harper NBJ, Dhiyebi HA, et al. An improved method for determining frequency of multiple variants of SARS-CoV-2 in wastewater using qPCR assay. Sci Total Environ. 2023;881:163292. doi:10.1016/j.scitotenv.2023.163292
- Hubert CRJ, Acosta N, Waddell BJM, et al. Tracking emergence and spread of SARS-CoV-2 Omicron variant in large and small communities by wastewater monitoring in Alberta, Canada. Emerg Infect Dis. 2022;28:1770–1776. doi:10.3201/eid2809.220476
- Oloye F, Xie Y, Asadi M, et al. Rapid transition between SARS-CoV-2 variants of concern Delta and Omicron detected by monitoring municipal wastewater from three Canadian cities. Sci Total Environ. 2022;841:156741. doi:10.1016/j.scitotenv.2022.156741
- Smith P, Ruxton MQR, Ruxton GD. Effective use of the McNemar test. Behav Ecol Sociobiol. 2020;74:133. doi:10.1007/s00265-020-02916-y
- Schober P, Boer C, Schwarte LA. Correlation coefficients: appropriate use and interpretation. Anesth Analg. 2018;126:1763–1768. doi:10.1213/ANE.0000000000002864
- Everything you need to know about COVID-19 in Alberta on Monday, Dec. 28. CBC News (Calgary Ed.). 28 December 2020; Available from: https://www.cbc.ca/news/canada/calgary/alberta-covid-coronavirus-december-28-1.5855808.
- COVID-19 Alberta statistics - Interactive aggregate data on COVID-19 cases in Alberta. Alberta: Government of Alberta; 2022 [cited 2022 October 05]. Available from: https://www.alberta.ca/stats/covid-19-alberta-statistics.htm#variants-of-concern
- Pabbaraju K, Zelyas N, Wong A, et al. Evolving strategy for an evolving virus: Development of real-time PCR assays for detecting all SARS-CoV-2 variants of concern. J Virol Methods. 2022;307:114553. doi:10.1016/j.jviromet.2022.114553
- Hamed SM, Elkhatib WF, Khairalla AS, et al. Global dynamics of SARS-CoV-2 clades and their relation to COVID-19 epidemiology. Sci Rep. 2021;11:8435. doi:10.1038/s41598-021-87713-x
- Karthikeyan S, Levy JI, de Hoff P, et al. Wastewater sequencing reveals early cryptic SARS-CoV-2 variant transmission. Nature. 2022;609:101–108. doi:10.1038/s41586-022-05049-6
- Jernigan D. Update: public health response to the coronavirus disease 2019 outbreak — United States, 24 February 2020. MMWR Morb Mortal Wkly Rep. 2020;69:216–219. doi:10.15585/mmwr.mm6908e1
- Grubaugh ND, Hodcroft EB, Fauver JR, et al. Public health actions to control new SARS-CoV-2 variants. Cell. 2021;184:1127–1132. doi:10.1016/j.cell.2021.01.044
- Layton AT, Sadria M. Understanding the dynamics of SARS-CoV-2 variants of concern in Ontario, Canada: a modeling study. Sci Rep. 2022;12:2114. doi:10.1038/s41598-022-06159-x
- Li Q, Lee BE, Gao T, et al. Number of COVID-19 cases required in a population to detect SARS-CoV-2 RNA in wastewater in the province of Alberta, Canada: Sensitivity assessment. J Environ Sci. 2023;125:843–850. doi:10.1016/j.jes.2022.04.047