
 ?Mathematical formulae have been encoded as MathML and are displayed in this HTML version using MathJax in order to improve their display. Uncheck the box to turn MathJax off. This feature requires Javascript. Click on a formula to zoom.
ABSTRACT
Yearly epidemics of seasonal influenza cause an enormous disease burden around the globe. An understanding of the rules behind the immune response with repeated vaccination still presents a significant challenge, which would be helpful for optimizing the vaccination strategy. In this study, 34 healthy volunteers with 16 vaccinated were recruited, and the dynamics of the BCR repertoire for consecutive vaccinations in two seasons were tracked. In terms of diversity, length, network, V and J gene segments usage, somatic hypermutation (SHM) rate and isotype, it was found that the overall changes were stronger in the acute phase of the first vaccination than the second vaccination. However, the V gene segments of IGHV4-39, IGHV3-9, IGHV3-7 and IGHV1-69 were amplified in the acute phase of the first vaccination, with IGHV3-7 dominant. On the other hand, for the second vaccination, the changes were dominated by IGHV1-69, with potential for coding broad neutralizing antibody. Additional analysis indicates that the application of V gene segment for IGHV3-7 in the acute phase of the first vaccination was due to the elevated usage of isotypes IgM and IgG3. While for IGHV1-69 in the second vaccination, it was contributed by isotypes IgG1 and IgG2. Finally, 41 public BCR clusters were identified in the vaccine group, with both IGHV3-7 and IGHV1-69 were involved and representative complementarity determining region 3 (CDR3) motifs were characterized. This study provides insights into the immune response dynamics following repeated influenza vaccination in humans and can inform universal vaccine design and vaccine strategies in the future.
Introduction
Yearly epidemics of seasonal influenza cause an enormous disease burden around the globe, which is responsible for approximately 3–5 million annual cases of severe illness and 290,000–650,000 respiratory deaths [Citation1]. The annual spread of seasonal influenza virus is driven by the continuous evolution of the virus itself as a result of the interaction with the human immune system [Citation2,Citation3]. At present, although some non-pharmaceutical interventions can be taken to reduce the impact of influenza [Citation4,Citation5], massive vaccination is still the most effective way to prevent and control of influenza. However, due to the occurrence of antigen drift of influenza virus, if the strains used in the vaccine do not antigenically match to the circulating strains well enough, the effectiveness of the vaccine will be impacted and could be very low [Citation6,Citation7]. Therefore, vaccination should be updated every year according to the recommendations from WHO to maintain the proper immune protection for the population [Citation8]. But how the annual influenza vaccination affects the vaccine effectiveness remains unclear [Citation9,Citation10]. Several studies have shown that repeated seasonal influenza vaccination increases protection against influenza [Citation11–14]. However, some studies have reported that repeated influenza vaccination might attenuate effectiveness [Citation10,Citation15,Citation16]. An understanding of the immune response under long-term vaccination is still missing but could be critical for the better vaccination strategy [Citation10,Citation17].
Antibody production is the basic element of vaccine protection, in which B cells play a very important role. The high diversity of antibody repertoire represents the collection of an individual’s B-cell receptor (BCR) repertoire, which constitutes the essential component in the human adaptive immune system and plays a major role in providing broad and long-term protection for human bodies. Somatic recombination process called V(D)J recombination dominates the original diversity of BCR repertoire, and the insertion or deletion of nucleotides at the junctions of the gene segments further increase diversity [Citation18]. Upon encountering antigens, B cells are clonally expanded and undergo a process known as affinity maturation, in which improves antigen binding ability and selects B cells that encode productive high-affinity antibodies through somatic hypermutation (SHM) and class switch recombination(CSR) [Citation19,Citation20]. The dynamic changes for the global features of the BCR repertoires in response to different pathogens and vaccines, including BCR repertoire architecture, preference of V and J gene segments usage, length distribution of the complementarity determining region 3 (CDR3) sequences, SHM rate and immunoglobulin isotype switch, have important clinical and immunological significance, especially for better vaccine design and vaccine strategy optimization. It has been reported that immunoglobulin gamma (IgG), immunoglobulin mu (IgM), and immunoglobulin alpha (IgA) play important roles in influenza vaccine responses, with IgG playing a dominant role [Citation21] and IgG1 being the major subclass of IgG, followed by IgG2 and IgG3 [Citation21,Citation22]. The preferences of V gene segments usage are frequently observed. For instance, a longitudinal analysis revealed that immunization with TIV (2008/2009 trivalent inactivated vaccine) and 09 MIV (pandemic H1N1 monovalent inactivated vaccine) induced differential pattern of changes in the clonal frequency usage of IGHV1-69, IGHV3-7, IGHV4-39, and low SHM rates in IgG after 09 MIV immunization [Citation23]. The BCR repertoire architecture would also polarize follow an immune response or with aging [Citation24,Citation25].
Due to the limitation of low throughput and molecular resolution in early sequencing techniques, previous studies often focused on serological analysis. The advent of high-throughput sequencing (HTS), however, has enabled thorough and in-depth investigation of millions of BCR sequences at single nucleotide resolution, providing a new perspective to study immune BCR repertoires [Citation26,Citation27]. Bulk repertoire sequencing is still the popular approach and has broad applications in study of infectious diseases, vaccine immune response and other related fields [Citation28]. In recent years, several studies have examined the immune response following repeated influenza vaccination. A report with the serum antibody repertoire of one volunteer, who was vaccinated consecutively for 5 years with seasonal influenza vaccine, identified 24 persistent antibody clonotypes, and most were associated with conserved stem of Hemagglutinin (HA) for the group 1 influenza A virus (IAV) [Citation27]. Vollmers et al. analysed the BCR repertoires with repeated influenza vaccinations and found that some BCR sequences related to the influenza vaccine were present in both years, but only restrictedly presented within individuals [Citation29]. However, due to the complexity of the human immune system, it remains unclear how systematically the immune response, at the molecular level, changes over time and across individuals with repeated influenza vaccinations, and whether there are common rules that would be helpful for future vaccine optimization.
To figure out the changes in overall landscape of BCR repertoires after repeated vaccination, here, a cohort with vaccination of seasonal influenza was constructed, including 34 healthy volunteers, which were divided into vaccine group (16 volunteers) and control group (18 volunteers). Then the BCR repertoires were tracked through measures of the BCR diversity, CDR3 length distribution, architecture of BCR network, V and J gene segment usage, the SHM rate, isotypes and CSR at different sampling time points and compared the differences between the two groups. Those exploration should provide more insights on the dynamic change characteristics of BCR repertoires after repeated influenza vaccinations and advance the understanding of the related immune response.
Material and methods
Study design and volunteers
From November 2019, 34 healthy volunteers were undergraduates from Sun Yat-sen University, including 13 males and 21 females, aged from 18 to 27 years (Supplementary Table S1), were enrolled in this study and randomly assigned to the vaccine group (16, vg1–16) and the control group (18, cg1–18). Between November 2019 and December 2020, the vaccine group were received influenza vaccinations twice. During the first vaccination (2019), the vaccine group all were vaccinated against 2019 Quadrivalent inactivated influenza vaccine (QIV). While during the second vaccination (2020), eight in the vaccine group were vaccinated against 2020 QIV, others were vaccinated against 2020 trivalent inactivated influenza vaccine (TIV), which lacks the B/Yamagata lineage compared to 2020 QIV (Supplementary Table S2). The vaccination group was invited (after signing an informed consent document) to donate three peripheral blood samples: one before the vaccination (day 0), and the others on days 7, 28 after the vaccination, and the control group was invited to donate one peripheral blood samples: the same time as the time in the vaccine group before the vaccination (day 0). Prior to each peripheral blood collection, a questionnaire was administered to the volunteers, revealing that none of them were infected with the influenza virus or SARS-CoV-2 during the two vaccination periods, and none exhibited symptoms of influenza-like illness. All study procedures were approved by the Research Ethics Committee of School of Public Health (Shenzhen), Sun Yat-sen University, China (Ethical approval No.2019 (007)).
BCR repertoire preparation
The BCR repertoire preparation involved four steps: peripheral blood mononuclear cells (PBMCs) isolation, RNA extraction, reverse transcription, and PCR amplification. The samples were prepared as described previously [Citation30]. In brief, 10 ml of blood was drawn from each sample, first, PBMC cells were obtained by Ficoll-Paque density centrifugation. Total RNA extraction from PBMCs was performed using RNeasy Mini Kit (Qiagen, 74104), according to the manufacturer's protocol. Then, using a SMARTer RACE (Rapid Amplification of cDNA Ends) cDNA Amplification Kit (Clontech, 634928), one microgram of RNA was used as a template for reverse transcription into cDNA. According to the previously described method for preparing the BCR repertoire [Citation30], the BCR repertoire of the samples was amplified using four pairs of primers specific to IgG, IgM, IgA, and IgD. The primer sequences can be found in Supplementary Table S3. The four IgG, IgM, IgA, and IgD PCR products from each sample were pooled and then purified by the NucleoSpin Gel extraction kit (Macherey-Nagel, 704609.250) and stored in 35 μl enzyme free water. The concentration of purified PCR products was detected by the Qubit 4.0 fluorometer (ThermoFisher Scientific). Then, 500 ng of the purified PCR products of each sample was sent to the Illumina Hi-Seq2500 platform at Novogene Genomics Co. Ltd. (Beijing) for pair-end (PE) 250 sequencing.
Preprocessing of sequencing data
High-throughput sequencing of each sample generated approximately 10,000,000 raw sequences. The raw sequences were filtered by fastp [Citation31] software to obtain high-quality clean data. The paired reads were removed if the N content in either sequencing read exceeded 10% of the base number of the read, or if the number of low-quality (Q < = 5) bases contained in either sequencing read exceeded 50% of the number of bases in the read, or if either sequencing read contained adapter sequences. Then the clean data were preprocessed by MiXCR [Citation32] (version 2.1.12) software to obtain CDR3 sequences, as well as annotations for V and J gene segments, and isotypes. The parameters were as follows: –c IGH, –s hs, –OseparateByV = true, –OseparateByJ = true.
Clonal diversity
Clone was defined by 100% amino acid sequence identity of CDR3 read sequence with the same V and J gene segment [Citation33], while the abundance of each clone was defined by the number of reads the clone contained. The clonal diversity of BCR repertoire in each sample was calculated using Shannon’s entropy [Citation34]. Entropy was calculated as follows:
(1)
(1) where
is the number of all clones in each sample and
represents the abundance of the
th clone. The higher Shannon’s entropy, the more diverse the distribution of CDR3 clones.
BCR network construction and analysis
For each sample, the BCR network was constructed in such a way that each node represents a unique CDR3 clone sequence, and nodes were connected (by edges) when their Levenshtein distances of CDR3s is only 1(one amino acid substitution/insertion/deletion). The node size reflects reads number of each node (clone). The subnetworks in BCR network were called BCR clusters. Based on the graph theory, the following indicators were used to quantitatively evaluate the global characteristics of BCR network.
Average degree: The degree of a node was the number of edges connecting it to other nodes. So the average degree donated as was calculated by
(2)
(2) where
is the total number of edges and
is the total number of nodes.
Density: The density of a network with number of
nodes is defined as the ratio of the actual number of edges
to the maximum possible number of edges in the network which was calculated by
(3)
(3) Largest cluster proportion: Cluster
was defined as the subnetwork in network, where
represented the number of nodes in
. Then the largest cluster proportion referred to the ratio of the number of nodes in the largest cluster to the total number of nodes
in the network which was calculated by
(4)
(4) Assortativity coefficient: It was used to test the tendency of the nodes to connect with other nodes with similar degree values. The assortativity coefficient
is the Pearson correlation coefficient of the degrees at either ends of an edge and lies in the range
:
(5)
(5) where
is the joint probability distribution of the remaining degrees of the two nodes with degree
and degree
at either end of a randomly chosen edge, and
in undirected networks.
is the variance (standard deviation) of the distribution
and which was used to normalize when comparing networks.
SHM and CSR analysis
Somatic hypermutation (SHM) [Citation35] is a process in which high frequency point mutations accumulate in the BCR by antigen stimulation after gene rearrangement. To avoid overestimation of the SHM rate as a result of the aggregated mutations during B cell clonal expansion, only mutations for two sequences with only one nucleotide mismatch were counted [Citation36]. For each sample, all clones were grouped based on different V and J gene segments, and all mutations of one nucleotide mismatch were counted in each group. SHM rate per sample was calculated as the sum of SHM counts divided by the total number of assembled CDR3 bases, by doing this way to avoid the bias of unknown mutations outside partial CDR3 assembles. For the SHM rate of specific V gene segments and antibody isotypes, only the SHM counts within the corresponding group were considered.
Class switch recombination (CSR) [Citation37], in which the antibody isotype is altered (e.g. IgM to IgG), contributes to produce an antibody with different effector properties, without altering its antigen specificity. For each sample, the CSR events were counted by the number of clone pair with the same CDR3 sequence, V and J gene segment, but expressing two different antibody isotypes. The strength of a specific CSR at different phases was defined as the average value of the number of CSR events in each respective sample divided by the total number of clones in the same sample.
Sharing analysis
The definition used for the clone sharing was 100% identity CDR3 amino acid sequence plus same V and J gene segment usage. Two sharing types were used to represent different sharing scenarios: inner sharing (clones shared within same individual at different sampling time) and cross sharing (clones shared between different individuals at the same sampling time). The sharing level between two BCR repertoires was defined as overlap coefficient (OC) [Citation38] which was calculated by
(6)
(6) where
and
represent two BCR repertoires with sets of unique clones.
Public BCR clusters identification
All clones in each BCR repertoires in vaccine group were integrated together to a pool to clarify the convergent pattern of BCR repertoires in response to influenza vaccination. Clones in this pool were then divided into different subsets based on different V–J gene segment usage. Finally, same as the BCR network construction, clones were clustered into BCR clusters by the clustering threshold of Levenshtein distance was set to 1 for all pairs of clones in each subset. The public BCR clusters were defined as the BCR clusters contains all volunteers in vaccine group and all their sampling time points.
CDR3 motif
To screen out some shared common motifs related to vaccine response, clones in public clusters and related to the V gene segments (IGHV3-7 and IGHV1-69) expanded after vaccination were selected. Next, the length with the highest proportion was taken as the dominant length of the screening clones, and then used R package “ggseqlogo” to identify the motif of CDR3 with the same length [Citation39].
Statistical analysis
Statistical analyses were performed with R software (R version 4.2.0) and Python (version 3.9). Paired t test was used to analyse difference in clonal diversity, in SHM rate and in BCR network properties between different phases after vaccination in the vaccine group, as well as the differences at two time points in the control group. The t test was used to analyse difference in cluster size, in average length and in abundance between the public BCR clusters and other BCR clusters. Wilcoxon's signed-rank test was utilized to analyse the differences in length distribution and proportion of immunoglobulin isotypes between different phases after vaccination. Pearson correlation was used to evaluate the association in length frequency distribution among different samples, in distribution of V and J gene usage frequency among different samples and in V and J gene segments usage frequency distribution of public BCR clusters and of BCR repertoires in pre-vaccine phase. Mann–Whitney U test was employed to compare the differences in the overlap coefficient in each sharing pattern, clonal diversity, proportion of length groups, and SHM rate between the acute phase of the vaccine group and the control group at two time points. Additionally, the test was utilized to assess the differences between the SHM rate of other isotypes and the SHM rate of IgG1, as well as the difference in SHM rate between the acute phase and other phases in different immunoglobulin isotypes. Fisher’s exact test was used to assess differences in usage of V and J gene segments. In all analyses, statistical significance was tested, significance was defined as *P-value < 0.05; **P-value < 0.01; *** P-value < 0.001; not significant (ns): P-value > 0.05.
Results
Overview of the cohort and the high-throughput sequencing data
To investigate the dynamic changes of BCR repertoires following influenza vaccination, 34 healthy volunteers were recruited as the cohort in this study (Supplementary Table S1). All volunteers were undergraduates from Sun Yat-sen University living in similar circumstances during the study period, the volunteers have not received influenza vaccine in the past 5 years. Among these volunteers, 16 were annually vaccinated against influenza in November at a qualified community health service centre (vaccine group), whereas 18 were not vaccinated (control group); both groups of volunteers were followed continuously for 2 years (November 2019 to December 2020). During the first vaccination in 2019, the vaccine group received the 2019 Quadrivalent inactivated influenza vaccine (QIV). During the second vaccination in 2020, eight participants in the vaccine group received the 2020 QIV, while the remaining eight received the 2020 trivalent inactivated influenza vaccine (TIV), which lacks the B/Yamagata lineage compared to the 2020 QIV (Supplementary Table S2). At three time points, 0 day before vaccination (pre-vaccine phase), 7 days after vaccination (acute phase), and 28 days after vaccination (steady phase), 10 ml of peripheral blood was drawn from each volunteer in the vaccine group. For the control group, 10 ml of peripheral blood was drawn at 0 days (also defined as the pre-vaccine phase). Finally, a total of 132 samples were obtained and divided into 8 groups based on the sampling time: Vac.1st 0d, Vac.1st 7d, Vac.1st 28d, Vac.2nd 0d, Vac.2nd 7d, Vac.2nd 28d, Contr.1st 0d, Contr.2nd 0d ().
Figure 1. The overview of the cohort design and BCR repertoire characterization. A cohort with repeated vaccination of seasonal influenza was constructed, including 34 healthy volunteers, which were divided into vaccine group (16 volunteers) and control group (18 volunteers). The cohort was tracked continuously for 2 years, and the BCR repertoires at different sampling time points were subjected to high-throughput sequencing. Then the BCR repertoires were tracked through measures of CDR3 length distribution, architecture of BCR network, V and J gene segments usage, isotypes, class switch recombination (CSR) and BCR sharing at different sampling time points for two groups.
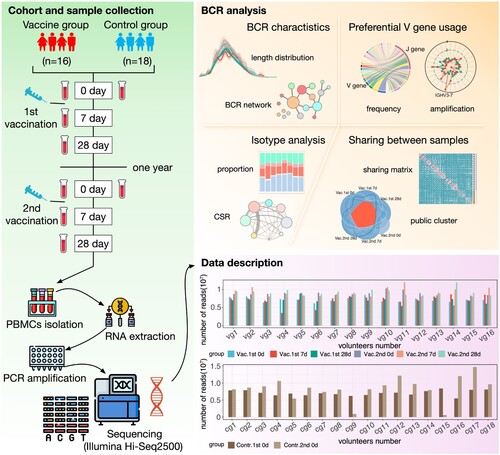
To implement high-throughput sequencing for BCR repertoires, 10 ml of peripheral blood was drawn from each recipient to obtain PBMCs every time and then generated approximately 10 million raw sequences per sample. After quality filtering and preprocessing by MiXCR [Citation32] (version 2.1.12) software, about 8.0 ± 1.8 million reads per sample were obtained (Supplementary Figure S1) and then aggregated into about 310,000 ± 65,000 clones (A clone is defined if CDR3 amino acid sequences were 100% identity and their V and J gene segments were identical) (Supplementary Figure S1). The BCR network was constructed for each sample in such a way that each node represents a unique CDR3 clone, and nodes were connected (by edges) when their Levenshtein distances of CDR3s is only 1 and finally got 132 BCR networks. The subnetworks in BCR network were called BCR cluster. To clarify the convergent pattern of BCR repertoire in response to influenza vaccination, all clones in each BCR repertoires in vaccine group were integrated together to construct the BCR cluster, and finally 16,866,328 BCR clusters were obtained.
Dynamic changes of the BCR repertoires with influenza vaccination
With the data, dynamic changes were explored from different angles. First of all, 132 BCR repertoires were analysed in terms of their clonal abundance (number of reads in a clone) in different phases, and the results show that, in each phase, the proportion of clones with reads only 1 exceeded 65% (A upper panel). Analysis of clonal abundance also showed that the diversity of BCR repertoire was significantly decreased at acute phase compared with the BCR repertoires in the pre-vaccine phase and steady phase (Paired t test, P-value < 0.05) (A lower panel). However, it was worth noting that the diversity of BCR repertoire in acute phase decreased more significantly in the first vaccination than in the second vaccination (Paired t test, P-value < 0.05) (A lower panel). CDR3 is a highly variable region in the BCR and plays the most important role in specific antigen recognition for B cells. Because the length of CDR3 could greatly affect the shape and folding capacity [Citation40], the distribution for the length of CDR3 was also analysed. The CDR3 amino acid length distribution in acute phases was more flatter than other phases and the proportion of the length groups of 14–16 and 16–18 in the first acute phase were lower than other phases (Wilcoxon's signed-rank test, B). The distribution for the length of CDR3 was similar between BCR repertoires in pre-vaccine phase and steady phase of the first and second vaccinations (Pearson correlation r = 0.93 ± 0.11), but there was more difference between BCR repertoires in acute phases (Pearson correlation r = 0.81 ± 0.14) (C). Based on the Pearson correlation matrix between the distribution for the length of CDR3, all BCR repertoires were clustered into two clusters (high correlation cluster and low correlation cluster, C), and the BCR repertoires in acute phase of the first vaccination tend to be clustered into the low correlation cluster (Chi-square test, P-value < 0.05).
Figure 2. Characteristics for the dynamic changes of BCR repertoire after influenza vaccination. (A) Stack bar plot in the top panel showing the proportion of clones with different abundance in different phases. Violin plot at the bottom showing the dynamic change of clonal diversity. Statistical analyses were performed using the paired t-test to assess significant differences between the acute phase and other phases in the vaccine group, as well as between the two time points in the control group. The Mann–Whitney U test was used to evaluate whether there were statistically significant differences between the acute phase of the vaccine group and the time points in the control group. Only statistically significant comparisons were marked. (B) Density plot in the top panel showing the CDR3 length distribution of BCR repertoires in each phase. Box plot in the bottom panel showing the proportion of clones between time points for different length group. Wilcoxon's signed-rank test was applied to compare the difference between acute phase and other phases in the vaccine group and between two time points in the control group in different length groups. The Mann–Whitney U test was used to evaluate whether there were statistically significant differences between the acute phase of the vaccine group and the time points in the control group. Only statistically significant comparisons were marked. Different colours represented different sampling time points, as shown in the legend. (C) Hierarchical clustering based on the Pearson correlations of length frequency distribution. Each tile in the heatmap represents the pairwise Pearson correlation of length frequency distribution between two BCR repertoires. The magnitude of the correlation was indicated by the colour spectrum. Different sampling time points were also colour coded. The proportion of each phase in two clusters was shown and compared to their expected proportion based on Chi-square test, different colours represented different sampling time points, as shown in the legend. (D and E) Networks formed by the largest cluster in BCR network of vg9 volunteer in vaccine group and cg1 volunteer in control group at their sampling time points. Nodes (a unique CDR3 clone sequence) were connected by edges defined by their Levenshtein distance of 1. Node size reflects read number of each node (clone). Different colours represented different sampling time points, as shown in the legend. (F) Dynamic changes of four indicators (density, average degree, assortativity coefficient and largest cluster proportion) of BCR networks in vaccine and control group. Paired t test was applied to compare the difference between acute phase and other phases in vaccine group and two sampling times in control group. (G) The comparison of SHM rates between different time points. Paired t test was applied to compare the difference between acute phase and other phases in the vaccine group and between two time points in the control group. The Mann–Whitney U test was used to evaluate whether there were statistically significant differences between the acute phase of the vaccine group and the time points in the control group. Only statistically significant comparisons were marked, All the P-values above were exhibited as follows: *** P-value < 0.001, ** P-value < 0.01, * P-value < 0.05.
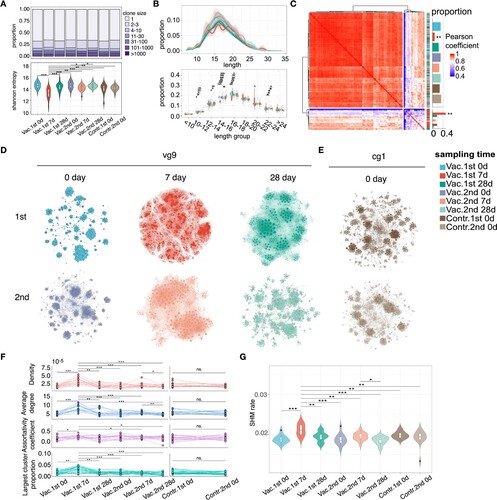
For each sample, the BCR network was constructed in which that each node represents a unique CDR3 clone sequence, and nodes were connected when their Levenshtein distances of CDR3s is only 1. Network features were then analysed to characterize the architecture of the BCR repertoire. It could be found from the visualization of the largest cluster of BCR network that the networks in the acute phase of vaccination were denser than that in the pre-vaccine phase and the steady phase (D-E). Based on the graph theory, results for four indicators, including density, average degree, largest cluster proportion and assortativity coefficient, show that the above indicators were significantly higher in the acute phase of the first vaccination than other phases for the vaccine group and there is no difference between two time points for control group (Paired t test, P-value < 0.05, F), which means that in acute phase of vaccination, the BCR network has larger clusters, with more density connections and higher assortativity (nodes tend to connect nodes with the same degree). SHM introduces mutations in the BCR variable region that encodes the antigen-binding sites, thus promoting affinity maturation [Citation41] and the SHM rate in the above phases were further analysed. The results show that SHM rate was significantly higher in the acute phase of the first vaccination than other phases for the vaccine group and there is no difference between two time points for control group (Paired t test, P-value < 0.05, G). Those results show that changes were more significant in the acute phase of the first vaccination than that of the second vaccination.
Differential usage of V and J gene segments in the acute phase
To tease out the reasons and mechanisms behind the stronger changes in the acute phase of the first vaccination than the second vaccination, detailed V and J gene segments usage analysis was carried out. The V and J gene segments are components of the immunoglobulin heavy chain (IGH) that are important for the function of the BCR repertoires, especially V gene segments, which are shown to be associated with the HA domain, the main surface antigenic protein for influenza [Citation23], as an example. Throughout B-cell development, V gene segments usage in heavy chain was non-uniform with more than 100 kinds of V gene segments. To reduce the bias, the subsequent analysis only retained the core V gene segments that contribute to more than 99% of the BCR repertoires. The proportion of V and J gene segments in the BCR repertoire was first investigated in the pre-vaccine phase and was found that IGHJ4 accounted for the largest proportion usage of J gene segments, and IGHV4-39, IGHV3-7, IGHV3-23, IGHV4-34, IGHV3-74 accounted for the top 5 usage of V gene segments (A). After vaccination, the BCR repertoires were skewed toward specific V–J gene segments pairs in the acute phase, and during the steady phase subsequently returned to the normal distribution similar to the pre-vaccine phase (B). Remarkably, like to CDR3 length distribution (B), the observed V–J gene segments frequency distribution was similar between the BCR repertoires in pre-vaccine phase and steady phase (Pearson correlation r = 0.81 ± 0.09, B–C), but there was also more difference between BCR repertoires in acute phase (Pearson correlation r = 0.63 ± 0.15, C). After clustering the Pearson correlation matrix of V–J gene segments frequency distribution in all BCR repertoires, the BCR repertoires in acute phase of the first vaccination tend to be clustered into the low correlation cluster (Chi-square test, P-value < 0.05).
Figure 3. Preference of V and J gene segments usage. (A) Circos plot showing the V–J gene segment pairs frequency in the BCR repertoires in the pre-vaccine phase. Only the V gene segments that contribute to more than 99% of BCR repertoires were retained. (B) Average V–J gene segment pairs frequency distributions in each phase (mean ± standard error of mean (SEM)). V–J gene segment pairs on the x-axis were sorted by the V–J gene segment pairs frequency in the Figure A. Different colours represented different sampling time points as the legend and error bar was marked in red. (C) Hierarchical clustering based on the Pearson correlation of V–J gene segment frequency distribution. Each tile in the heatmap represents the pairwise Pearson correlation of V–J gene segment frequency distribution between two BCR repertoires. The magnitude of the correlation was indicated by the colour spectrum. Different phases were also colour coded. The proportion of each phase in two clusters was shown and compared to their expected proportion based on Chi-square test, different colours represented different sampling time points, as shown in the legend. All the P-values above were exhibited as follows (***P-value < 0.001, **P-value < 0.01, *P-value < 0.05). (D–G) The differential analysis of V and J gene segments in the BCR repertoires between acute phase and pre-vaccine phase by Fisher’s exact test. The heat map showing the frequency of each V or J gene segment and the colours of scatters represented the P-value of the significant positive or negative and the value of odds ratio (OR). Red: P-value < 0.05 and OR > 1, blue: P-value < 0.05 and OR < 1, grey: P-value > 0.05. Fisher’s exact test, P-value less than 0.05 was considered statistically significant. (D) V gene segments for acute phase and pre-vaccine phase of the first vaccination. (E) V gene segments for acute phase and pre-vaccine phase of the second vaccination. (F–G) was the same as (D–E) but for J gene segments. (H) Radar plot showing the relative changes of V gene segments usage for the first vaccination (upper panel) and second vaccination (bottom panel). The proportion of V gene segments usage in the pre-vaccine phase of each vaccination was considered as the baseline. The relative change in V gene segments usage was calculated by the proportion of V gene segments at a certain sampling time group minus the baseline in each vaccination (Δ(acute phase – pre-vaccine phase)). (I) Heatmap showing the mean SHM rate of V gene segments in different sampling time points. Colour spectrum indicates magnitude of the SHM rate.
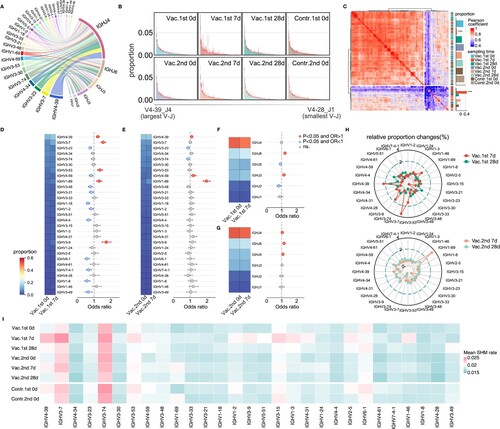
To explore in detail the preference of V and J gene segments usage after influenza vaccination, BCR repertoires in the acute phase of each vaccination were compared with those in the pre-vaccine phase of each vaccination. In the first vaccination, IGHV4-39, IGHV3-7, IGHV3-53, IGHV1-69, IGHV3-9 were more significantly expanded in the acute phase after vaccination than in the pre-vaccine phase (Fisher’s exact test, P-value < 0.05, Odds Ratio > 1, D), and in the second vaccination, IGHV4-39, IGHV4-59, IGHV1-69 were more significantly expanded in the acute phase after vaccination (Fisher’s exact test, P-value < 0.05, Odds Ratio > 1, E) than in the pre-vaccine phase. For J gene segments, IGHJ6 and IGHJ3 were significantly expanded in the acute phase of the first vaccination, whereas IGHJ4, IGHJ6 and IGHJ5 were significantly expanded in the acute phase of the second vaccination (F-G). Changes in J gene segments were smaller, so subsequent analyses were performed only based on V gene segments. Alternatively, absolute value matters and relative changes for the V gene segments usage proportion (Δ(acute phase – pre-vaccine phase)) were explored. As H showed, V gene segments usage was extremely different in the acute phase of the first and second vaccination, but gradually returned to the pre-vaccine phase in the steady phase. The proportions of some V gene segments, such as IGHV4-39, IGHV3-9, IGHV3-7, IGHV1-69, especially of IGHV3-7, were sharply increased, and the proportions of some V gene segments, such as IGHV3-23 were relatively decreased in the first vaccination. However, only the proportion of IGHV1-69 was sharply increased in the second vaccination, accompanied by a relative decrease in the proportion of some V gene segments (such as IGHV3-23 and IGHV3-74). Combined together, it could be found that the V gene segments amplification in the acute phase of the first vaccination was dominated by IGHV3-7, while the V gene segments amplification in the acute phase of the second vaccination was dominated by IGHV1-69. From the SHM rate analysis of V gene segments, the top 3 in the acute phase of the first vaccination were IGHV3-74, IGHV3-7, and IGHV4-39, but the top 3 in the acute phase of the second vaccination were IGHV3-74, IGHV3-7, and IGHV1-69. (I) further shows SHM rate of many expanded V gene segments was obviously higher in acute phase than other phase of the first vaccination, such as IGHV4-39 and IGHV3-7, while the SHM rate of IGHV1-69 was increased in acute phase of the second vaccination (I).
Above all, results for the preference of V–J gene segments usage show that the use of V gene segments was more biased in the acute phases of vaccination, the V gene segments amplification in the acute phase of the first vaccination were IGHV4-39, IGHV3-9, IGHV3-7, IGHV1-69, especially for IGHV3-7, while the V gene segments amplification in the acute phase of the second vaccination was dominated by IGHV1-69, all with increased SHM rates.
Dynamics of immunoglobulin isotypes and the class switch recombination
When encountering with the real virus or the vaccine strain, B cells undergo class switching in germinal centres to generate antibodies of different isotypes to perform distinct functions. Therefore, the usage frequency of different isotypes was compared among different phases. IgM occupies the highest proportion in the whole BCR repertoires (36%–46%) in the pre-vaccine phase (A). After the first vaccination, the proportion of IgG1 and IgG2 was increased significantly and IgG1 dominates in the acute phase with IgM significantly decreased (Vac.1st 7d compared to Vac.1st 0d, Wilcoxon's signed-rank test, P-value < 0.05, A and B). The proportion of IgG1 was also increased significantly and IgA1 decreased significantly after the second vaccination (Vac.2nd 7d compared to Vac.2nd 0d, Wilcoxon's signed-rank test, P-value < 0.05, B). However, in the steady phase (Vac.1st 28d and Vac.2nd 28d), the proportion of each isotype returned to the pre-vaccine phase level. The proportion of isotypes was next explored in different clone abundances and in different CDR3 length groups. The results show that IgM dominates in most abundance groups except for the group with more than 1000 reads, where IgG1 dominates (C). IgM dominates in all length groups, and the proportion of IgA1 decreases with the increase of length (D). The SHM rate of IgG1 is the highest compared to other isotypes (E, left panel). Meanwhile, it could be seen that the SHM rate of IgG1 and IgG3 increased significantly in the acute phase of the first vaccination than other phases (Paired t test, P-value < 0.05) (E, right panel).
Figure 4. Immunoglobulin isotypes and CSR changes. (A) Stack bar plot showing the proportion of each immunoglobulin isotype at different sampling time points. (B) Dynamic changes for the proportion of immunoglobulin isotypes during different time points with vaccination. Wilcoxon's signed-rank test was applied to compare the difference between acute phase and other phases in the vaccine group in different isotypes. Only statistically significant comparisons were marked. (C) Stack bar plot showing the proportion of each immunoglobulin isotype in different clone abundance groups. (D) Stack bar plot showing the proportion of each immunoglobulin isotype in different CDR3 length groups. (E) SHM rate among different immunoglobulin isotypes (left panel) and among different sampling time points for different immunoglobulin isotypes (right panel). The SHM rate of IgG4 was excluded from this analysis due to its limited representation within the dataset, as it accounted for only a small proportion. Mann–Whitney U test was applied to compare the difference between IgG1 and other immunoglobulin isotypes (left panel) and the difference between the acute phase and other phases in different immunoglobulin isotypes (right panel). Only statistically significant comparisons were marked. All the P-values above were exhibited as follows(***P-value < 0.001, **P-value < 0.01, *P-value < 0.05). (F) Circos plot showing the V–J gene segment pairs frequency of IgM and IgG3 for different sampling time points in the first vaccination and of IgG1 and IgG2 in the second vaccination. (G) CSR network for different sampling time points with vaccination. Node size reflects the proportion of each immunoglobulin isotype and edge thickness indicates the enrichment level of observed switches in the two corresponding IGH subclasses.
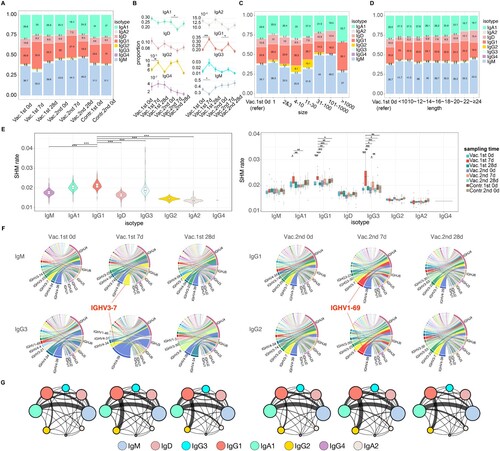
Subsequently, the V and J gene segments usage for different isotypes was tracked during the three phases in the vaccine group. It was observed that the composition of V and J gene segments usage spectrums of IgA1, IgA2, IgD were similar among different phases. While for IgM and IgG3 in the first vaccination, compared with the pre-vaccine phase, the use of IGHV3-7 in the acute phase ranked remarkably higher in the V gene segments usage spectrum (from 3rd to 1st and from 13th to 2nd respectively, F). For IgG1 and IgG2 in the second vaccination, compared with the pre-vaccine phase, the use of IGHV1-69 in the acute phase ranked remarkably higher in the V gene segments usage spectrum (from 6th to 2nd and from 7th to 2nd respectively, F).
After B cells respond to antigen, they undergo CSR to progressively refine the antibody, such as IgM to IgG. To further explore the CSR among different isotypes at different phases in more details, a CSR network was constructed to represent the CSR between isotypes, in which the size of the circle represents the proportion of this isotype, and the thickness of the edge represents the strength of CSR (F). It shows that IgG not only increased significantly in the acute phase and become dominant, but also frequently undergo CSR after influenza vaccination, especially IgG1. Further analysis found that, for both the first vaccination and the second vaccination, compared with the pre-vaccine phase where the dominant CSR was from IgM to IgA1, the dominant CSR in the acute phase was from IgG1 to IgG2, and then switched back to from IgM to IgA1 in the steady phases (G).
In brief, after each vaccination, the proportion of IgG1 increased, and its SHM rate was also higher. Remarkably, compared to pre-vaccine phase of each vaccination, the use of IGHV3-7 in the acute phase of the first vaccination was elevated through isotypes IgM and IgG3, but through IgG1 and IgG2 for IGHV1-69 in the acute phase of the second vaccination (F and Supplementary Figure S3). The dominant CSR in the acute phase was IgG1 to IgG2, whereas the dominant CSR in both the pre-vaccine and the steady phase was IgM to IgA1.
BCR sharing across time points and individuals
Despite the highly diversity of BCR repertoire, public BCR sequences that are shared among multiple individuals have been observed in previous studies upon encountering antigens [Citation42–44]. To have a better understanding about the sharing among BCR repertoires, first, overlap coefficient (OC) [Citation38] was used to quantify the degree of sharing between two BCR repertoires, which is calculated based on the percentage of clones shared between the two BCR repertoires and their number of clones. The results show that the sharing between the BCR repertoires within same individual at different time points (inner sharing) was much greater than that between different individuals (cross sharing), although the degree of sharing in both patterns was small (Mann–Whitney test, P-value < 0.05, A–C). To clarify the convergent pattern of BCR repertoires in response to influenza vaccination, all BCR repertoires were integrated together as BCR cluster. Clusters containing clones in acute phase both of the first vaccination and the second vaccination were identified (red in D) and 7426 BCR clusters across all time points (blue in D). As described above, the sharing across individuals was very rare, so the number of clusters from multiple individuals was also small (E). Surprisingly, however, there was a high degree of overlap between clusters from all individuals and all time points of the vaccine group, with 41 public BCR clusters identified (F). Compared with other clusters, the size of these public BCR clusters and the abundance of the clones contained in these public BCR clusters were significantly larger, and the average length of the sequence contained in the public BCR clusters was smaller (G). The V and J gene segments frequency distribution of these public BCR clusters was similar to BCR repertoires in pre-vaccine phase, with a high correlation (Pearson correlation r = 0.82, P-value < 0.05, H). As a result, the CDR3 motifs of IGHV3-7 and IGHV1-69 in public BCR clusters and their other information were given in (I).
Figure 5. BCR sharing among different sampling time points and individuals. (A) Schematic diagram of two sharing types: inner sharing (clones shared within same individual at different sampling time points) and cross sharing (clones shared between different individuals at the same sampling time). (B) Heatmap showing the pairwise overlap coefficient between different samples. Colour legend indicates magnitude of the pairwise overlap coefficient. (C) Comparing the overlap coefficient with different x-axis group which calculated by all the combinations within each x-axis group. Mann–Whitney U test was used to compare the difference within control group (cross sharing), vaccine group (cross sharing) and between 1st versus 2nd (Vac 7d) group and other groups in inner sharing pattern. Only statistically significant comparisons were marked. (D) Upset plot showing the number of clusters containing different sampling time points. Clusters containing clones both in the acute phase of the first vaccination and in the acute phase of the second vaccination were marked in red. Clusters contain clones from all time points are coloured in blue. (E) Bar plot showing the number of clusters from multiple individuals for different sampling time points. (F) Venn plot showing the overlap of clusters from all individuals and all time points of the vaccine group. (G) Box plot showing the differential analysis of the cluster size (number of clones in cluster), average length (average length of clones in cluster) and abundance (abundance reads in cluster) between the public BCR clusters and other BCR clusters by t test. (H) Circos plot showing the V-J gene segments pairs frequency of public BCR clusters. (I) The J gene segments usage, isotype proportion and CDR3 motifs of IGHV3-7 and IGHV1-69 V gene segments in public BCR clusters. (J) Sankey plot showing the characteristic distribution of CDR3 sequence in our BCR repertoires that are 100% matched with the known influenza specific CDR3 sequence described in the previously studies [Citation27,Citation44–46].
![Figure 5. BCR sharing among different sampling time points and individuals. (A) Schematic diagram of two sharing types: inner sharing (clones shared within same individual at different sampling time points) and cross sharing (clones shared between different individuals at the same sampling time). (B) Heatmap showing the pairwise overlap coefficient between different samples. Colour legend indicates magnitude of the pairwise overlap coefficient. (C) Comparing the overlap coefficient with different x-axis group which calculated by all the combinations within each x-axis group. Mann–Whitney U test was used to compare the difference within control group (cross sharing), vaccine group (cross sharing) and between 1st versus 2nd (Vac 7d) group and other groups in inner sharing pattern. Only statistically significant comparisons were marked. (D) Upset plot showing the number of clusters containing different sampling time points. Clusters containing clones both in the acute phase of the first vaccination and in the acute phase of the second vaccination were marked in red. Clusters contain clones from all time points are coloured in blue. (E) Bar plot showing the number of clusters from multiple individuals for different sampling time points. (F) Venn plot showing the overlap of clusters from all individuals and all time points of the vaccine group. (G) Box plot showing the differential analysis of the cluster size (number of clones in cluster), average length (average length of clones in cluster) and abundance (abundance reads in cluster) between the public BCR clusters and other BCR clusters by t test. (H) Circos plot showing the V-J gene segments pairs frequency of public BCR clusters. (I) The J gene segments usage, isotype proportion and CDR3 motifs of IGHV3-7 and IGHV1-69 V gene segments in public BCR clusters. (J) Sankey plot showing the characteristic distribution of CDR3 sequence in our BCR repertoires that are 100% matched with the known influenza specific CDR3 sequence described in the previously studies [Citation27,Citation44–46].](/cms/asset/0eb9b85e-6d0d-4a86-b993-8dd14366ecc7/temi_a_2245931_f0005_oc.jpg)
Previous studies have experimentally identified some BCR sequences specific to influenza viruses. By comparing those previously annotated influenza specific CDR3 sequence with our BCR repertoires, more information about the specificity of the BCR repertoires could be obtained. 17 CDR3 sequences in our dataset were 100% matched to the known influenza specific CDR3 sequence described in the previous literatures [Citation27,Citation44–46]. Most of them were from the BCR repertoires of the vaccine group (15/17), and most were from the acute phase (14/17) (Chi-square test, P-value < 0.05). The two V gene segments with the highest frequency were IGHV4-39 (5/17) and IGHV3-7 (4/17), and most of them were IgG1 (15/17) (J).
Discussion
In this study, 34 healthy volunteers (16 in the vaccine group and 18 in the control group) were recruited, and the dynamics of the BCR repertoires in response to two repeated influenza vaccinations were investigated. Results show that changes were more significantly in the acute phase of the first vaccination than that in the second vaccination. On the other hand, the preferential amplification for V gene segments was different in the acute phase for first two consecutive vaccinations: IGHV4-39, IGHV3-9, IGHV3-7, IGHV1-69, especially for IGHV3-7 in the first vaccination, and mainly IGHV1-69 in the second vaccination. Those amplified V gene segments also have increased SHM rates in the corresponding acute phase. Moreover, compared to pre-vaccine phase of each vaccination, the use of IGHV3-7 in the acute phase of the first vaccination was elevated through isotypes IgM and IgG3, but through IgG1 and IgG2 for IGHV1-69 in the acute phase of the second vaccination. Finally, public BCR clusters were explored especially for the vaccine group. Those detailed knowledges for the dynamics of BCR repertoires following repeated influenza vaccinations are helpful for a better understanding of the molecular mechanisms underlying the immune response following influenza vaccination in humans, which will facilitate the better vaccine design and vaccine strategy in the future.
Compared with the control group and the pre-vaccine phase from the vaccine group, the characteristics of BCR repertoires in the acute phase after vaccination changed remarkably and gradually returned to the pre-vaccine level in the steady phase (A–F). For example, the clonal diversity of BCR repertoire in the acute phase was significantly lower than pre-vaccine and steady phases (A). Similar phenomena have been observed in 2019 coronavirus disease (COVID-19) patients [Citation47]. Our results revealed that the CDR3 length distribution in acute phase became more flatter than other phase (C), and the length feature is important to distinguish whether an individual is infected or not based on the deep learning model in previous study [Citation48]. The architecture of BCR network became more dense in acute phase after vaccination with the appearance of larger clusters (D and E), which was also closely related to the immune state of the body, such as age, disease infection or some autoimmune diseases, and these dynamic changes were observed as well as in the T-cell receptor (TCR) network [Citation24,Citation25,Citation49]. A higher SHM rate was observed in the acute phase after vaccination (F), which may be related to the SHM and affinity maturation process of B cells for highly efficient and high affinity antibodies after the vaccination. Notably, compared with the more dramatic changes of the BCR repertoires in the acute phase of the first vaccination, the changes in the acute phase of the second vaccination were significantly reduced (A–F). The same conclusion was consistently reached even when the dynamic changes within the group of eight volunteers who received two doses of the QIV vaccine were specifically analysed (Supplementary Figure S2). This result is similar to previous studies [Citation10,Citation15,Citation16] which had suggested that repeated annual influenza vaccination can blunt future vaccine-induced antibody responses, particularly to IAV H3N2 strains [Citation10]. McLean et al., using 5-year historical influenza vaccination data, found significantly greater vaccine effectiveness against H3N2 in the current season in vaccinees with no previous vaccination history (65%) compared to those vaccinees with frequent influenza vaccination history (24%) [Citation50]. Jones gray et al. meta-analysis also demonstrated that influenza vaccination was less effective in two seasons (previous season and current season) compared to the current season, suggesting less protection from sequential vaccination; although influenza vaccination in the previous year attenuates vaccine effectiveness, vaccination in two consecutive years provides better protection than no vaccination [Citation16].
However, from the perspective of V and J gene segments usage, BCR repertoires would skew toward some V gene segments after influenza vaccination. The results show that V gene segments of IGHV4-39, IGHV3-7, IGHV3-53, IGHV1-69, IGHV3-9 were significantly expanded in acute phase of the first vaccination and the relative proportion of IGHV3-7 increased the most (D,H). Previous studies have shown that segments such as IGHV4-39, IGHV3-9 and IGHV3-7 were involved in the recognition of the HA globular domain with homotypic neutralization capacity [Citation44,Citation51–53]. For IGHV1-69, which was amplified more in the acute phase of the second vaccination, might be involved in the recognition of the HA stem domain and with heterotypic seroconversion capacity [Citation27,Citation45,Citation54]. Overall, the amplification pattern for the V gene segments of the second vaccination was quite different from the first one. IGHV4-39, IGHV4-59 and IGHV1-69 were significantly expanded after the second vaccination with the IGHV1-69 segment more dominating (E, H). It was shown that both IGHV4-59 and IGHV1-69 were involved in the recognition of the HA stem domain [Citation27,Citation45,Citation54–56]. Ye et al. found that repeated vaccination provided similar or enhanced protection as compared with single vaccination in first-time vacciness [Citation9]. Some studies have reported that the immune dominance of antigen sites may be redirected after repeated variant exposure [Citation57,Citation58], that is, after the first vaccination, the antigen sites tend to mutate domain, but after the second vaccination, the antigen sites tend to be more conservative domain. Combined with the above analysis and previous studies based on serological analysis, we hypothesized that the overall changes of BCR repertoires induced by the vaccine was stronger in the first vaccination and weaker in the subsequent repeat vaccination, but that the repeated vaccination could tend to elicit HA stem-reacting, broad, heterosubtypic immunity. Further investigations need to be carried out to confirm this hypothesis and provide further detailed mechanisms probably through investigating into dynamics with more vaccinations.
Further investigation from the angle of isotype reveals that the influenza vaccination significantly enhanced the proportion and the SHM rate of IgG (especially IgG1) in the acute phase (A, B, E). IgG can provide long-term protection, and high titres of virus-specific IgG antibodies have been detected in the plasma of convalescent patients [Citation59]. Besides, among all IgG isotypes, IgG1 has the largest proportion, strongest SHM and most CSR events (E, G), which may imply that IgG1 was the main isotype for the body to respond to influenza vaccine. It has been reported that IgG plays a dominant role in influenza vaccine responses and IgG1 is the major subclass of IgG [Citation21]. Interestingly, compared to pre-vaccine phase of each vaccination, the use of IGHV3-7 in the acute phase of the first vaccination was elevated in IgM and IgG3. At the same time, the use of IGHV1-69 in the acute phase of the second vaccination was elevated in IgG1 and IgG2. That detailed information could shed lights on further mechanistic investigation of immune responses following vaccination and ultimately for future universal vaccine design [Citation60,Citation61].
Our study systematically characterized the dynamic change of BCR repertoires in human after repeated influenza vaccination. However, our study suffers several drawbacks. First of all, due to the lack of experimental validation, we cannot evaluate the protective effect of repeated vaccination from the sero-epidemiological perspectives such as antibody neutralization capacity and hemagglutination inhibition (HAI) titre. The public BCR clusters could be further investigated and some of them may not be related to the vaccination but some of them are related to the vaccination, including the IGHV1-69 with the potential for coding broad neutralizing antibodies. All of those are best to be functionally validated through experiment. Second, although bulk sequencing can provide sufficient breadth and depth of sequencing, only the CDR3 sequence of the BCR is obtained currently, and other techniques should be applied to get the full sequences for in-depth study, including the single-cell sequencing. Third, our study mainly focused on the changes in the overall characteristics of the BCR antibody repertoire after the influenza vaccination. However, more in-depth and detailed analysis of the evolutionary dynamics of antibodies or important clones was not performed, which is the focus of our future work. In addition, the conclusions were drawn based on 2 years of repeated influenza vaccination, and more vaccinations will be required in the future for more firm and extended conclusions. Besides, the difference between the first vaccination and the repeated vaccination may be caused by the change in the composition of the vaccinated vaccine (Supplementary Table S2).
Taken together, our study provides more detailed insights on the dynamic changes of BCR repertoire characteristics after repeated influenza vaccination, which should shed lights on better understanding of the immune response pattern and mechanism behind repeated influenza vaccination. This study clarified some of confusions behind repeated influenza vaccination and provide additional explanations. The influenza vaccination cohort established here, the results obtained and the additional follow-up data and study in the future could provide more comprehensive understanding for the immune response with vaccination, which will push forward the universal vaccine design and also the targeted vaccine strategies for influenza and other related infectious diseases, thus promoting better prevention and control of them.
Supplemental Material
Download PDF (941.7 KB)Acknowledgements
We gratefully acknowledge the nurses from the school hospital of Sun Yat-sen University for their assistance in sample collection.
Disclosure statement
No potential conflict of interest was reported by the author(s).
Data availability
The raw sequencing data have been deposited into the National Genomics Data Center (NGDC), the accession number is HRA004990. Please access it from the following link: https://bigd.big.ac.cn/gsa-human/browse/HRA004990. The authors declare that the data used for the current study is available from the lead contact (Prof. Xiangjun Du, [email protected]) upon request.
Correction Statement
This article has been corrected with minor changes. These changes do not impact the academic content of the article.
Additional information
Funding
References
- Krammer F, Smith GJD, Fouchier RAM, et al. Influenza. Nat Rev Dis Primers. 2018;4:3. doi:10.1038/s41572-018-0002-y
- Russell CA, Jones TC, Barr IG, et al. The global circulation of seasonal influenza A (H3N2) viruses. Science. 2008;320:340–346. doi:10.1126/science.1154137
- Nelson, MI, Holmes EC. The evolution of epidemic influenza. Nat Rev Genet. 2007;8:196–205. doi:10.1038/nrg2053
- Halloran, ME, Ferguson NM, Eubank S, et al. Modeling targeted layered containment of an influenza pandemic in the United States. Proc Natl Acad Sci USA. 2008;105:4639–4644. doi:10.1073/pnas.0706849105
- Cox, NJ, Brammer TL, Regnery HL. Influenza: global surveillance for epidemic and pandemic variants. Eur J Epidemiol. 1994;10:467–470. doi:10.1007/BF01719678
- Xie, H, Wan X-F, Ye Z, et al. H3n2 mismatch of 2014–15 northern hemisphere influenza vaccines and head-to-head comparison between human and ferret antisera derived antigenic maps. Sci Rep. 2015;5:15279.doi:10.1038/srep15279
- de Jong JC, Beyer WE, Palache AM, et al. Mismatch between the 1997/1998 influenza vaccine and the major epidemic A(H3N2) virus strain as the cause of an inadequate vaccine-induced antibody response to this strain in the elderly. J Med Virol. 2000;61:94–99.doi:10.1002/(SICI)1096-9071(200005)61:1
- Petrova, VN, Russell CA. The evolution of seasonal influenza viruses. Nat Rev Microbiol. 2018;16:47–60. doi:10.1038/nrmicro.2017.118
- Ye, B, Shu L, Pang Y, et al. Repeated influenza vaccination induces similar immune protection as first-time vaccination but with differing immune responses. Influenza Other Respir Viruses. 2022;17. doi:10.1111/irv.13060
- Belongia, EA, Skowronski DM, McLean HQ, et al. Repeated annual influenza vaccination and vaccine effectiveness: review of evidence. Expert Rev Vaccines. 2017;16:1–14.doi:10.1080/14760584.2017.1334554
- Ahmed, AH, Nicholson KG, Nguyen-Van-Tam JS. Reduction in mortality associated with influenza vaccine during 1989–90 epidemic. Lancet. 1995;346:591–595. doi:10.1016/S0140-6736(95)91434-X
- Keitel, WA, Cate TR, Couch RB. Efficacy of sequential annual vaccination with inactivated influenza virus vaccine. Am J Epidemiol. 1988;127:353–364. doi:10.1093/oxfordjournals.aje.a114809
- Nichols, MK, Andrew MK, Ye L, et al. The impact of prior season vaccination on subsequent influenza vaccine effectiveness to prevent influenza-related hospitalizations over 4 influenza seasons in Canada. Clin Infect Dis. 2019;69:970–979. doi:10.1093/cid/ciy1009
- Gherasim, A, Martínez-Baz I, Castilla J, et al. Effect of previous and current vaccination against influenza A(H1N1)pdm09, A(H3N2), and B during the post-pandemic period 2010–2016 in Spain. PLoS One. 2017;12:e0179160. doi:10.1371/journal.pone.0179160
- Keitel, WA, Cate TR, Couch RB, et al. Efficacy of repeated annual immunization with inactivated influenza virus vaccines over a five year period. Vaccine. 1997;15:1114–1122. doi:10.1016/s0264-410x(97)00003-0
- Jones-Gray, E, Robinson EJ, Kucharski AJ, et al. Does repeated influenza vaccination attenuate effectiveness? A systematic review and meta-analysis. Lancet Respir Med. 2022. doi:10.1016/s2213-2600(22)00266-1
- Buchy, P, Badur S. Who and when to vaccinate against influenza. Int J Infect Dis 2020;93:375–387. doi:10.1016/j.ijid.2020.02.040
- Bassing, CH, Swat W, Alt FW. The mechanism and regulation of chromosomal V(D)J recombination. Cell. 2002;109(Suppl):S45–S55. doi:10.1016/s0092-8674(02)00675-x
- Petrova, VN, Muir L, McKay PF, et al. Combined influence of B-cell receptor rearrangement and somatic hypermutation on B-cell class-switch fate in health and in chronic lymphocytic leukemia. Front Immunol. 2018;9:1784. doi:10.3389/fimmu.2018.01784
- Hoehn, KB, Fowler A, Lunter G, et al. The diversity and molecular evolution of B-cell receptors during infection. Mol Biol Evol. 2016;33:1147–1157. doi:10.1093/molbev/msw015
- Krammer, F. The human antibody response to influenza A virus infection and vaccination. Nat Rev Immunol. 2019;19:383–397. doi:10.1038/s41577-019-0143-6
- Frasca, D, Diaz A, Romero M, et al. Effects of age on H1N1-specific serum IgG1 and IgG3 levels evaluated during the 2011–2012 influenza vaccine season. 2013;10(1):14. doi:10.1186/1742-4933-10-14
- Cortina-Ceballos, B, Godoy-Lozano EE, Téllez-Sosa J, et al. Longitudinal analysis of the peripheral B cell repertoire reveals unique effects of immunization with a new influenza virus strain. Genome Med. 2015;7:124. doi:10.1186/s13073-015-0239-y
- Madi, A, Poran A, Shifrut E, et al. T cell receptor repertoires of mice and humans are clustered in similarity networks around conserved public CDR3 sequences. eLife. 2017;6:e22057. doi:10.7554/eLife.22057
- Bashford-Rogers, RJM, Palser AL, Huntly BJ, et al. Network properties derived from deep sequencing of human B-cell receptor repertoires delineate B-cell populations. Genome Res. 2013;23:1874–1884. doi:10.1101/gr.154815.113
- Boyd, SD, Marshall EL, Merker JD, et al. Measurement and clinical monitoring of human lymphocyte clonality by massively parallel VDJ pyrosequencing. Sci Transl Med. 2009;1:12ra23. doi:10.1126/scitranslmed.3000540
- Lee, J, Paparoditis P, Horton AP, et al. Persistent antibody clonotypes dominate the serum response to influenza over multiple years and repeated vaccinations. Cell Host Microbe. 2019;25(3):367–376.e5. doi:10.1016/j.chom.2019.01.010
- Georgiou, G, Ippolito GC, Beausang J, et al. The promise and challenge of high-throughput sequencing of the antibody repertoire. Nat Biotechnol. 2014;32:158–168. doi:10.1038/nbt.2782
- Vollmers, C, Sit RV, Weinstein JA, et al. Genetic measurement of memory B-cell recall using antibody repertoire sequencing. Proc Natl Acad Sci USA. 2013;110:13463–13468. doi:10.1073/pnas.1312146110
- Zhu, Y, Yang X, Ma C, et al. Antibody upstream sequence diversity and its biological implications revealed by repertoire sequencing. J Genet Genomics. 2021;48:936–945. doi:10.1016/j.jgg.2021.06.016
- Chen, S, Zhou Y, Chen Y, et al. Fastp: an ultra-fast all-in-one FASTQ preprocessor. Bioinformatics. 2018;34:i884–i890. doi:10.1093/bioinformatics/bty560
- Bolotin, DA, Poslavsky S, Mitrophanov I, et al. MiXCR: software for comprehensive adaptive immunity profiling. Nat Methods. 2015;12:380–381. doi:10.1038/nmeth.3364
- Soto, C, Bombardi RG, Branchizio A, et al. High frequency of shared clonotypes in human B cell receptor repertoires. Nature. 2019;566:398–402. doi:10.1038/s41586-019-0934-8
- Schneider-Hohendorf, T, Mohan H, Bien CG, et al. CD8+ T-cell pathogenicity in Rasmussen encephalitis elucidated by large-scale T-cell receptor sequencing. Nat Commun. 2016;7:11153. doi:10.1038/ncomms11153
- Li, Z, Woo CJ, Iglesias-Ussel MD, et al. The generation of antibody diversity through somatic hypermutation and class switch recombination. Genes Dev. 2004;18:1–11. doi:10.1101/gad.1161904
- Hu, X, Zhang J, Wang J, et al. Landscape of B cell immunity and related immune evasion in human cancers. Nat Genet. 2019;51:560–567. doi:10.1038/s41588-018-0339-x
- Stavnezer J, Guikema JE, Schrader CE. Mechanism and regulation of class switch recombination. Annu Rev Immunol. 2008;26:261–292. doi:10.1146/annurev.immunol.26.021607.090248
- Greiff, V, Menzel U, Miho E, et al. Systems analysis reveals high genetic and antigen-driven predetermination of antibody repertoires throughout B cell development. Cell Rep. 2017;19:1467–1478. doi:10.1016/j.celrep.2017.04.054
- Wagih, O. Ggseqlogo: a versatile R package for drawing sequence logos. Bioinformatics. 2017;33:3645–3647. doi:10.1093/bioinformatics/btx469
- Miqueu, P, Guillet M, Degauque N, et al. Statistical analysis of CDR3 length distributions for the assessment of T and B cell repertoire biases. Mol Immunol. 2007;44:1057–1064. doi:10.1016/j.molimm.2006.06.026
- Zhang, Y, Yan Q, Luo K, et al. Analysis of B cell receptor repertoires reveals key signatures of the systemic B cell response after SARS-CoV-2 infection. J Virol. 2022;96:e01600–21. doi:10.1128/jvi.01600-21
- Robbiani, DF, Gaebler C, Muecksch F, et al. Convergent antibody responses to SARS-CoV-2 in convalescent individuals. Nature. 2020;584:437–442. doi:10.1038/s41586-020-2456-9
- Nielsen, SCA, Yang F, Jackson KJL, et al. Human B cell clonal expansion and convergent antibody responses to SARS-CoV-2. Cell Host Microbe. 2020;28:516–525.e5. doi:10.1016/j.chom.2020.09.002
- Jackson, KJL, Liu Y, Roskin KM, et al. Human responses to influenza vaccination show seroconversion signatures and convergent antibody rearrangements. Cell Host Microbe. 2014;16:105–114. doi:10.1016/j.chom.2014.05.013
- Joyce, MG, Wheatley AK, Thomas PV, et al. Vaccine-induced antibodies that neutralize group 1 and group 2 influenza A viruses. Cell. 2016;166:609–623. doi:10.1016/j.cell.2016.06.043
- Lee, J, Boutz DR, Chromikova V, et al. Molecular-level analysis of the serum antibody repertoire in young adults before and after seasonal influenza vaccination. Nat Med. 2016;22:1456–1464. doi:10.1038/nm.4224
- He, B, Liu S, Xu M, et al. Comparative global B cell receptor repertoire difference induced by SARS-CoV-2 infection or vaccination via single-cell V(D)J sequencing. Emerg Microbes Infect. 2022;11:2007–2020. doi:10.1080/22221751.2022.2105261
- Chen, Y, Ye Z, Zhang Y, et al. A deep learning model for accurate diagnosis of infection using antibody repertoires. J Immunol. 2022;208:2675–2685. doi:10.4049/jimmunol.2200063
- Yang, X, Wang M, Wu J, et al. Large-scale analysis of 2,152 Ig-seq datasets reveals key features of B cell biology and the antibody repertoire. Cell Rep. 2021;35:109110. doi:10.1016/j.celrep.2021.109110
- McLean, HQ, Thompson MG, Sundaram ME, et al. Impact of repeated vaccination on vaccine effectiveness against influenza A(H3N2) and B during 8 seasons. Clin Infect Dis. 2014;59:1375–1385. doi:10.1093/cid/ciu680
- Bajic, G, Harrison SC. Antibodies that engage the hemagglutinin receptor-binding site of influenza B viruses. ACS Infect Dis. 2021;7:1–5. doi:10.1021/acsinfecdis.0c00726
- Wrammert, J, Koutsonanos D, Li G-M, et al. Broadly cross-reactive antibodies dominate the human B cell response against 2009 pandemic H1N1 influenza virus infection. J Exp Med. 2011;208:181–193. doi:10.1084/jem.20101352
- Krause, JC, Tsibane T, Tumpey TM, et al. Epitope-specific human influenza antibody repertoires diversify by B cell intraclonal sequence divergence and interclonal convergence. J Immunol. 2011;187:3704–3711. doi:10.4049/jimmunol.1101823
- Pappas, L, Foglierini M, Piccoli L, et al. Rapid development of broadly influenza neutralizing antibodies through redundant mutations. Nature. 2014;516:418–422. doi:10.1038/nature13764
- Thomson, CA, Wang Y, Jackson LM, et al. Pandemic H1N1 influenza infection and vaccination in humans induces cross-protective antibodies that target the hemagglutinin stem. Front Immunol. 2012;3:87. doi:10.3389/fimmu.2012.00087
- Yamayoshi, S, Uraki R, Ito M, et al. A broadly reactive human anti-hemagglutinin stem monoclonal antibody that inhibits influenza A virus particle release. EBioMedicine. 2017;17:182–191. doi:10.1016/j.ebiom.2017.03.007
- Lindesmith, LC, Brewer-Jensen PD, Mallory ML, et al. Antigenic site immunodominance redirection following repeat variant exposure. Viruses. 2022;14:1293. doi:10.3390/v14061293
- Greaney, AJ, Starr TN, Eguia RT, et al. A SARS-CoV-2 variant elicits an antibody response with a shifted immunodominance hierarchy. PLoS Pathog. 2022;18:e1010248. doi:10.1371/journal.ppat.1010248
- Shen, C, Wang Z, Zhao F, et al. Treatment of 5 critically Ill patients with COVID-19 with convalescent plasma. JAMA. 2020;323:1582–1589. doi:10.1001/jama.2020.4783
- Xu, H, Wang B, Zhao T-N, et al. Structure-based analyses of neutralization antibodies interacting with naturally occurring SARS-CoV-2 RBD variants. Cell Res. 2021;31:1126–1129. doi:10.1038/s41422-021-00554-1
- Chen, EC, Gilchuk P, Zost SJ, et al. Convergent antibody responses to the SARS-CoV-2 spike protein in convalescent and vaccinated individuals. Cell Rep. 2021;36:109604. doi:10.1016/j.celrep.2021.109604