
ABSTRACT
Diabetic foot infections are a common complication of diabetes. Staphylococcus aureus is frequently isolated from diabetic foot infections and commonly colonizes human nares. According to the study, the nasal microbiome analysis revealed that diabetic patients had a significantly altered nasal microbial composition and diversity. Typically, the fasting blood glucose (FBG) level had an impact on the abundance and sequence type (ST) of S. aureus in diabetic patients. We observed that highly virulent S. aureus ST7 strains were more frequently colonized in diabetic patients, especially those with poorly controlled FBG, while ST59 was dominant in healthy individuals. S. aureus ST7 strains were more resistant to human antimicrobial peptides and formed stronger biofilms than ST59 strains. Critically, S. aureus ST7 strains displayed higher virulence compared to ST59 strains in vivo. The dominance of S. aureus ST7 strains in hyperglycemic environment is due to the higher activity of the SaeRS two-component system (TCS). S. aureus ST7 strains outcompeted ST59 both in vitro, and in nasal colonization model in diabetic mice, which was abolished by the deletion of the SaeRS TCS. Our data indicated that highly virulent S. aureus strains preferentially colonize diabetic patients with poorly controlled FBG through SaeRS TCS. Detection of S. aureus colonization and elimination of colonizing S. aureus are critical in the care of diabetic patients with high FBG.
Introduction
Diabetes mellitus (DM) is a complex metabolic disorder characterized by hyperglycemia resulting from decreased glucose metabolism [Citation1]. The worldwide estimated number of diabetes patients is expected to reach 700 million by 2045 [Citation2]. Diabetic foot ulcers (DFU) are a common complication of diabetes, beginning with neuropathy and resulting in foot ulcers [Citation3]. DFU is a costly and prevalent complication in diabetes patients, leading to a higher risk of death within five years [Citation4]. It has been reported that foot ulcers are more prevalent in type 2 diabetes [Citation5], and they are difficult to treat due to impaired healing processes and decreased immune responses [Citation6]. Furthermore, over half of foot ulcers become infected, often leading to lower extremity amputation [Citation7]. Therefore, controlling blood glucose levels, patient education, footwear interventions, and understanding wound site infections are crucial for effective prevention of foot ulcers [Citation8].
Diabetic foot infections (DFI) are mainly polymicrobial, and Staphylococcus aureus is the most frequently isolated pathogen in diabetes-related infections [Citation9–11]. S. aureus is a nostrious pathogen which can cause many diseases including skin and soft tissue infection, pneumonia, sepsis, etc., [Citation12]. The success of S. aureus as a pathogenic bacterium is due to the production of numerous virulence factors, which are controlled by multiple regulators, including the Agr quorum sensing system, the SaeRS two-component system (TCS), and the toxin repressor Rot [Citation13]. The sensor kinase SaeS autophosphorylates its hisdine residue, and transfers the phosphoryl group to the response regulator SaeR. The phosphorylated SaeR modulates the transcription of the virulence genes by binding to the corresponding promoters [Citation14]. According to the different affinity of phosphorylated SaeR and target genes, two classes of SaeRS target genes are classified: the low affinity targets (i.e. splB, hlgA, emp, eap, and fnbA), which can be activated by the induction of SaeRS TCS; and the high affinity targets (i.e. hla), which only require the basal level of SaeR phosphorylation [Citation15]. Previously we reported that SaeRS TCS contributes to the age-dependent nasal colonization of S. aureus [Citation16]. The epidemiological analysis showed that the clinical phenotypes, severity, and outcome of diseases caused by S. aureus are affected by the bacterial clone types [Citation17]. The variation of S. aureus strains affects the outcome of diabetic wounds [Citation18]. However, the origin of these strains is still poorly understood.
S. aureus can colonize in human anterior nares asymptomatically. The nasal S. aureus strains causing diabetic foot ulcers have been reported [Citation12,Citation19,Citation20]. We suspected that the clonal types of S. aureus strains in the nasal microbiome might affect the infection severity and prognosis in diabetic patients. However, little is known about the nasal microbiome, especially the colonization of S. aureus in diabetic patients. In the study, we investigated the nasal microbiome of type-2 diabetes patients by 16S rRNA sequencing and culture-based analysis. Moreover, the dominant sequence types of S. aureus for their colonization were characterized by competition assay both in vitro and in vivo. Finally, the pathogenic traits of S. aureus were detected using animal infection model.
Materials and methods
Ethics statement
The animal experiment was performed following the Guide for the Care and Use of Laboratory Animals (Eighth Edition). The human and animal study were approved by the ethics committee of Renji Hospital, School of Medicine, Shanghai Jiao Tong University, Shanghai, China. All individuals provided informed consents.
Participant enrolment and nasal swab collection
In total, 149 type-2 diabetes patients (DM) and 174 non-diabetes (NDM) volunteers from the community of Shanghai, China, were enrolled for the research. The exclusion criteria for the study were as follows: use of immunosuppressive agents normally, history of rhinitis or other chronic nostril diseases, carriage of medical devices, use of any antimicrobials within one month preceding enrolment. Nasal swabs were immediately submerged in 1 ml sterile saline after collection.
DNA extraction and 16S rRNA gene sequencing
After vortexing for 2 min, the swabs were centrifuged at 13,000 × g for 10 min, 4°C, upon which the pellets were dissolved in Buffer ALT (QIAamp DNA Mini Kit, Qiagen 51306) with lysozyme (1.25 mg/ml, Sigma L6876) and lysostaphin (25 μg/ml, Sigma L4402) and incubated for 30 min at 37°C. DNA extraction was performed according to the protocol of the QIAamp DNA Mini Kit. 16S-rRNA gene libraries were generated by PCR from purified genomic DNA with primers 341F (5′-CCTACGGGNBGCASCAG-3′) and 805R (5′-GACTACHVGGGTATCTAATCC-3′), which amplify the hypervariable V3-V4 regions of the 16S rRNA gene. The amplicons were further sequenced on the Illumina Hiseq 2500 platform.
Sequence analysis
After trimming with the FastX tool kit, the sequencing reads with a Phred base quality above 25 and read length longer than 30 were used for assembly using Flash software [Citation21]. The chimeric sequences was filtrated by USEARCH 8.0 implemented in QIIME [Citation22]. After splicing, the amplified sequences were between 400 and 500 base pairs for all samples. After exclusion of the samples with reads of less than 10,000, 280 samples (130 in the DM group and 150 in the NDM group) were amplified successfully. The Ucluster algorithm implemented in QIIME was used for operational taxonomic units (OTUs) cluster at a similarity level of 99% [Citation23]. The Silva database (https://www.arb-silva.de/documentation/release-128/) was used as a reference for the RDP classifier with a confidence cutoff of 0.8. Beta diversity indices [Principal coordinate analysis (PCoA) and Bray–Curtis dissimilarity] were calculated at a 97%-similarity cutoff by QIIME. The abundance of each OTU was compared using the subset of 10,000 random reads for each sample. The 16S rRNA sequencing data is available in the Sequence Read Archive (the accession number: PRJNA929354).
Taqman qPCR assay
Concentrations of S. aureus DNA were determined using quantitative TaqMan real-time PCR targeting the single-copy gene. The nuclease (nuc) gene of S. aureus was used for amplification [Citation24]. The qPCR was performed in a 20 μl reaction volume containing 2× KAPA PROBE FAST qPCR Master Mix, primers, TaqMan probe (TGCATCACAAACAGATAACGGCGTAAATAGAAG), and 4 μl of DNA template. The total bacterial loads were determined by testing the expression of 16S rDNA [Citation25]. The negative control contained sterile distilled water instead of template DNA. Amplification was performed on the 7500 Real-Time PCR system. The relative bacterial contents were determined by comparing with the total bacterial loads for every sample. The loads of S. aureus were determined using the standard curves, which was evaluated by adding the templates consisting of S. aureus cells at known concentrations.
Bacteria
All the nasal swabs from recruitments were submerged in 1 ml sterile saline. After votex, 100 μl samples were cultured on sheep blood agar at 37°C for 24 h for bacteria isolation. At least 20 colonies were selected and subjected to species identification using MALDI-TOF-MS (Bruker Daltonics, Bremen, Germany). Briefly, after spotting onto the steel target plate, the bacteria were added with 1 μl 10% formic acid (Sigma F0507) and dried for 5 min at 75°C. After adding 1 μl MALDI matrix [a saturated solution of a-cyano-4-hydroxycinnamic acid (Sigma 70990) in 50% acetonitrile / 2.5% trifluoroacetic acid] to the bacteria, the plate was subjected to the MALDI-TOF MS system for analysis. The spectrum was obtained in linear positive-ion mode range from 2000 to 20,000 Da. Each spot was measured manually on five different positions by using 1000 laser shots at 25 Hz in groups of 40 shots. The spectra was analysed by MALDI Bruker Biotyper 3.0 software and library (Bruker Daltonics). Among all the S. aureus strains, we randomly selected 60 strains from each group with a random number generator (Rand function of Perl5) (Table S1). For RT–PCR and animal experiments, 9 isolates of ST7 and 9 isolates of ST59 were randomly selected from DM and NDM group respectively.
Mouse strains, husbandry, and genotyping
The male db/m (C57BLKS/JGpt) and db/db (Strain NO. T002407, BKS-Leprem2Cd479/Gpt) mice (eight-week-old) were purchased from GemPharmatech Co., Ltd (Nanjing, China). The mice were housed under specific pathogen-free conditions in filter-top cages that were changed bi-monthly by veterinary or research personnel. Sterile water and food were provided ad libitum. Mouse age, sex, lineage, and source facility were tracked for all experiments.
Mouse skin abscess model
Bacterial cultures were spun down and washed with sterile phosphate-buffered saline (PBS) before resuspension for infection. The mice were anesthetized with Avertin (Sigma T48402) by intraperitoneal injection; then, the hair was shaved on the back for db/m and db/db mice. The mice were administered (108 CFU in 100 μl of PBS) by s.c injection. Each day the skin lesion size was measured by length (L) and width (W). The mice were sacrificed on the 2nd day. the skins were surgically removed by a 8-mm punch and homogenized in 500 μl PBS. The homogenized tissues were diluted and then spread on 5% sheep blood agar for CFU determination. The histological analysis was analysed by hematoxylin & eosin (H&E) staining after paraffin embedding.
Real-time quantitative reverse transcription-PCR
For bacteria: The S. aureus isolates were grown to an exponential phase. For animal tissues: The skin tissues were homogenized and resuspended in RLT buffer from the kit (Qiagen). The cell pellets or tissues were broken with a FastPrep-48 (MP Biomedicals Products) at 800 rpm for 300 s three times. After centrifugation, the supernatant was collected for total RNA isolation according to the manufacturer’s instructions (Qiagen). 1 μg of total RNA was treated with DNase and reverse transcribed with a Prime Script RT reagent kit (Qiagen). The RT–PCR was tested using cDNA as a template with SYBR Green PCR reagents (Roche). Reactions were performed in a MicroAmp optical 96-well reaction plate with a 7500 sequence detector (Applied Biosystems). The primers were listed in Table S2.
Competition assay in vitro
The bacteria pairs used for competition assay were listed in Table S3. Here S. aureus ST7-n4343-1 from DM group and ST59-n4225-5 from NDM was used as an example. Bacteria were grown in exponential condition in TSB. After washing in PBS for 3 times, the bacteria was adjusted to the same load (OD600 is around 0.5) in synthetic nasal medium (SNM3). S. aureus ST7-n4343-1 and ST59-n4225-5 were mixed at 1:1 ratio and incubated in SNM3 with different glucose contents with shaking. After co-culture for 6 h, the bacteria was plated to determine CFU on agar plate with or without erythromycin (10 μg/ml) for strain distinction (ST59-n4225-5 is resistant to erythromycin).
Competitive nasal colonization model
The bacteria were prepared as above. ST7-n4343-1 and ST59-n4225-5 or the corresponding deletion mutant strains were mixed equally (107 CFU for each). The mice were anesthetized by intraperitoneal injection with Avertin, and 20 μl aliquots containing 107 CFU were instilled intranasally. The animals were sacrificed on the 2nd day after instilment. The noses were surgically removed and homogenized on ice in 0.5 ml of PBS using a manual homogenizer (Tiagen). The homogenized tissues were diluted and plated on TSB agar with or without erythromycin (10 μg/ml) for strain distinction and determination of CFU.
Statistical analysis
Statistical analysis was performed using GraphPad Prism Version 9.0 or QIIME (Statistical analysis is by 1-way ANOVA and Tukey’s post-test.). All error bars show the mean and standard deviation (SD). The number of replicates or animals used is given in the figure legends.
Results
Demographic analysis
We recruited a total of 323 seniors, of which 149 were diabetes patients (DM, 72.88 ± 6.54 years old) and 174 were not (NDM, 70.95 ± 6.76 years old). The seniors commonly suffer from several diseases, such as chronic pulmonary disease, chronic heart disease, chronic renal disease, chronic liver failure, cerebrovascular disease, neoplastic disease, hypertension, neurological disease, and digestive system disease. When the incidence of these diseases was compared between the NDM and the DM groups, cerebrovascular disease and hypertension were significantly more prevalent among the DM patients (Table S4).
The composition of nasal microbiome in diabetic patients
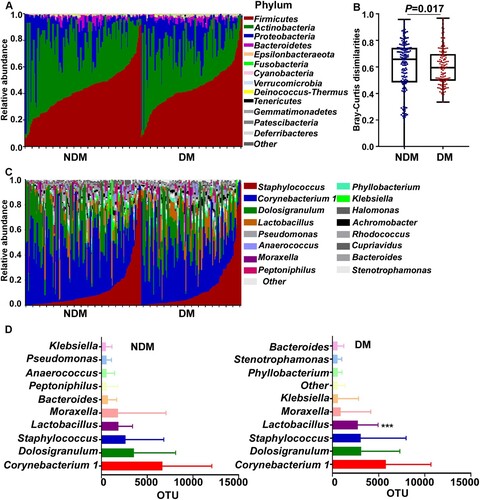
The overall composition of the nasal microbiome was determined by 16S rRNA sequencing and compared between the NDM and the DM groups. Analysis of the major phyla suggested that the microbial composition and diversity were significantly changed between the NDM and the DM group (A&B). In general, Corynebacteria, Dolosigranulum, and Staphylococcus were the top 3 genera in both groups (C&D). Although Firmicutes is the predominant phylum, at the genus level, Corynebacterium, which belongs to the phylum Actinobacteria, was the most prevalent in both groups (D). Among the top 10 genera, Lactobacillus was significantly more abundant in the DM group than in the NDM group (D).
Figure 1. The nasal microbiome composition of the test subjects. (A) Relative abundance of the major phyla in the NDM and the DM groups. (B) Bray-Curtis dissimilarity of the two groups (phylum level). Statistical analysis was done by 1-way ANOVA and Tukey’s post-test. Error bars show minima and maxima. (C) Relative abundance of major genera in the nasal microbiome of single individuals in the NDM and the DM groups. (D) The abundance of major genera in the NDM and the DM groups. Bars depict means; error bars indicate SD. NDM, non-diabetes; DM, diabetes. Statistical evaluation was analysed by ANCOM. ***P < 0.001.
S. Aureus is more abundant in DM patients
The abundance of the predominant genera was not significantly different between the NDM and the DM groups (A). Since S. aureus infections are frequent in DM patients, we determined the abundance of S. aureus by TaqMan qPCR targeting the nuclease (nuc) gene expression. Intriguingly, S. aureus appears to be significantly more abundant in DM patients (B).
Figure 2. Distinct sequence types of S. aureus colonize the NDM and the DM groups. (A) The abundance comparison of the top three genera. (B) The abundance of S. aureus was assessed by TaqMan qPCR assay of the nuclease (nuc) gene. The results are presented as the mean ± SD. Statistical significance was evaluated by the Kruskal-Wallis test, followed by Dunn’s multiple comparisons test. *P < 0.05. (C) The culture-based analysis of Staphylococcus species in the NDM and the DM groups. (D) The MLST types of 60 S. aureus strains selected from each test group. Sixty strains were randomly selected and tested by PCR. NDM, non-diabetes; DM, diabetes.
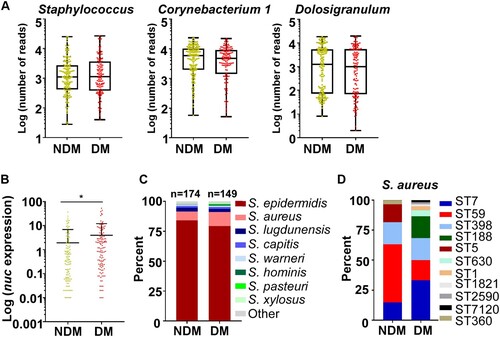
The higher abundance of S. aureus in the TaqMan analysis implies that the composition of staphylococcal species might be different in the NDM and DM groups. To test this conjecture, the relative abundance of staphylococcal species from the original samples was analysed by culture. Coinciding with the TaqMan analysis, the abundance of S. aureus was significantly higher in the DM group, which was accompanied by a decrease in S. epidermidis (C). We further determined the sequence types of the S. aureus strains. Sixty S. aureus isolates were randomly selected (Table S1). While the considerable heterogeneity was observed, the dominant S. aureus ST was different between the groups: ST59 was dominant in the NDM group, whereas ST7 was dominant in the DM group (D).
Blood glucose levels can affect the colonization of Staphylococcus ST types
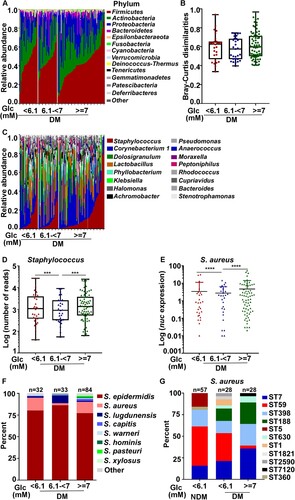
The higher nasal colonization of S. aureus in the DM group (B) suggests that the nasal colonization of Staphylococcus might be affected by blood glucose level. In our study, most diabetic patients controlled their fasting blood glucose levels (FBGs) within the normal range (FBG < 6.1 mM); however, some patients didn’t, and their FBG remained high (FBG ≥ 7.0 mM). Therefore, we divided the diabetic patients into three groups by their FBG levels: normal, FBG < 6.1 mM; impaired glucose tolerance (IGT), 6.1 mM ≤ FBG < 7.0 mM; poorly controlled, FBG ≥ 7.0 mM. On a phylum level, the overall composition of the nasal microbiome was not significantly different among the groups (A&B). Interestingly, the abundance of Staphylococcus genus was substantially lower in the IGT group (C&D). TaqMan qPCR assay of the nuc gene also showed that the abundance of S. aureus was the lowest in the IGT group (E). On the species level, the IGT group showed the highest S. epidermidis and the lowest S. aureus levels (F). Although intriguing, we did not further investigate the lower S. aureus colonization in the IGT group because of the small sample size (7 S. aureus isolates; 4 ST7 in the DM group and 3 ST59 in the NDM group). To our surprise, when the STs were determined for S. aureus strains in the normal and the poorly controlled FBG groups, the normal FBG group showed ST composition similar to that of the NDM group in terms of the ratio of ST7 and ST59 (G). ST59 was dominant in both NDM and the normal FBG group, whereas, in the uncontrolled FBG group, ST7 was dominant. These results indicate that FBG levels could affect the colonization of S. aureus ST strains.
Figure 3. The effect of fasting blood glucose (FBG) concentration on bacterial colonization. (A) Relative abundance of the major phyla in investigated individuals with different glucose concentration in the DM group. (B) Bray-Curtis dissimilarity of individuals with different blood glucose concentration in the DM group (phylum level). Statistical analysis is by 1-wayANOVA and Tukey’s post-test. Error bars show minima and maxima. (C) Relative abundance of major genera in the nasal microbiome of single individuals in the DM group. (D) Abundance of Staphylococci of single individuals in the DM group. Error bars show minima and maxima. Statistical evaluation was analysed by ANCOM. ***P < 0.001. (E) The abundance of S. aureus was determined in diabetes patients with different FBG concentration using a TaqMan qPCR assay targeting the nuclease (nuc) gene. The results are presented as the mean ± SD. Statistical evaluationswere performed using the Kruskal-Wallis test following by Dunn’s multiple comparisons test. ****P < 0.0001. (F) The culture-based analysis of Staphylococcus species in diabetes patients with different FBG concentration. (G) S. aureus MLST typing was analysed in the NDM group with normal FBG level and diabetic patients with different FBG concentration . Glc, glucose.
The antimicrobial activity of coagulase-negative Staphylococcus alone cannot explain the suppressive effect on the colonization of S. aureus
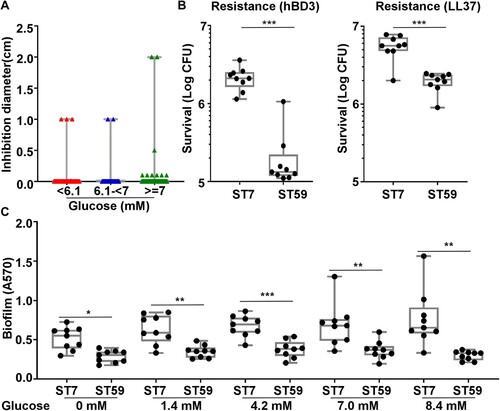
In the culture-based analysis, the abundance of S. aureus seems to show an inverse relationship to that of coagulase-negative Staphylococci (CoNS) (B). Since CoNS produce bacteriocins, which can inhibit S. aureus growth [Citation26], we hypothesized that the bacteriocin produced by CoNS limits the colonization of S. aureus. To test this hypothesis, we tested 240 S. epidermidis isolates and all 78 other CoNS isolates for their antimicrobial activities by measuring the growth inhibition zone of S. aureus in vitro. To our surprise, only 8 isolates inhibited the growth of S. aureus (A). Among the 8 CoNS with antimicrobial activity, 7 S. epidermidis (3 from the normal FBG group, 2 from the IGT group, 2 from the high FBG group) displayed antimicrobial activity against S. aureus. The MLST of the 7 S. epidermidis strains with antimicrobial activity was diverse, including ST820, ST16, ST210, ST248, and ST20. There was no significant difference in the bacteriocin production among the three FBG groups, suggesting that the bacteriocin production alone cannot explain the apparent suppressive role of CoNS on the colonization of S. aureus.
Figure 4 .#The antimicrobial resistance and biofilm formation of S. aureus ST7 and ST59 strains. (A) The antimicrobial activity of coagulase-negative Staphylococcus is not significantly different among isolates from patients with different levels of fasting blood glucose levels. (B) The resistance to two human antimicrobial peptides was compared for 9 randomly selected ST7 and ST59 strains. The bacteria were grown to the exponential growth phase and mixed together with hBD3 (75 μg/ml) or LL37 (75 μg/ml). After 3 h incubation at 37°C, bacteria were spread on sheep blood agar for CFU counting. (C) The randomly selected strains were also subjected to the biofilm formation assay. The strains were grown in TSB with different concentrations of glucose at 37°C for 24 h in a 96-well plate. The data were collected from three biological repeats. The statistical significance was measured by unpaired, two-tailed Student’s t test. *P < 0.05; **P < 0.01; ***P < 0.001.
S. aureus ST7 strains are more resistant to human antimicrobial peptides and form biofilm better than ST59 strains
The antimicrobial peptides (AMPs) produced by epithelial cells are important innate immune defenses against pathogens. To examine whether resistance to AMPs is related to the nasal colonization of specific STs, the randomly selected ST7 and ST59 were compared for their resistance to two major human AMPs: hBD3 and LL37. As shown, most ST7 strains were more resistant to both AMPs than ST59 (B).
Since biofilm formation is another relevant attribute for nasal colonization, we compared the biofilm formation of the ST7 and ST59. Again, ST7 strains formed more biofilm than ST59 strains (C). The increase of ST7 biofilm with the rise of glucose concentration might contribute to the successful colonization of ST7 in diabetic patients with a high FBG level.
S. aureus ST7 is more virulent than ST59
Since the colonization of ST7 and ST59 strains seem to be affected by FBG levels, we questioned whether there is an innate difference between the two ST strains. The virulence of ST7 and ST59 isolates were compared by infecting on the skin of hairless mice. Intriguingly, ST7 isolates produced a larger size of skin abscesses, as compared with ST59 isolates at 2 d post-infection (A&B). The CFU counting showed that ST7 strains survived better than ST59 strains (C). The ST7-infected tissues also showed increased infiltration of inflammantory cells by histopathological analysis (D). We also observed the significantly increased IL-6 production in ST7-infected mouse tissues (E). The significantly larger size of skin abscesses were also observed in ST7-infected group compared with ST59-infected group at 2 d post-infection using the db/m non-diabetic mice (F&G). Interestingly, there are no significant differences of bacterial loads between ST7 and ST59-infected groups on the skin of the db/m non-diabetic mice (H).
Figure 5. S. aureus ST7 cause more severe skin infection compared with ST59 in mouse model. The naked mouse or the non-diabetic mouse (one mouse / isolate, n = 9 mice/group) was infected with the test ST7 and ST59 strains (108 CFU) via a subcutaneous injection. Skin abscesses of the infected mice were observed on day 2 after infection. (A) Abscess pictures for naked mouse. (B) Abscess sizes measured 2 d post-infection for naked mouse. (C) Bacterial loads in the infected skin tissues of naked mouse. (D) Histopathological analysis of skin abscess of naked mouse. Representative pictures are shown. (E) Levels of cytokine il6 gene expression 2 d -abscesses of naked mouse determined by qRT-PCR. (F) Abscess pictures for non-diabetic mouse. (G) Abscess sizes measured 2 d post-infection for non-diabetic mouse. (H) Bacterial loads in the infected skin tissues of non-diabetic mouse. The diabetic mouse model (n = 5 mice/group) was infected with a representative strain of ST7 or ST59 (108 CFU) by subcutaneous injection. (I) Abscess pictures. (J) Abscess sizes measured 2 d post-infection. (K) Bacterial loads in the skin tissues. The data were collected from two biological repeats. The statistical significance was measured by unpaired, two-tailed Student’s t test. *P < 0.05; **P < 0.01; ***P < 0.001.
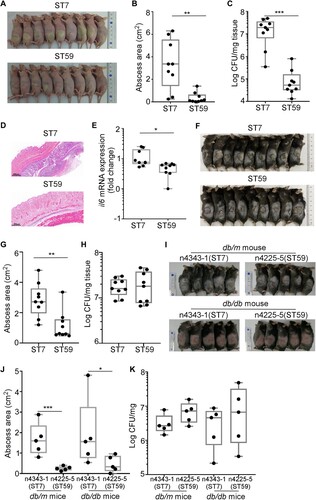
The skin infection experiment was also confirmed with the db/db diabetic and the db/m non-diabetic mice using one randomly selected strain (ST7-n4343-1 and ST59-n4225-5). ST7-n4343-1 also produced larger abscesses than ST59-n4225-5, regardless of the diabetes condition of the mice (I&J). Intriguingly, however, the bacterial loads in the infected skin tissues were not significantly different (K). Based on these results, we concluded that S. aureus ST7 strains are, in general, more virulent than ST59 strains.
S. aureus ST7 have a higher SaeRS activity than ST59
S. aureus ST7 strains appeared to have more virulence traits than ST59 strains (). In S. aureus, the production of virulence factors is controlled by multiple global regulators [Citation13]. To understand the virulence difference between the ST7 and ST59 strains, we compared the transcript levels of the following 9 global regulators: rot, SaeRS two-component system (TCS), RNAIII, sigB, sarA, sarS, sarR, mgrA, and codY [Citation27–30]. Of the tested regulators, only rot and SaeRS TCS showed a significant difference: the transcription of rot was higher in ST59, whereas the transcription of saeS and saeR was higher in ST7 (A). It is well established that rot (repressor of toxins) suppresses toxin production, whereas the SaeRS TCS activates it [Citation14,Citation31]. Therefore, it is expected that ST7 is more toxogenic than ST59. To test whether the predominant ST type can represent the strains from different groups, the transcription levels of rot, saeS and saeR were further compared between the strains randomly selected from DM and NDM groups. We observed that rot was significantly highly expressed in S. aureus strains isolated from NDM group, while the transcription levels of saeS and saeR were significantly increased in the strains isolated from DM group (Figure S1).
Figure 6. S. aureus ST7 strains have a higher SaeRS activity than the ST59 strains. (A) The expression of the main virulence regulators was compared between S. aureus ST7 and ST59. (B) The expression of Sae-targets genes with low affinity were compared between S. aureus ST7 and ST59. (C) The expression of hla with high affinity to SaeRS TCS were compared between S. aureus ST7 and ST59. (D/E) The expression of SaeRS-unrelated genes were compared between S. aureus ST7 and ST59. The transcript levels were measured by qRT-PCR, using gyrB as a reference. The data were collected from three biological repeats. The statistical significance was measured by unpaired, two-tailed Student’s t test. *P < 0.05;**P < 0.01; ***P < 0.001.
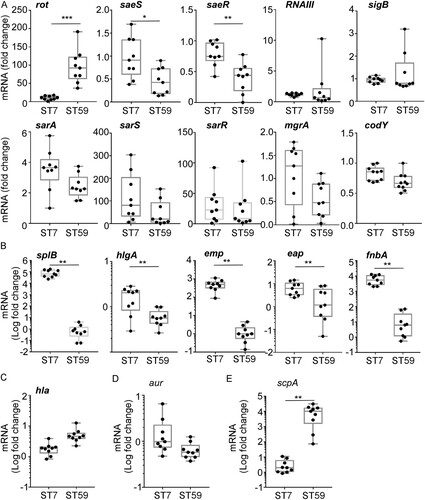
The transcription of the sae operon is positively autoregulated [Citation32]. To confirm whether ST7 strains have a higher Sae activity, we compared the transcript levels of five low-affinity (i.e. splB, hlgA, emp, eap, and fnbA) and a high-affinity (i.e. hla) Sae target genes [Citation15], along with a possible target gene (i.e. aur) and a non-target gene (i.e. scpA). As shown, the transcriptions of all low-affinity target genes were higher in ST7 strains (B). On the other hand, the transcription of hla, a high-affinity target, was not significantly different (C), indicating that the basal Sae activity in ST59 is sufficient to support the full activity of the hla promoter. Transcription of aur, a possible Sae target, was not significantly different between the two sequence types (D). Intriguingly, the non-Sae target gene, scpA, showed a higher transcription in ST59 (E). Based on these results, we concluded that, overall, ST7 stains have a higher SaeRS activity than ST59 strains.
The higher SaeRS activity confers a growth advantage to ST7 in high glucose conditions
Next, we asked whether the higher Sae activity could provide a growth advantage to ST7 strain over ST59 strains in diabetic conditions. A growth competition assay was carried out using the strain for animal test. To imitate the growth condition, a synthetic nasal medium SNM3, which contains 2.1 mM glucose was used [Citation33]. Without further glucose addition, both strains showed similar growth; however, when the final glucose concentration was adjusted to 5.6, 9.1, or 12.6 mM, ST7-n4343-1 outcompeted ST59-n4225-5 (A). When the sae operon was deleted, the glucose-dependent growth advantage of ST7-n4343-1 disappeared (B). To confirm whether the observed phenotypes from the dominant ST type could reflect the strains from different groups, another four pairs of strains were selected from DM and NDM group with different antibiotic resistance for the competition assay (Table S3). We observed that ST7, ST630 or ST188 from DM group outcompeted ST59 or ST5 from NDM group in higher glucose condition (C).
Figure 7. SaeRS is critical for the growth and colonization advantage of S. aureus ST7 over ST59 . The competition was tested between ST7-n4343-1 and ST59-n4225-5 (A) and the corresponding sae deletion mutant strains (B) by co-culture the two strains in synthetic nasal medium (SNM3). The data were collected from three biological repeats and the statistical significance was measured by one-way ANOVA. (C) The competition was tested between another 4 pairs of strains from DM and NDM group by co-culture each pair of strains in SNM3. The strains were listed in Table S3. The data were polled from two biological repeats with three replicates every time and the statistical significance was measured by unpaired, two-tailed Student’s t test. (D) The blood glucose contents were compared between wild-type mouse (db/m) and diabetic mouse (db/db). (E) The nasal colonization of ST7-n4343-1 and ST59-n4225-5 was compared in diabetic mouse (db/db). (F) The competition between ST7-n4343-1 and ST59-n4225-5 and the corresponding sae deletion mutant strains was compared between wild-type mouse (db/m) and diabetic mouse (db/db). The bacterial CFU was determined after co-culture for 6 h in SNM3 or 2 days after nasal colonization in vivo. The two strains were differentiated by the resistance to erythromycin. The data for the animal test were repeated twice. The statistical significance was measured by unpaired, two-tailed Student’s t test. *P < 0.05; **P < 0.01; ***P < 0.001.
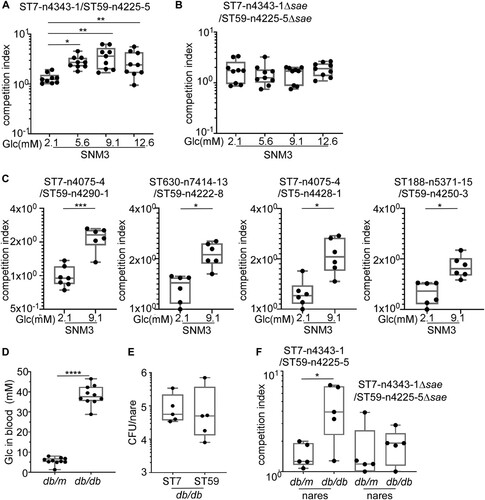
The colonization and growth of the two strains were further compared in diabetic mice. The diabetic (db/db) mice showed much higher blood glucose concentration than non-diabetic (db/m) mice (D). When the WT strains of ST7-n4343-1 and ST59-n4225-5 were inoculated individually in the nares of diabetic mice, they showed a similar colonization efficiency (E). However, when the two strains were mixed and inoculated together, ST7-n4343-1 showed a much higher growth advantage over ST59-n4225-5 in diabetic mice but not in non-diabetic mice (F). Intriguingly, when sae-deletion mutants were used, the growth advantage of the ST7 strain in diabetic mice was greatly reduced (F). To exclude the possibility that the presence of antibiotic resistance affect the results, another pair of ST7-n4075-4 (resistant to erythromycin) and ST59-n4290-1 (sensitive to erythromycin) (Table S3) was used for the competition assay in animal model. We observed that ST7-n4075-4 outcompeted ST59-n4290-1 in diabetic mouse (Figure S2). These results indicate that the higher Sae activity helps ST7 outcompete ST59 in the nasal colonization of diabetic environment.
Discussion
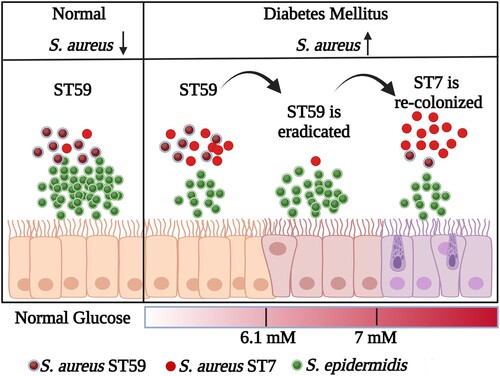
Diabetic foot infections are a significant clinical issue often caused by S. aureus, which is commonly found in the nasal passages and a risk factor for staphylococcal infections [Citation34–36]. Our study discovered that diabetic patients have a less diverse nasal microbiome and a higher incidence of S. aureus colonization. Additionally, we observed the shift of S. aureus ST with the increase of FBG level (). The replacement of ST59 by the highly virulent S. aureus ST7 poses a potential risk for infection. These findings emphasize the importance of managing blood glucose levels in diabetic patients to decrease the risk of severe S. aureus infections.
Figure 8. The model for the replacement of S. aureus ST types with the increase of glucose. The graphic is created with BioRender.com.
The microbiome has gained much attention in the prevention and treatment of infectious diseases [Citation37]. In diabetic patients, the diversity of the nasal microbiome is significantly decreased (). Although diabetes mellitus causes the reconstruction of the nasal microbiome, the abundance of Staphylococci is only affected by FBG level. In the IGT group of diabetic patients, decreased S. aureus colonization occurred with increased colonization of S. epidermidis and Staphylococcus lugdunensis (F). The nasal CoNS play a crucial role in defending against S. aureus [Citation38]. S. lugdunensis significantly reduced S. aureus colonization by producing lugdunin [Citation39]. Nasal colonized S. epidermidis produces antimicrobial molecules that defend against Micrococcus lutues, Moraxella catarrhalis, etc., especially under habitat-specific stress conditions [Citation40]. Unknown antimicrobial peptides produced by S. epidermidis, in synergy with LL37, selectively kill S. aureus [Citation41]. Moreover, nasal colonized S. epidermidis enhances innate immunity by inducing the production of AMPs from human keratinocytes [Citation42]. In our study, only 8 isolates among the tested 318 CoNS displayed antimicrobial activity against S. aureus (A). This indicates that the inverse correlation between S. aureus and CoNS is probably not due to the antimicrobial activity of CoNS.
S. aureus ST7 is a prevalent cause of bovine mastitis and can also cause infections in humans [Citation43,Citation44]. It is one of the most common STs found in methicillin-sensitive S. aureus and is the second most frequent cause of skin and soft-tissue infections in Shanghai, China [Citation45,Citation46]. ST7 strains have a high prevalence of pore-forming toxins LukED, which are associated with evading the innate immune system [Citation47]. Our study found ST7 to be more virulent than ST59 strains, possibly due to increased activity of the SaeRS TCS ( and ), which activates over 20 virulence factors [Citation44,Citation48]. This higher SaeRS TCS activity may explain the larger skin lesion size, better survival, and higher levels of IL-6 mRNA in vivo ().
Interestingly, the highly virulent S. aureus ST7 also exhibited superior biofilm formation and antimicrobial peptide resistance (). Antimicrobial peptide resistance in S. aureus is facilitated by modifications of the cell envelope, such as reducing anionic charges by attaching an L-lysine to the major phospholipid phosphatidylglycerol via the multiple peptide resistance factor (MprF) protein, and decreasing negative charges by incorporating D-alanine in teichoic acids through the DltABCD proteins [Citation49–52]. Moreover, the phenol-soluble modulin transporter (Pmt) also confers antimicrobial peptide resistance to S. aureus [Citation53]. However, the expression of MprF, DltABCD, and Pmt is not regulated by the SaeRS TCS, which raises the question of the mechanism underlying the superior antimicrobial peptide resistance of ST7. Similarly, the role of the SaeRS TCS in biofilm formation remains unclear. While surface proteins, ica-mediated polysaccharides, and extracellular DNA contribute to biofilm formation in S. aureus, the SaeRS TCS regulates both biofilm-promoting surface proteins (e.g. Eap) and biofilm-degrading nucleases [Citation54–56]. Furthermore, in the Newman strain, the constitutively active sensor kinase SaeS L18P resulted in poor biofilm formation [Citation57,Citation58]. Therefore, while the SaeRS TCS appears to be crucial for the virulence of ST7, other regulatory systems or factors likely contribute to the colonization advantage of ST7 over ST59.
It appears that glucose enhances the growth and colonization competitiveness of ST7 over ST59 (). Glucose is a critical source of energy and carbon for synthesizing cellular components such as amino acids, nucleotides, and lipids, as well as reducing power molecules [Citation59]. S. aureus utilizes four glucose transporters to maximize glucose uptake [Citation60]. Additionally, glucose is the primary determinant of regulation by the catabolite control protein (CcpA), which affects not only carbon and amino acid metabolism but also bacterial virulence [Citation61]. It is possible that ST7 strains use glucose more efficiently than ST59 strains, giving them a competitive advantage in higher glucose concentrations. However, the exact molecular mechanism remains to be further elucidated.
One limitation of our study is that the DM group had a significantly higher comorbidity of cerebrovascular diseases and hypertension (Table S3). Cardio-metabolic diseases can impact the human microbiome, and hypertension has been shown to alter the evenness, richness, and diversity of gut microbiome [Citation62]. Therefore, we cannot exclude the possibility that the differences in comorbidity may also contributed to the altered diversity of the nasal microbiome in diabetic patients. Interestingly, among the top 10 genera of the nasal microbiome, Lactobacillus was the only genus significantly more abundant in the DM group (). Lactobacillus is typically considered a probiotic, but inconsistent changes in Lactobacillus have been reported in the gut microbiome of diabetic patients, with most studies showing a positive association between Lactobacillus and diabetes [Citation63]. As the role of Lactobacillus appears to be species-specific, further research at the species level is necessary to clarify the exact role of Lactobacillus.
In summary, our results showed that certain ST types of pathogenic bacteria tend to accumulate in the nasal microbiome. The predominant abundance of the highly virulent S. aureus ST7 in the nasal microbiome of diabetic patients poses a potential risk for infection. Our results also indicate that the SaeRS TCS regulator is a crucial factor in the competitive fitness of the S. aureus ST7 lineage. As such, it is essential to monitor and eliminate nasal S. aureus colonization in patients with diabetes and elevated fasting blood glucose levels to ensure proper care.
revised_Supplementary_materials
Download MS Word (225.1 KB)Disclosure statement
No potential conflict of interest was reported by the author(s).
Additional information
Funding
References
- Pickup JC. Inflammation and activated innate immunity in the pathogenesis of type 2 diabetes. Diabetes Care. 2004 Mar;27(3):813–823. doi:10.2337/diacare.27.3.813
- Saeedi P, Petersohn I, Salpea P, et al. Global and regional diabetes prevalence estimates for 2019 and projections for 2030 and 2045: results from the international diabetes federation diabetes atlas, 9(th) edition. Diabetes Res Clin Pract. 2019 Nov;157:107843, doi:10.1016/j.diabres.2019.107843
- Wu SC, Driver VR, Wrobel JS, et al. Foot ulcers in the diabetic patient, prevention and treatment. Vasc Health Risk Manag. 2007;3(1):65–76.
- Armstrong DG, Boulton AJM, Bus SA. Diabetic foot ulcers and their recurrence. N Engl J Med. 2017 Jun 15;376(24):2367–2375. doi:10.1056/NEJMra1615439
- Zhang P, Lu J, Jing Y, et al. Global epidemiology of diabetic foot ulceration: a systematic review and meta-analysis (dagger). Ann Med. 2017 Mar;49(2):106–116. doi:10.1080/07853890.2016.1231932
- Patel S, Srivastava S, Singh MR, et al. Mechanistic insight into diabetic wounds: pathogenesis, molecular targets and treatment strategies to pace wound healing. Biomed Pharmac. 2019 Apr;112:108615, doi:10.1016/j.biopha.2019.108615
- Pitocco D, Spanu T, Di Leo M, et al. Diabetic foot infections: a comprehensive overview. Eur Rev Med Pharmacol Sci. 2019 Apr;23(Suppl. 2):26–37.
- Singh N, Armstrong DG, Lipsky BA. Preventing foot ulcers in patients with diabetes. JAMA: J Am Med Assoc. 2005 Jan 12;293(2):217–228. doi:10.1001/jama.293.2.217
- Zhang QR, Chen H, Liu B, et al. Methicillin-resistant Staphylococcus aureus pneumonia in diabetics: a single-center, retrospective analysis. Chin Med J. 2019 Jun 20;132(12):1429–1434. doi:10.1097/CM9.0000000000000270
- Lipsky BA, Tabak YP, Johannes RS, et al. Skin and soft tissue infections in hospitalised patients with diabetes: culture isolates and risk factors associated with mortality, length of stay and cost. Diabetologia. 2010 May;53(5):914–923. doi:10.1007/s00125-010-1672-5
- Turner NA, Sharma-Kuinkel BK, Maskarinec SA, et al. Methicillin-resistant Staphylococcus aureus: an overview of basic and clinical research. Nat Rev Microbiol. 2019 Apr;17(4):203–218. doi:10.1038/s41579-018-0147-4
- Cheung GYC, Bae JS, Otto M. Pathogenicity and virulence of Staphylococcus aureus. Virulence. 2021 Dec;12(1):547–569. doi:10.1080/21505594.2021.1878688
- Jenul C, Horswill AR. Regulation of Staphylococcus aureus virulence. Microbiol Spectr. 2019 Apr 5;7(2). doi:10.1128/microbiolspec.GPP3-0031-2018
- Liu Q, Yeo WS, Bae T. The SaeRS two-component system of Staphylococcus aureus. Genes (Basel). 2016 Oct 03;7(10):81. doi:10.3390/genes7100081
- Cho H, Jeong DW, Li C, et al. Organizational requirements of the SaeR binding sites for a functional P1 promoter of the sae operon in Staphylococcus aureus. J Bacteriol. 2012 Jun;194(11):2865–2876. doi:10.1128/JB.06771-11
- Zhao N, Cheng D, Yang Z, et al. Virulence adaption to environment promotes the age-dependent nasal colonization of Staphylococcus aureus. Emerg Microbes Infect. 2022 Dec;11(1):1402–1415. doi:10.1080/22221751.2022.2074316
- Lakhundi S, Zhang K. Methicillin-resistant Staphylococcus aureus: molecular characterization, evolution, and epidemiology. Clin Microbiol Rev. 2018 Oct;31(4). doi:10.1128/CMR.00020-18
- Kalan LR, Meisel JS, Loesche MA, et al. Strain- and species-level variation in the microbiome of diabetic wounds is associated with clinical outcomes and therapeutic efficacy. Cell Host Microbe. 2019 May 8;25(5):641–655e5. doi:10.1016/j.chom.2019.03.006
- Dunyach-Remy C, Courtais-Coulon C, DeMattei C, et al. Link between nasal carriage of Staphylococcus aureus and infected diabetic foot ulcers. Diabetes Metab. 2017 Apr;43(2):167–171. doi:10.1016/j.diabet.2016.09.003
- Patel H, Rawat S. A genetic regulatory see-saw of biofilm and virulence in MRSA pathogenesis. Front Microbiol. 2023;14:1204428. doi:10.3389/fmicb.2023.1204428
- Magoc T, Salzberg SL. FLASH: fast length adjustment of short reads to improve genome assemblies. Bioinformatics. 2011 Nov 1;27(21):2957–2963. doi:10.1093/bioinformatics/btr507
- Edgar RC, Haas BJ, Clemente JC, et al. UCHIME improves sensitivity and speed of chimera detection. Bioinformatics. 2011 Aug 15;27(16):2194–2200. doi:10.1093/bioinformatics/btr381
- Caporaso JG, Bittinger K, Bushman FD, et al. PyNAST: a flexible tool for aligning sequences to a template alignment. Bioinformatics. 2010 Jan 15;26(2):266–267. doi:10.1093/bioinformatics/btp636
- Redel H, Gao Z, Li H, et al. Quantitation and composition of cutaneous microbiota in diabetic and nondiabetic men. J Infect Dis. 2013 Apr;207(7):1105–1114. doi:10.1093/infdis/jit005
- Wang HY, Kim S, Kim J, et al. Multiplex real-time PCR assay for rapid detection of methicillin-resistant staphylococci directly from positive blood cultures. J Clin Microbiol. 2014 Jun;52(6):1911–1920. doi:10.1128/JCM.00389-14
- Parlet CP, Brown MM, Horswill AR. Commensal staphylococci influence Staphylococcus aureus skin colonization and disease. Trends Microbiol. 2019 Jun;27(6):497–507. doi:10.1016/j.tim.2019.01.008
- Li D, Cheung A. Repression of hla by rot is dependent on sae in Staphylococcus aureus. Infect Immun. 2008 Mar;76(3):1068–1075. doi:10.1128/IAI.01069-07
- Zielinska AK, Beenken KE, Mrak LN, et al. sarA-mediated repression of protease production plays a key role in the pathogenesis of Staphylococcus aureus USA300 isolates. Mol Microbiol. 2012 Dec;86(5):1183–1196. doi:10.1111/mmi.12048
- Stenz L, Francois P, Whiteson K, et al. The CodY pleiotropic repressor controls virulence in gram-positive pathogens. FEMS Immunol Med Microbiol. 2011 Jul;62(2):123–139. doi:10.1111/j.1574-695X.2011.00812.x
- Cheung AL, Bayer AS, Zhang G, et al. Regulation of virulence determinants in vitro and in vivo in Staphylococcus aureus. FEMS Immunol Med Microbiol. 2004 Jan 15;40(1):1–9. doi:10.1016/S0928-8244(03)00309-2
- Killikelly A, Benson MA, Ohneck EA, et al. Structure-based functional characterization of repressor of toxin (rot), a central regulator of Staphylococcus aureus virulence. J Bacteriol. 2015 Jan 1;197(1):188–200. doi:10.1128/JB.02317-14
- Jeong DW, Cho H, Lee H, et al. Identification of the P3 promoter and distinct roles of the two promoters of the SaeRS two-component system in Staphylococcus aureus. J Bacteriol. 2011 Sep;193(18):4672–4684. doi:10.1128/JB.00353-11
- Krismer B, Liebeke M, Janek D, et al. Nutrient limitation governs Staphylococcus aureus metabolism and niche adaptation in the human nose. PLoS Pathog. 2014 Jan;10(1):e1003862. doi:10.1371/journal.ppat.1003862
- Dunyach-Remy C, Ngba Essebe C, Sotto A, et al. Staphylococcus aureus toxins and diabetic foot ulcers: role in pathogenesis and interest in diagnosis. Toxins (Basel). 2016 Jul 7;8(7). doi:10.3390/toxins8070209
- Seo KS, Park N, Rutter JK, et al. Role of glucose-6-phosphate in metabolic adaptation of Staphylococcus aureus in diabetes. Microbiol Spectr. 2021 Oct 31;9(2):e0085721.
- von Eiff C, Becker K, Machka K, et al. Nasal carriage as a source of Staphylococcus aureus bacteremia. study group. N Engl J Med. 2001 Jan 4;344(1):11–16. doi:10.1056/NEJM200101043440102
- Libertucci J, Young VB. The role of the microbiota in infectious diseases. Nature Microbiol. 2019 Jan;4(1):35–45. doi:10.1038/s41564-018-0278-4
- Brugger SD, Bomar L, Lemon KP. Commensal-pathogen interactions along the human nasal passages. PLoS Pathog. 2016 Jul;12(7):e1005633. doi:10.1371/journal.ppat.1005633
- Zipperer A, Konnerth MC, Laux C, et al. Human commensals producing a novel antibiotic impair pathogen colonization. Nature. 2016 Jul 28;535(7613):511–516. doi:10.1038/nature18634
- Janek D, Zipperer A, Kulik A, et al. High frequency and diversity of antimicrobial activities produced by nasal staphylococcus strains against bacterial competitors. PLoS Pathog. 2016 Aug;12(8):e1005812. doi:10.1371/journal.ppat.1005812
- Nakatsuji T, Chen TH, Narala S, et al. Antimicrobials from human skin commensal bacteria protect against Staphylococcus aureus and are deficient in atopic dermatitis. Sci Transl Med. 2017 Feb 22;9(378). doi:10.1126/scitranslmed.aah4680
- Liu Q, Liu Q, Meng H, et al. Staphylococcus epidermidis contributes to healthy maturation of the nasal microbiome by stimulating antimicrobial peptide production. Cell Host Microbe. 2020 Jan 8;27(1):68–78e5. doi:10.1016/j.chom.2019.11.003
- Li T, Lu H, Wang X, et al. Molecular characteristics of Staphylococcus aureus causing bovine mastitis between 2014 and 2015. Front Cell Infect Microbiol. 2017;7(127).
- Obasuyi O, McClure J, Oronsaye FE, et al. Molecular characterization and pathogenicity of Staphylococcus aureus isolated from Benin-city, Nigeria. Microorganisms. 2020 Jun 16;8(6). doi:10.3390/microorganisms8060912
- Zhu H, Luo H, Zhong Q, et al. Comparison of molecular characteristics between methicillin-resistant and -susceptible Staphylococcus aureus clinical isolates by whole-genome sequencing. Infect Drug Resist. 2022;15:2949–2958. doi:10.2147/IDR.S359654
- Gu FF, Hou Q, Yang HH, et al. Characterization of Staphylococcus aureus isolated from non-native patients with skin and soft tissue infections in Shanghai. PLoS One. 2015;10(4):e0123557.
- McCarthy AJ, Lindsay JA. Staphylococcus aureus innate immune evasion is lineage-specific: a bioinfomatics study. Infect Genet Evol. 2013 Oct;19:7–14. doi:10.1016/j.meegid.2013.06.012
- Sun F, Li C, Jeong D, et al. In the Staphylococcus aureus two-component system sae, the response regulator SaeR binds to a direct repeat sequence and DNA binding requires phosphorylation by the sensor kinase SaeS. J Bacteriol. 2010 Apr;192(8):2111–2127. doi:10.1128/JB.01524-09
- Weidenmaier C, Peschel A, Kempf VA, et al. DltABCD- and MprF-mediated cell envelope modifications of Staphylococcus aureus confer resistance to platelet microbicidal proteins and contribute to virulence in a rabbit endocarditis model. Infect Immun. 2005 Dec;73(12):8033–8038. doi:10.1128/IAI.73.12.8033-8038.2005
- Yang SJ, Bayer AS, Mishra NN, et al. The Staphylococcus aureus two-component regulatory system, GraRS, senses and confers resistance to selected cationic antimicrobial peptides. Infect Immun. 2012 Jan;80(1):74–81. doi:10.1128/IAI.05669-11
- Ernst CM, Staubitz P, Mishra NN, et al. The bacterial defensin resistance protein MprF consists of separable domains for lipid lysinylation and antimicrobial peptide repulsion. PLoS Pathog. 2009 Nov;5(11):e1000660. doi:10.1371/journal.ppat.1000660
- Caruso C, Colantuono S, Ciasca G, et al. Different aspects of severe asthma in real life: role of Staphylococcus aureus enterotoxins and correlation to comorbidities and disease severity. Allergy. 2023 Jan;78(1):131–140. doi:10.1111/all.15466
- Yang Z, Qiu B, Cheng D, et al. Virulent Staphylococcus aureus colonizes pediatric nares by resisting killing of human antimicrobial peptides. Int J Med Microbiol. 2022 Jan 24;312(2):151550. doi:10.1016/j.ijmm.2022.151550
- Paharik AE, Horswill AR. The staphylococcal biofilm: adhesins, regulation, and host response. Microbiol Spectr. 2016 Apr;4(2). doi:10.1128/microbiolspec.VMBF-0022-2015
- Olson ME, Nygaard TK, Ackermann L, et al. Staphylococcus aureus nuclease is a SaeR/S-dependent virulence factor. Infect Immun. 2013 Feb 4;81(4):1316–1324. doi:10.1128/IAI.01242-12
- Harraghy N, Kormanec J, Wolz C, et al. sae is essential for expression of the staphylococcal adhesins Eap and Emp. Microbiology. 2005 Jun;151(Pt 6):1789–1800. doi:10.1099/mic.0.27902-0
- Cue D, Junecko JM, Lei MG, et al. SaeRS-dependent inhibition of biofilm formation in Staphylococcus aureus newman. PLoS One. 2015;10(4):e0123027.
- DelMain EA, Moormeier DE, Endres JL, et al. Stochastic expression of sae-dependent virulence genes during Staphylococcus aureus biofilm development Is dependent on SaeS. MBio. 2020 Jan 14;11(1). doi:10.1128/mBio.03081-19
- Qi X, Tester RF. Fructose, galactose and glucose – in health and disease. Clin Nutr ESPEN. 2019 Oct;33:18–28. doi:10.1016/j.clnesp.2019.07.004
- Vitko NP, Grosser MR, Khatri D, et al. Expanded glucose import capability affords Staphylococcus aureus optimized glycolytic flux during infection. mBio. 2016 Jun 21;7(3). doi:10.1128/mBio.00296-16
- Seidl K, Muller S, Francois P, et al. Effect of a glucose impulse on the CcpA regulon in Staphylococcus aureus. BMC Microbiol. 2009 May 18;9:95. doi:10.1186/1471-2180-9-95
- Wu H, Chiou J. Potential benefits of probiotics and prebiotics for coronary heart disease and stroke. Nutrients. 2021 Aug 21;13(8):2878. doi:10.3390/nu13082878
- Gurung M, Li Z, You H, et al. Role of gut microbiota in type 2 diabetes pathophysiology. EBioMedicine. 2020 Jan;51:102590. doi:10.1016/j.ebiom.2019.11.051